Akhila goes to a fair with Rs 20 and wants to have rides on the Giant Wheel and play Hoopla. Represent this situation algebraically and graphically (geometrically).
To represent the situation algebraically and graphically, we can follow these steps:
Step 1: Define the Variables
Let:
- x = cost of one ride on the Giant Wheel
- y = cost of playing Hoopla
Step 2: Formulate the Equation
According to the problem, Akhila has a total of Rs 20 to spend on both activities. Therefore, we can write the equation:
x+y=20
Step 3: Rearrange the Equation
To express y in terms of x, we can rearrange the equation:
y=20−x
Step 4: Find Two Points to Plot
To graph this equation, we need two points. We can choose values for x and calculate the corresponding y values.
1. If x=0:
y=20−0=20(Point A: (0, 20))
2. If x=10:
y=20−10=10(Point B: (10, 10))
3. If x=20:
y=20−20=0(Point C: (20, 0))
Step 5: Plot the Points on a Graph
Now, we can plot the points (0, 20), (10, 10), and (20, 0) on a graph.
Step 6: Draw the Line
After plotting the points, we can draw a straight line through these points. This line represents the equation x+y=20 graphically.
Step 7: Interpret the Graph
The area below the line represents all the combinations of rides on the Giant Wheel and playing Hoopla that Akhila can afford with Rs 20.
Summary
- The algebraic representation of the situation is x+y=20.
- The graphical representation is a straight line plotted through the points (0, 20), (10, 10), and (20, 0).
Let:
- x = cost of one ride on the Giant Wheel
- y = cost of playing Hoopla
According to the problem, Akhila has a total of Rs 20 to spend on both activities. Therefore, we can write the equation:
x+y=20
To express y in terms of x, we can rearrange the equation:
y=20−x
To graph this equation, we need two points. We can choose values for x and calculate the corresponding y values.
y=20−0=20(Point A: (0, 20))
y=20−10=10(Point B: (10, 10))
y=20−20=0(Point C: (20, 0))
Now, we can plot the points (0, 20), (10, 10), and (20, 0) on a graph.
After plotting the points, we can draw a straight line through these points. This line represents the equation x+y=20 graphically.
The area below the line represents all the combinations of rides on the Giant Wheel and playing Hoopla that Akhila can afford with Rs 20.
- The algebraic representation of the situation is x+y=20.
- The graphical representation is a straight line plotted through the points (0, 20), (10, 10), and (20, 0).
Similar Questions
Romila went to a stationery shop and purchased 2 pencils and 3 erasers for Rs 9. Her friend Sonali saw the new variety of pencils and erasers with Romila, and she also bought 4 pencils and 6 erasers of the same land for Rs 18. Represent this situation algebraically and graphically.
View SolutionAkhila went to a fair in her village. She wanted to enjoy rides on the Giant Wheel and play Hoopla (a game in which you throw a ring on the items kept in the stall, and if the ring covers any object completely you get it). The number of times she played Hoopla is half the number of rides she had on the Giant Wheel. Each rides costs Rs 3, and a game of Hoopla costs Rs 4. If she spent Rs 20 in the fair, represent this situation algebraically and graphically.
View Solution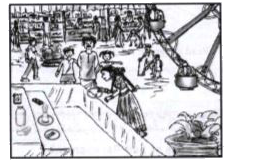
Akhila went to a fair in her village. She wanted to enjoy rides on the Giant wheel and play Hoopla (a game in which you throw a ring on the items kept in a stall, and if the ring covers any object completely, you get it) The number of times she played Hoopla is half the number of rides she had on the Giant wheel. The cost of each ride is Rs 3 and the cost of each game of Hoopla is Rs 4. She spent Rs 20 on both the game.
Find the number of rides that Akhila had on the Giant wheel.
View Solution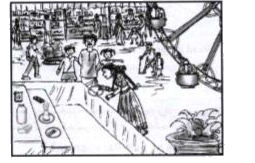
Akhila went to a fair in her village. She wanted to enjoy rides on the Giant wheel and play Hoopla (a game in which you throw a ring on the items kept in a stall, and if the ring covers any object completely, you get it) The number of times she played Hoopla is half the number of rides she had on the Giant wheel. The cost of each ride is Rs 3 and the cost of each game of Hoopla is Rs 4. She spent Rs 20 on both the game.
Find the number of times Akhila played Hoopla.
View Solution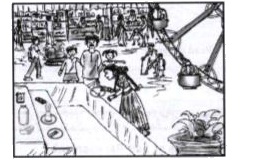
Akhila went to a fair in her village. She wanted to enjoy rides on the Giant wheel and play Hoopla (a game in which you throw a ring on the items kept in a stall, and if the ring covers any object completely, you get it) The number of times she played Hoopla is half the number of rides she had on the Giant wheel. The cost of each ride is Rs 3 and the cost of each game of Hoopla is Rs 4. She spent Rs 20 on both the game.
Find the amount that she spent on ride of Giant wheel.
View Solution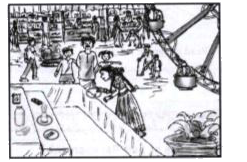
Akhila went to a fair in her village. She wanted to enjoy rides on the Giant wheel and play Hoopla (a game in which you throw a ring on the items kept in a stall, and if the ring covers any object completely, you get it) The number of times she played Hoopla is half the number of rides she had on the Giant wheel. The cost of each ride is Rs 3 and the cost of each game of Hoopla is Rs 4. She spent Rs 20 on both the game.
Find the amount that she spent on playing Hoopla
View Solution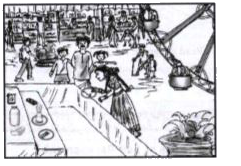
Akhila went to a fair in her village. She wanted to enjoy rides on the Giant wheel and play Hoopla (a game in which you throw a ring on the items kept in a stall, and if the ring covers any object completely, you get it) The number of times she played Hoopla is half the number of rides she had on the Giant wheel. The cost of each ride is Rs 3 and the cost of each game of Hoopla is Rs 4. She spent Rs 20 on both the game.
Write the two equations from the given information.
View SolutionThe coach of a cricket team buys 3 bats and 6 balls for Rs 3900. Later, she buys another bat and 2 more balls of the same kind for Rs 1300. Represent this situation algebraically and geometrically.
View SolutionThe coach of a cricket team buys 3 bats and 6 balls for Rs 3900. Later, he buys another bat and 3 more balls of the same kind for Rs 1300. Represent this situation algebraically and geometrically.
View SolutionThe coach of a cricket team buys 3 bats and 6 balls for Rs 3,900. Later, she buys another bat and 3 more ball of the same kind for Rs 1,300. Represent this situation algebraically and geometrically.
View Solution
