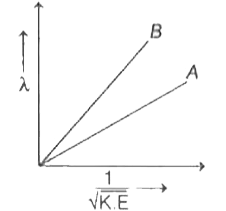
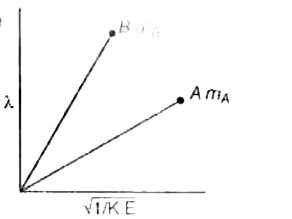
The following plot represents the de-Broglie wavelength as a function of the kinetic energy (K.E.) of two particles A and B. Identify the correct relation
 Solution in Telugu
The correct Answer is:C

E = K.E
As increasing mass of partical
slope of decreases
Topper's Solved these Questions
Similar Questions
The work function (W0) of Li, K, Mg, Ag and Cu are 2.42, 2.25, 3.70, 4.80 eV respectively. The number of metals which undergo photoelectric effect if a radiation of wavelength 540 nm falls on them is
(1 eV = 1.602×10⁻¹⁹ J)
View SolutionWhen one mole of A and one mole of B were heated in a one litre flask at T(K), 0.5 moles of C were formed at equilibrium
A+B⇔C+D
The equilibrium constant KC is
View SolutionDe-Broglie wavelengths of the particle increases by 75% then kinetic energy of particle becomes.
View SolutionFor particles having same K.E., the de-Broglie wavelength is
View SolutionIf the kinetic energy of a particle is doubled, de Broglie wavelength becomes:
View SolutionIf the kinetic energy of a particle is doubled, De-Broglie wavelength becomes :
View SolutionK गतिज ऊर्जा वाले कर्ण की डी ब्रोग्ली तरंगदैर्ध्य λ है यदि कण की गतिज ऊर्जा k/4 हो जाये तो डी ब्रोग्ली तरंगदैर्ध्य कितनी हो जायगी
View SolutionThe de Broglie wavelength (lambda) of a particle is related to its kinetic energy E as
View SolutionDraw a plot showing the variation of de-Broglie wavelength of electron as a function of its kinetic energy .
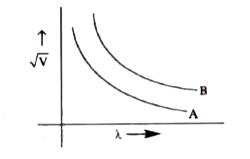
View Solution√V of two particles A and B are plotted against de-Broglie wavelengths. where V is the potential on the particles. Which of the following relation is correct about the mass of particles?

View SolutionThe de-Broglie wavelength λ. of a particle isrelated to its kinetic energyEK as
View SolutionA particle is moving with kinetic energy E. It's de Broglie wavelength is—
View Solutionयदि किसी कण की गतिज ऊर्जा दोगुनी कर दी जाये तो डी-ब्रोग्ली तरंगदैर्ध्य हो जायेगी :
View SolutionIn what way de - Broglie wavelength lambda of a particle is related to K.E?
View SolutionThe de-Broglie wavelength and kinetic energy of a particle is 2000 Å and eV respectively. If its kinetic energy becomes 1 MeV, then its de-Broglie wavelength is
View Solution
