The following diagram correctly depicts the producer's equilibrium in case of constant prices:
A
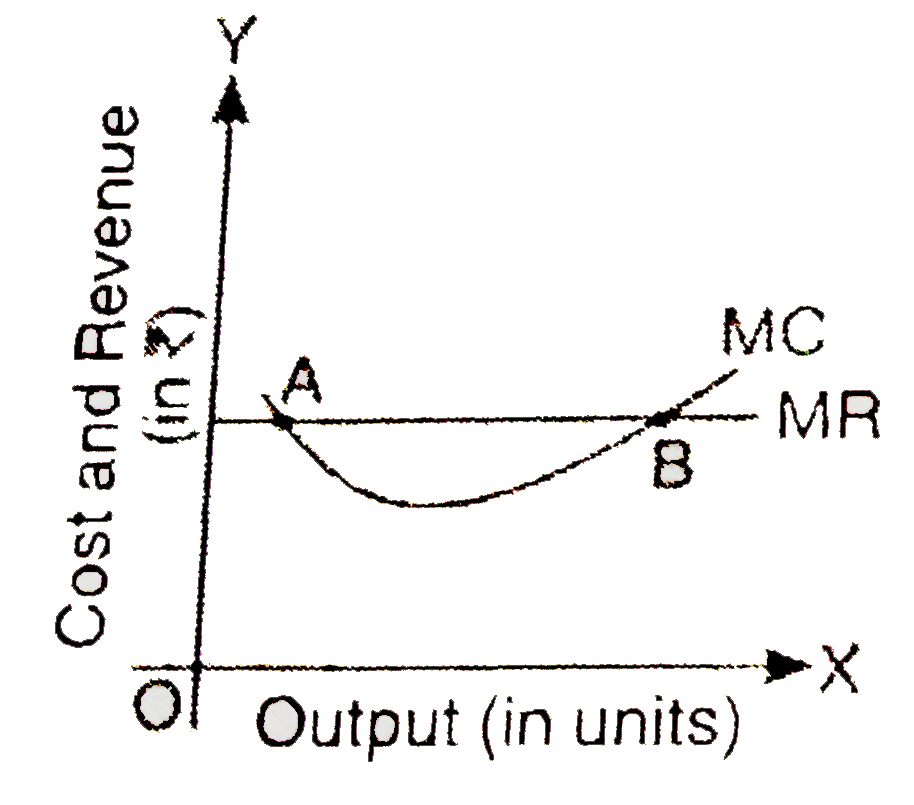
B
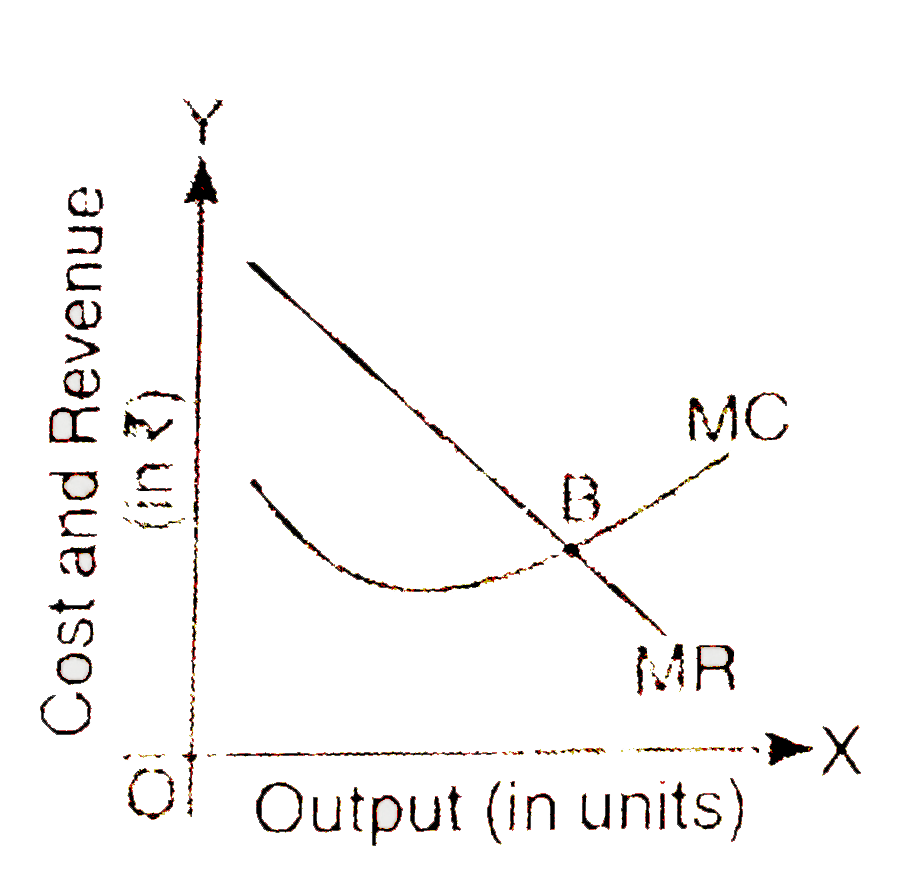
C
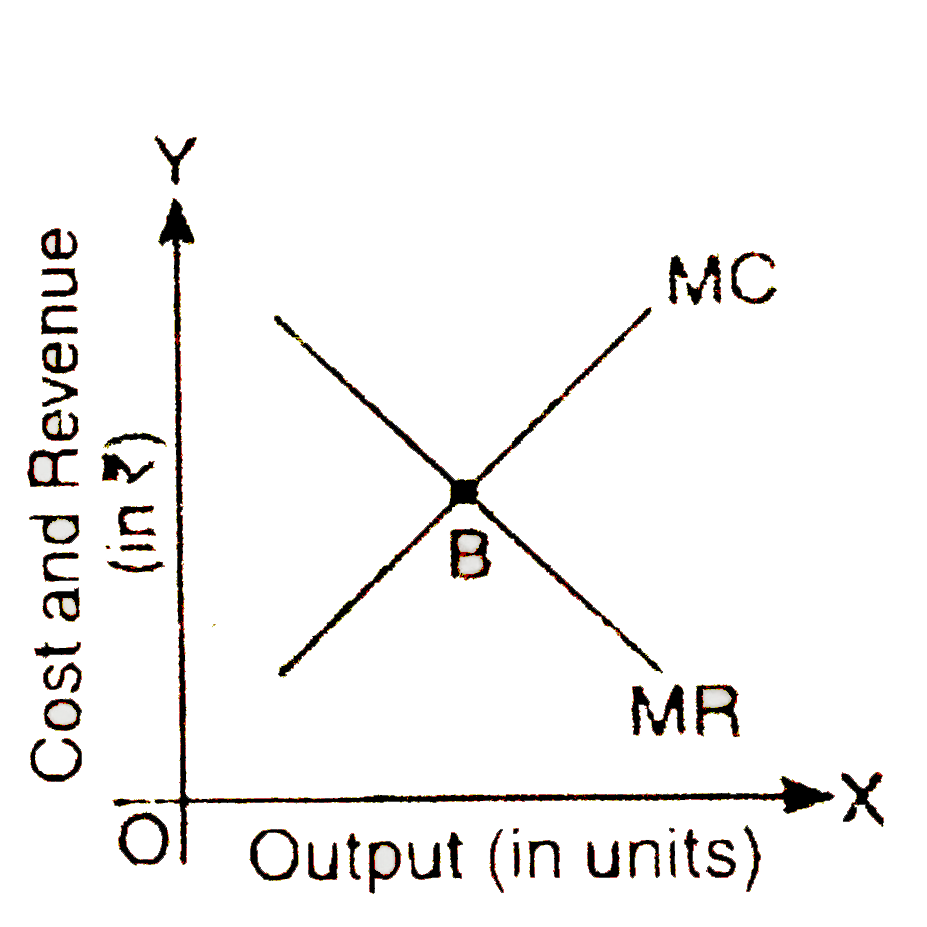
D
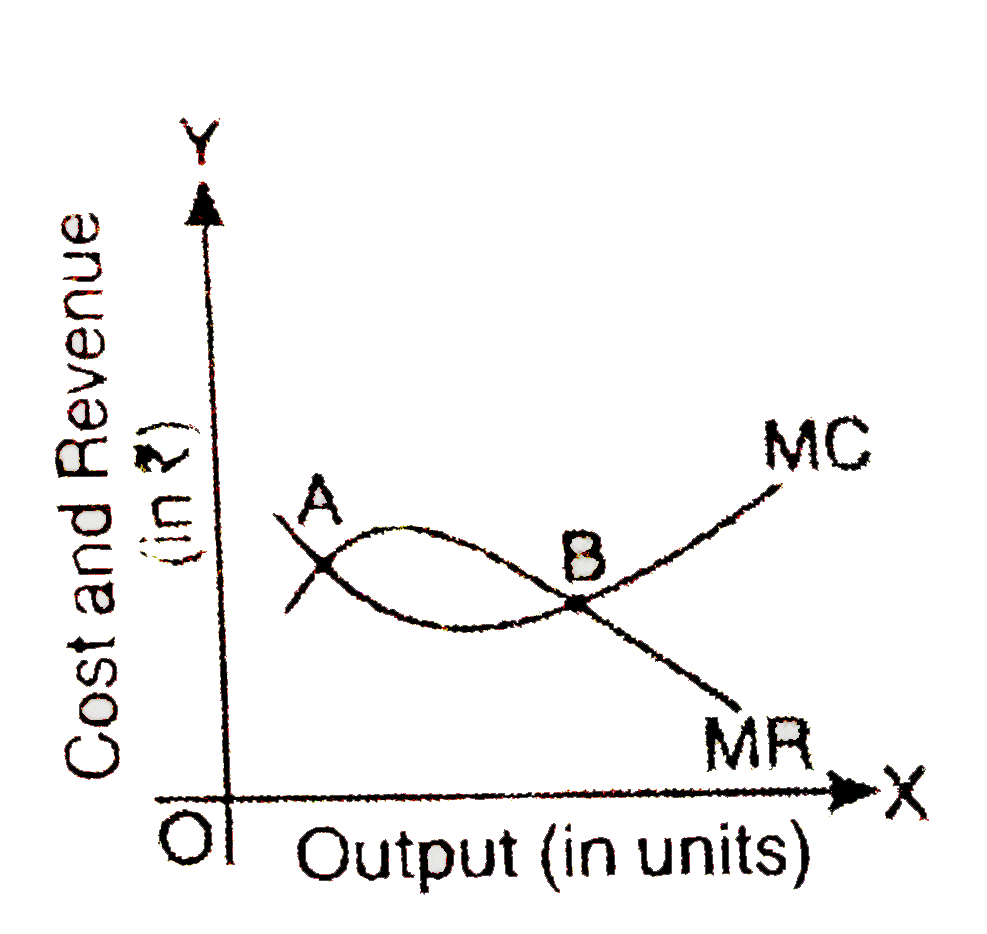
Video Solution
Text Solution
The correct Answer is:A
N/a
|
Updated on:21/07/2023
Topper's Solved these Questions
- BOOK - SANDEEP GARGCHAPTER - PRODUCER'S EQUILIBRIUMEXERCISE - Very Short Answer Type7videos
PRODUCER'S EQUILIBRIUM
- BOOK - SANDEEP GARGCHAPTER - PRODUCER'S EQUILIBRIUMEXERCISE - Unsolved Practicals12videos
PRODUCER'S EQUILIBRIUM
- BOOK - SANDEEP GARGCHAPTER - PRODUCER'S EQUILIBRIUMEXERCISE - Guidelines To NCERT6videos
PRODUCER'S EQUILIBRIUM
- BOOK - SANDEEP GARGCHAPTER - PRICE DETERMINATION AND SIMPLE APPLICATIONSEXERCISE - Long Answer Type Questions28videos
PRICE DETERMINATION AND SIMPLE APPLICATIONS
- BOOK - SANDEEP GARGCHAPTER - PRODUCTION FUNCTIONEXERCISE - Practicals on TP, AP and MP14videos
PRODUCTION FUNCTION
Similar Questions
Knowledge Check
- Question 1 - Select One
The following diagram depicts the situation of :
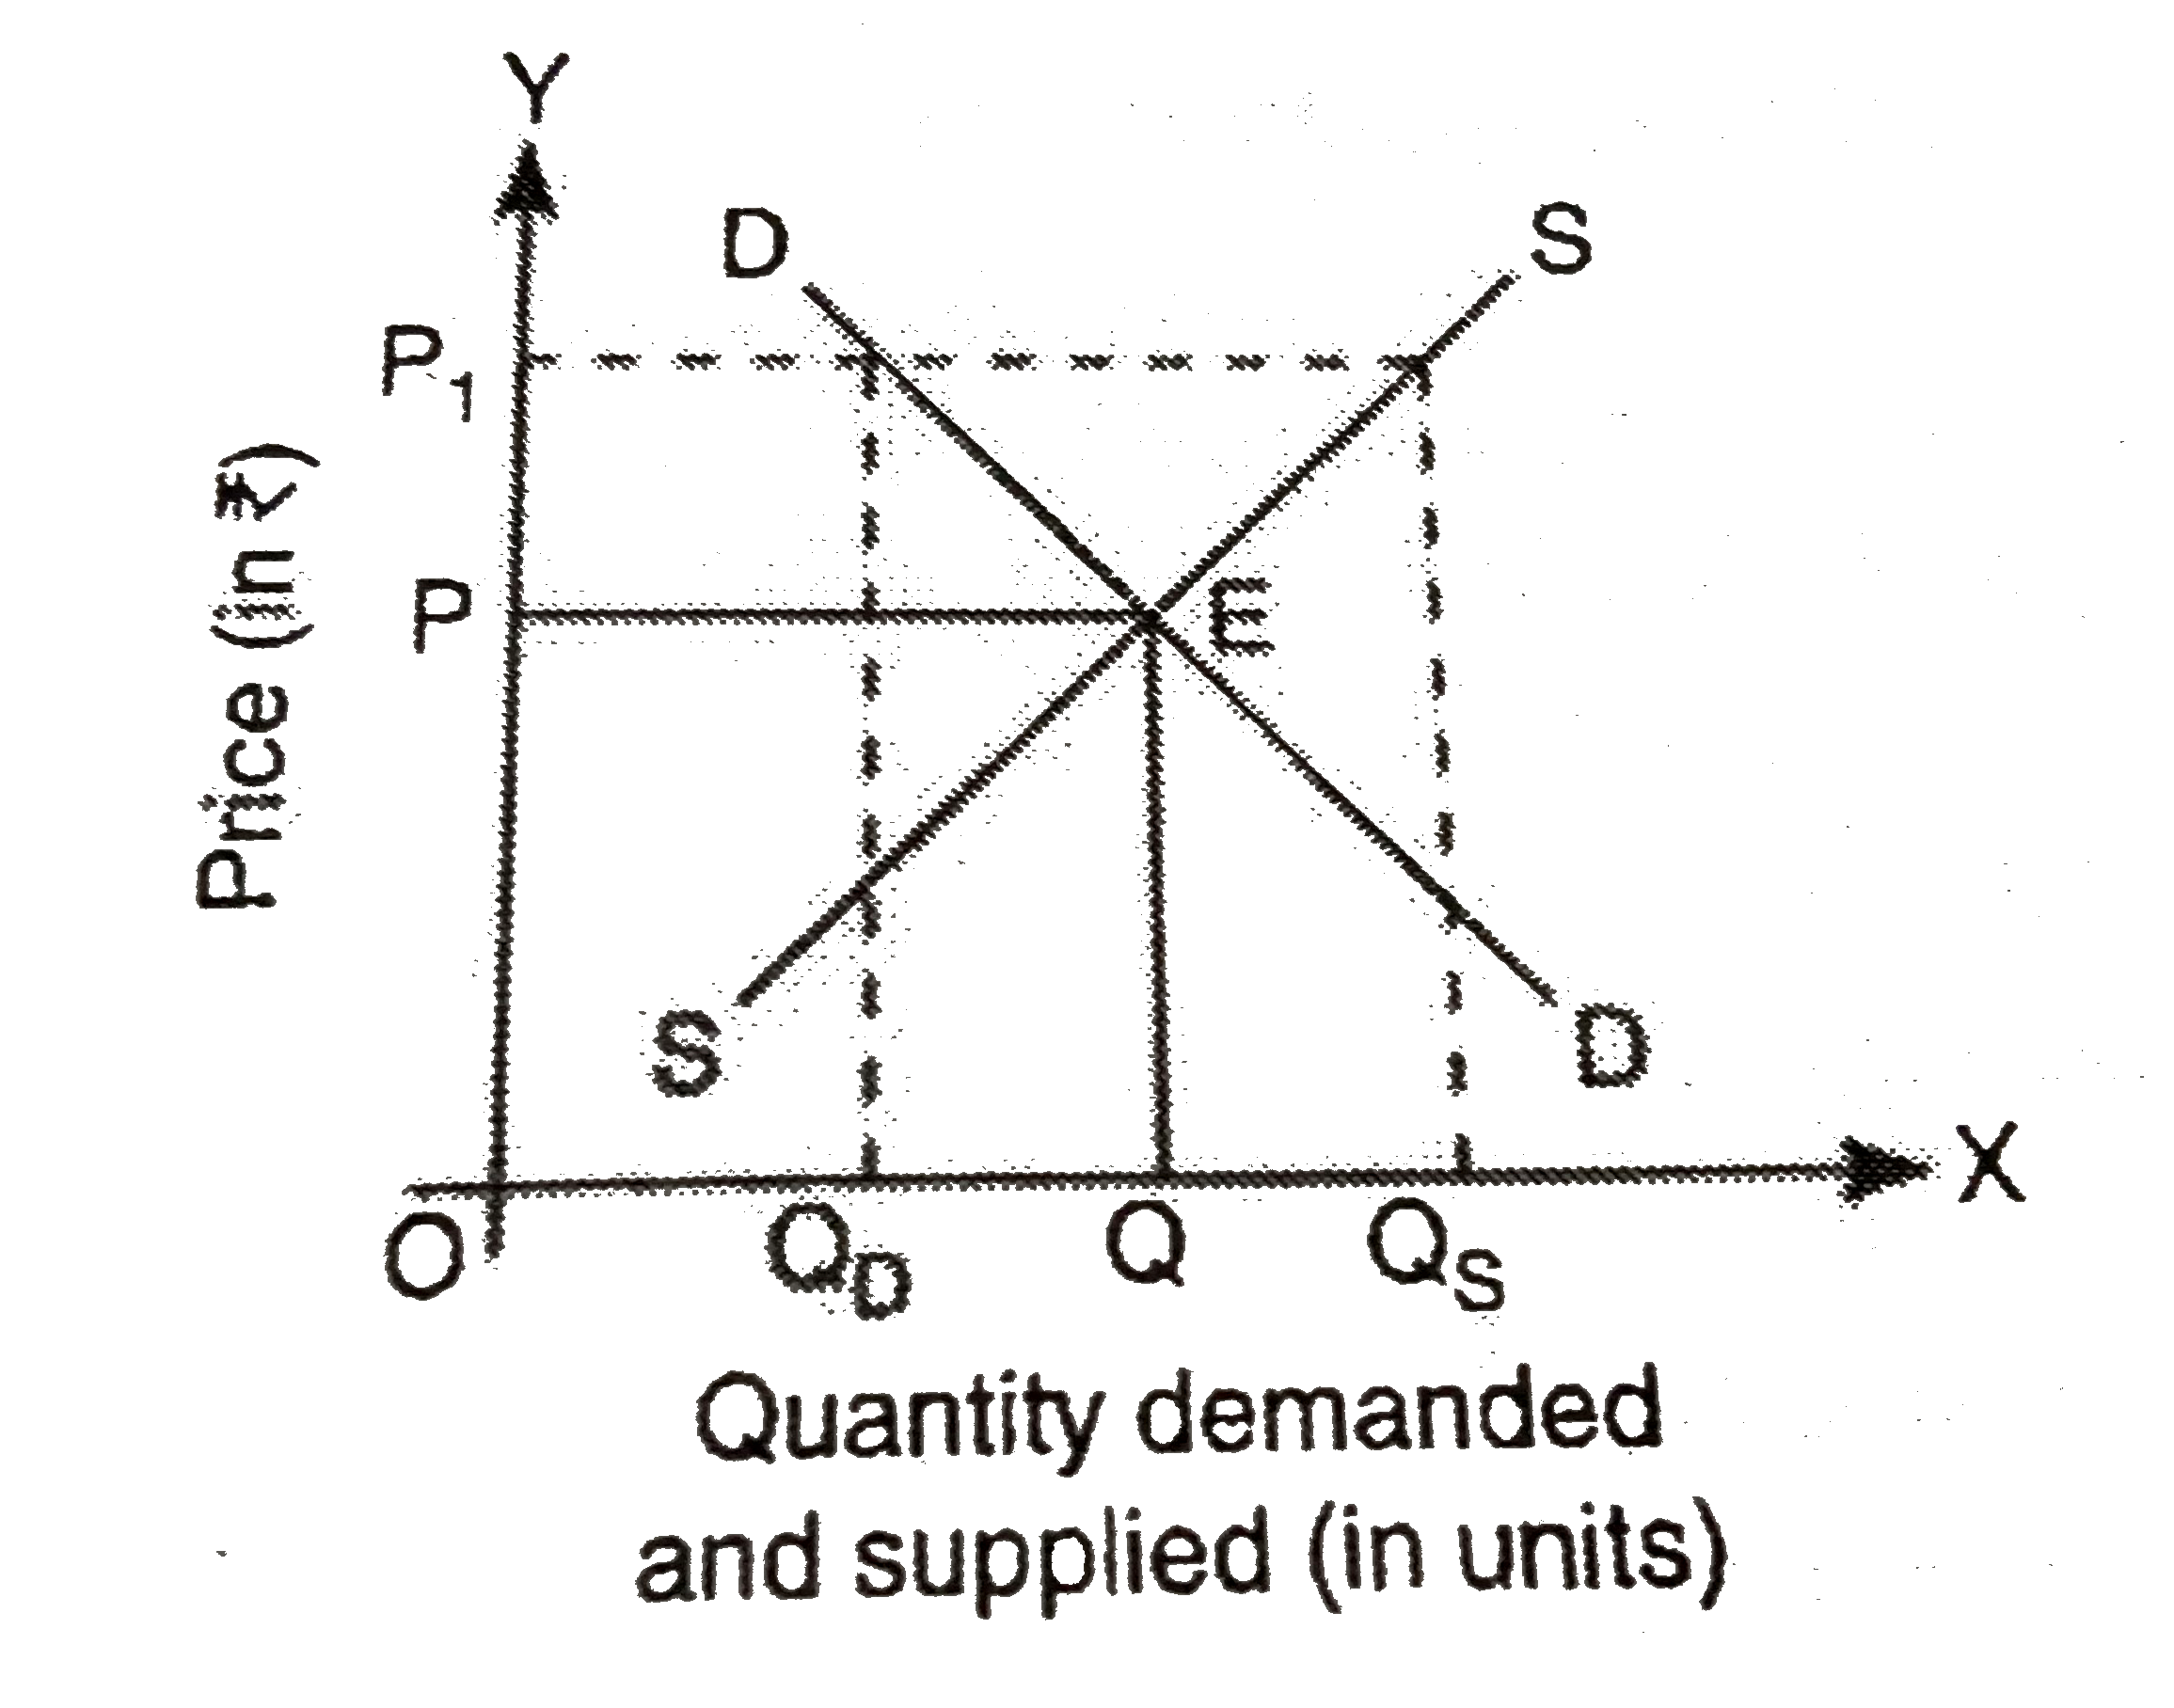 AExcess SupplyBExcess DemandCEquilibrium ConditionDNone of these
 - Question 2 - Select One
Which of the following diagram correctly depicts the situation of Less Demand ?
A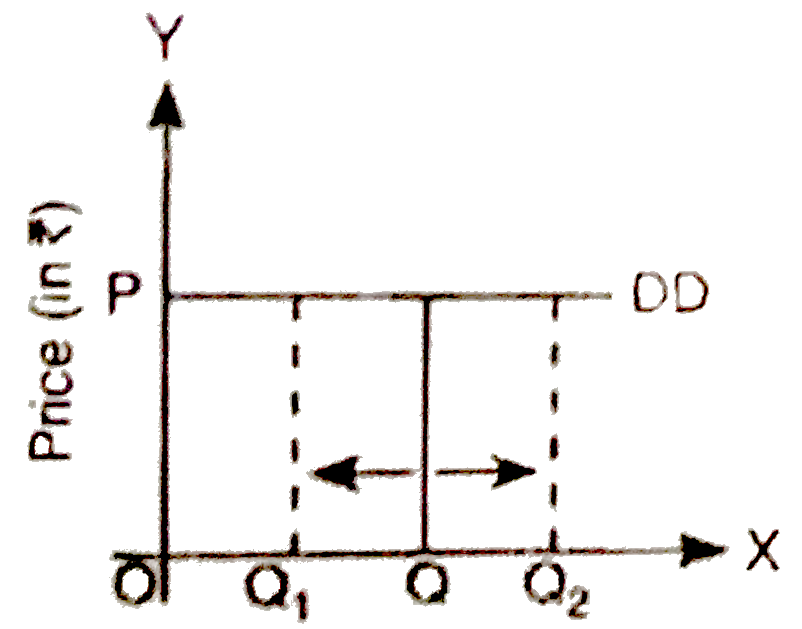 B
B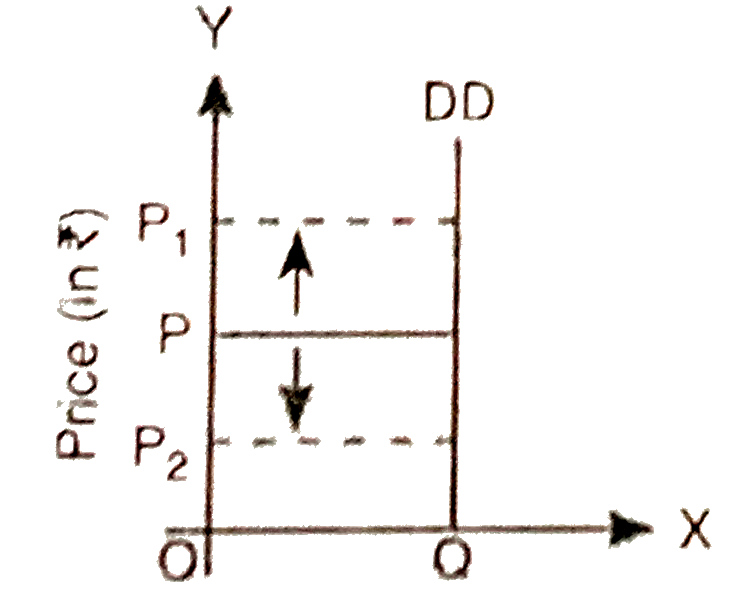 C
C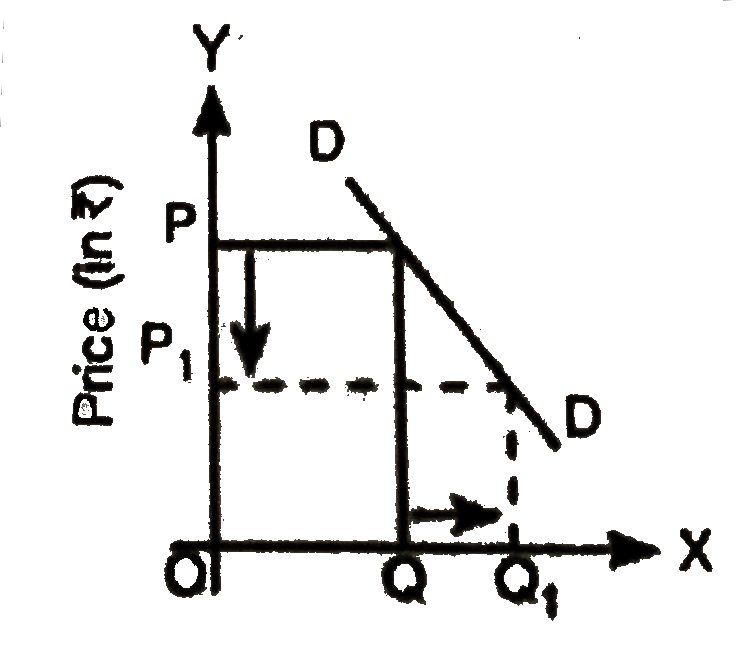 D
D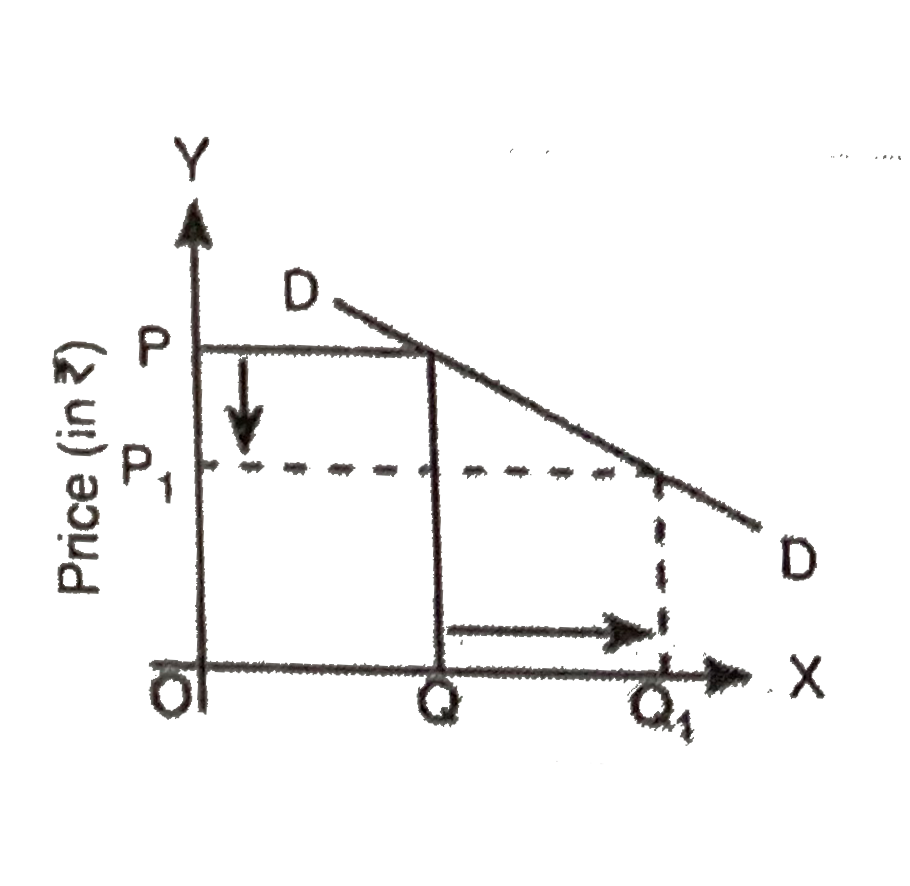
- Question 3 - Select One
Which of the following diagram correctly depicts the relation between AR and MR when price falls with rise in output ?
A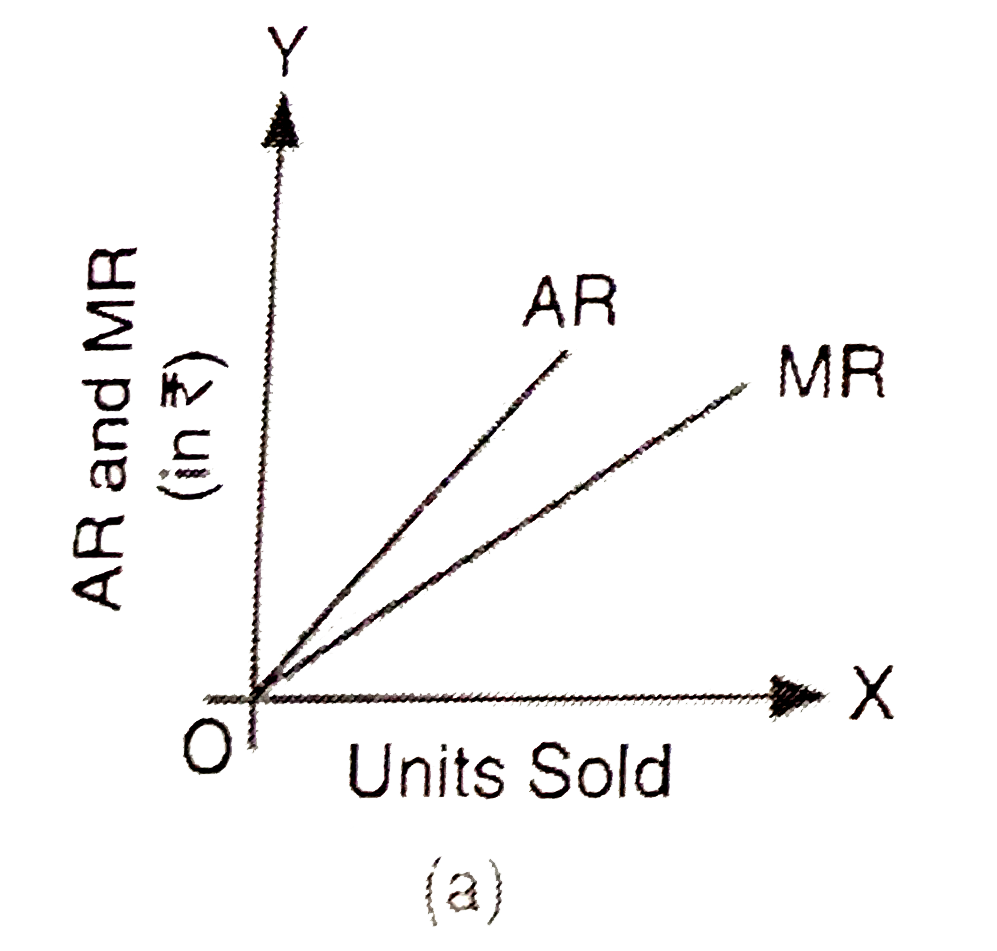 B
B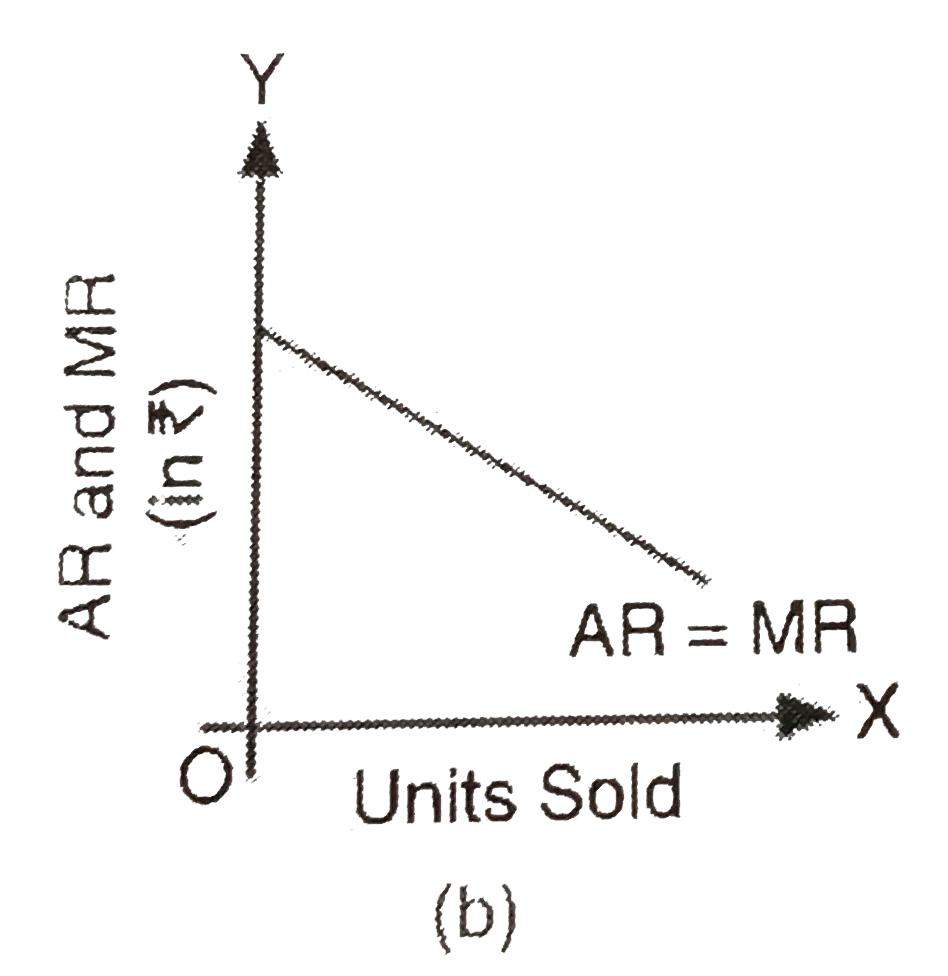 C
C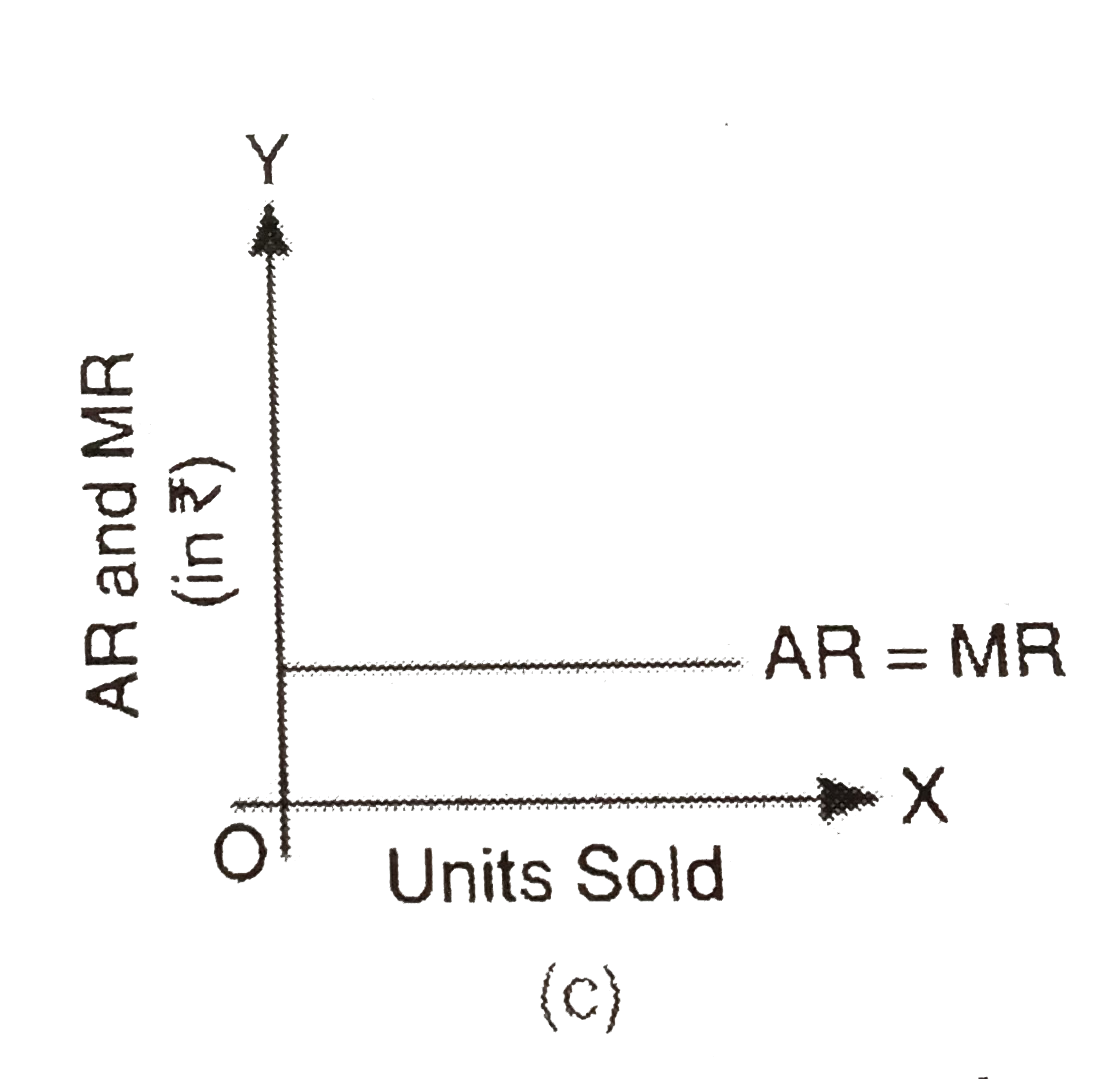 D
D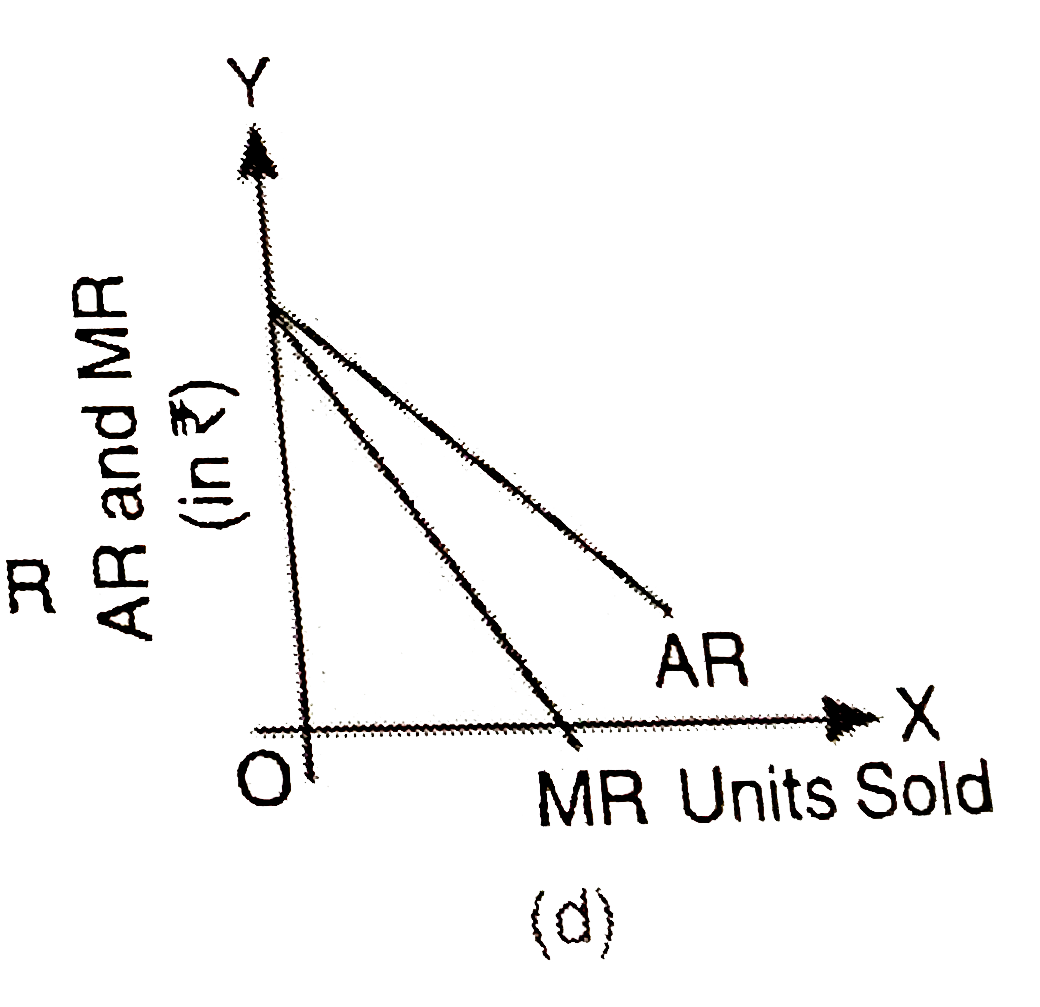
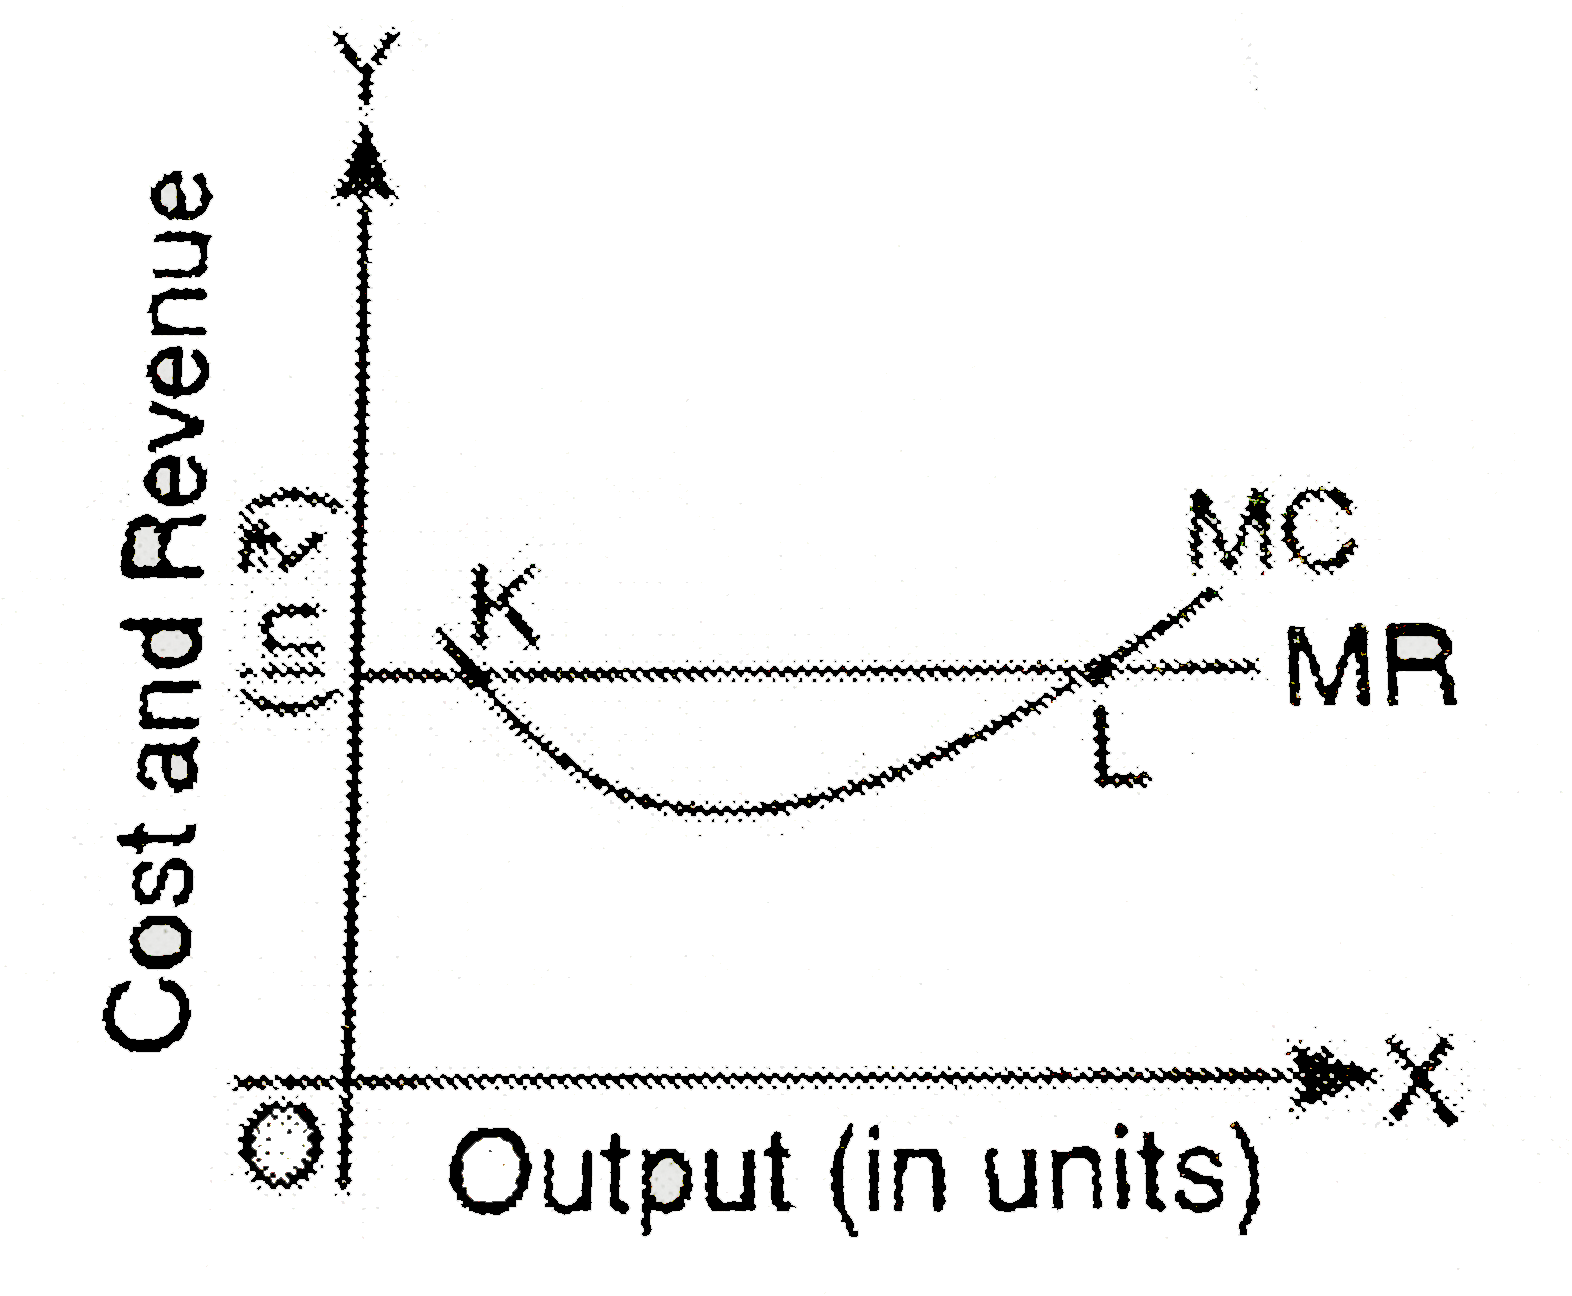
In the following diagram , producer's equilibrium is achieved at poin _________
 View Solution
Which of the following diagram correctly depicts the ralation between AC and MC ?
View Solutionwhich of the following diagram correctly depicts the situation of Unitary Elastic Supply ?
View SolutionIn the case of forward biasing of p-n junction, which one of the following figures correctly depicts the directioin of the flow of charge carriers?
View SolutionWhich diagram correctly depicts total variable cost curve :
View Solution


