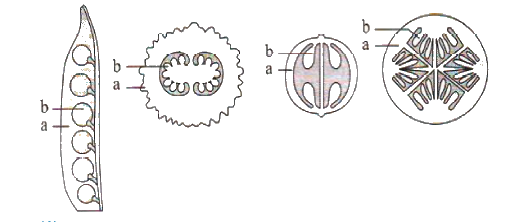
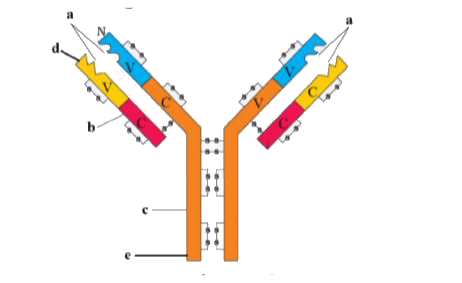
Recognise the figure and find out the correct statements
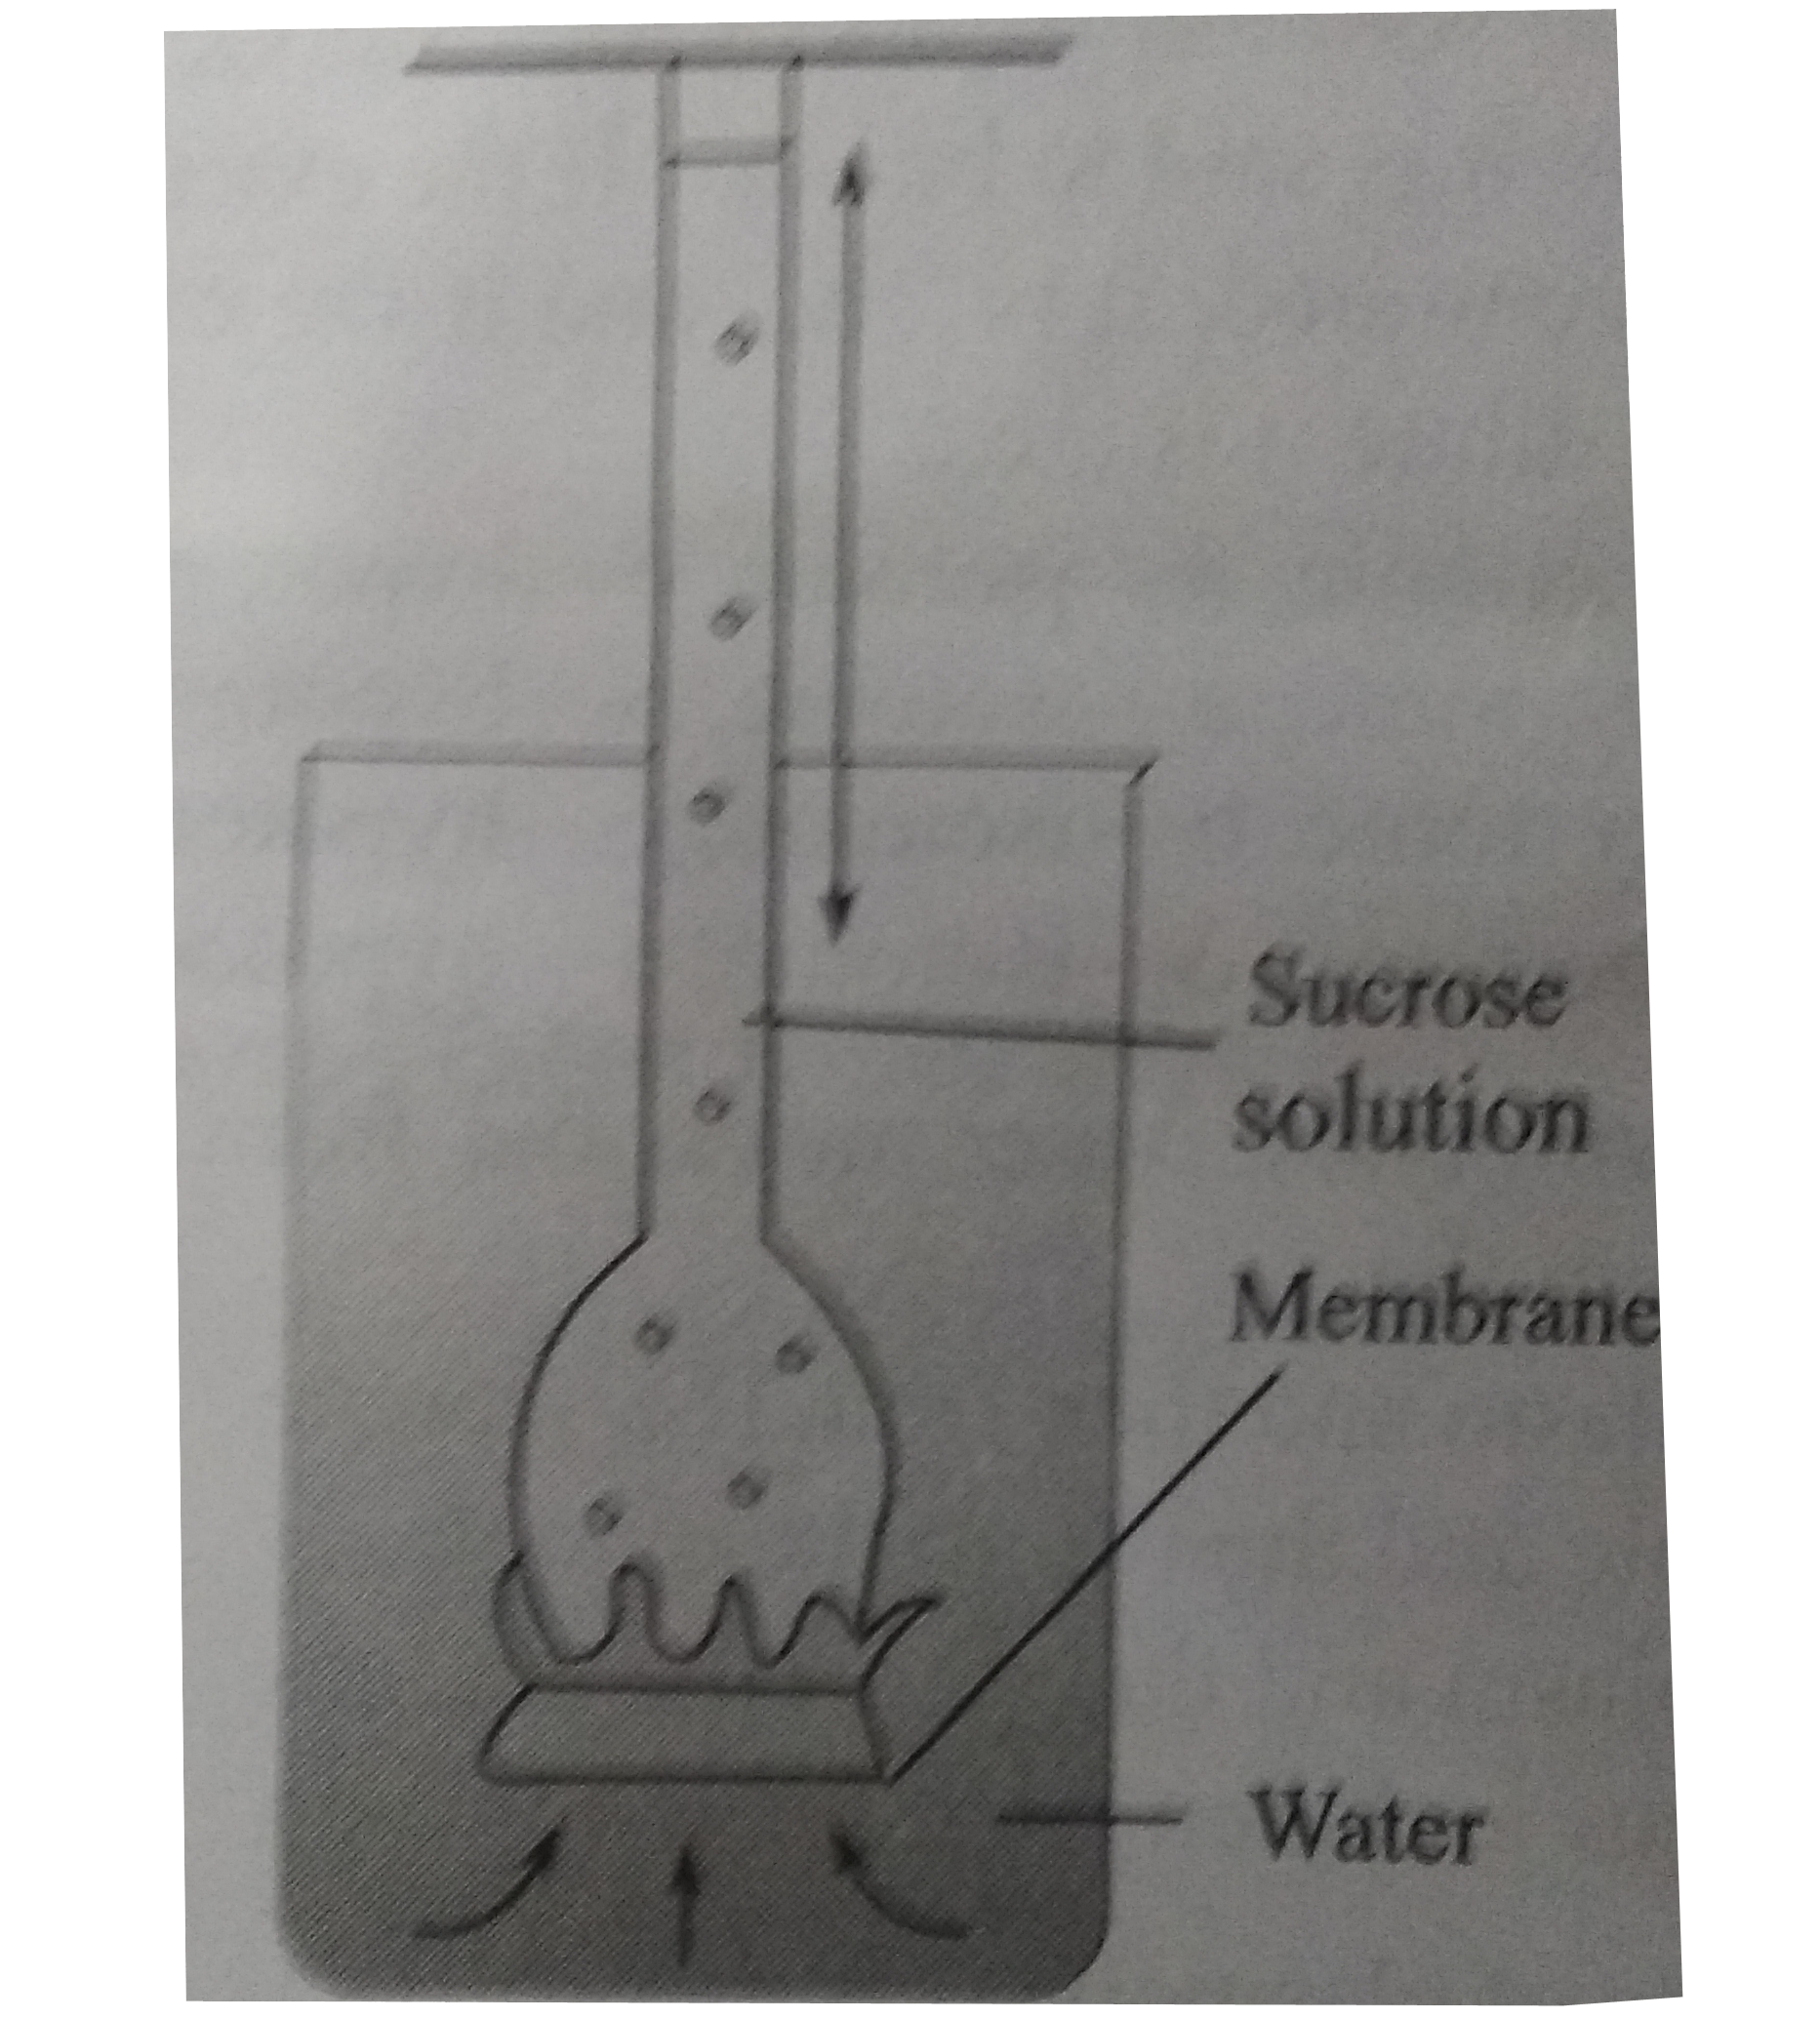
This figure shows
A
The demonstration of rate by thistle funnle experment.
B
The demonstration of the rate of osmosis by potato osmometer
C
The demonstration of osmosis by thistle funnel expeiment
D
The domonstration of translocation mineral solutes up a plant.
Video Solution
Text Solution
The correct Answer is:C
The given figure shows demonstration osmossi by thistle funnel experiment
|
Updated on:21/07/2023
Topper's Solved these Questions
- BOOK - A2ZCHAPTER - TRANSPORT IN PLANTSEXERCISE - Section A : Topicwise Questions Topic 3 : Long Distance Transport Of Water26videos
TRANSPORT IN PLANTS
- BOOK - A2ZCHAPTER - TRANSPORT IN PLANTSEXERCISE - Section A : Topicwise Questions Topic 4 : Transpiration , Uptake And Transport Of Minerals Nutrients11videos
TRANSPORT IN PLANTS
- BOOK - A2ZCHAPTER - TRANSPORT IN PLANTSEXERCISE - Section-d Chapter-end Test50videos
TRANSPORT IN PLANTS
- BOOK - A2ZCHAPTER - THE LIVING WORLDEXERCISE - Section D : Chapter-end Test50videos
THE LIVING WORLD
Similar Questions
Knowledge Check
- Question 1 - Select One
Recognise the figure and find out the correct statement(s).
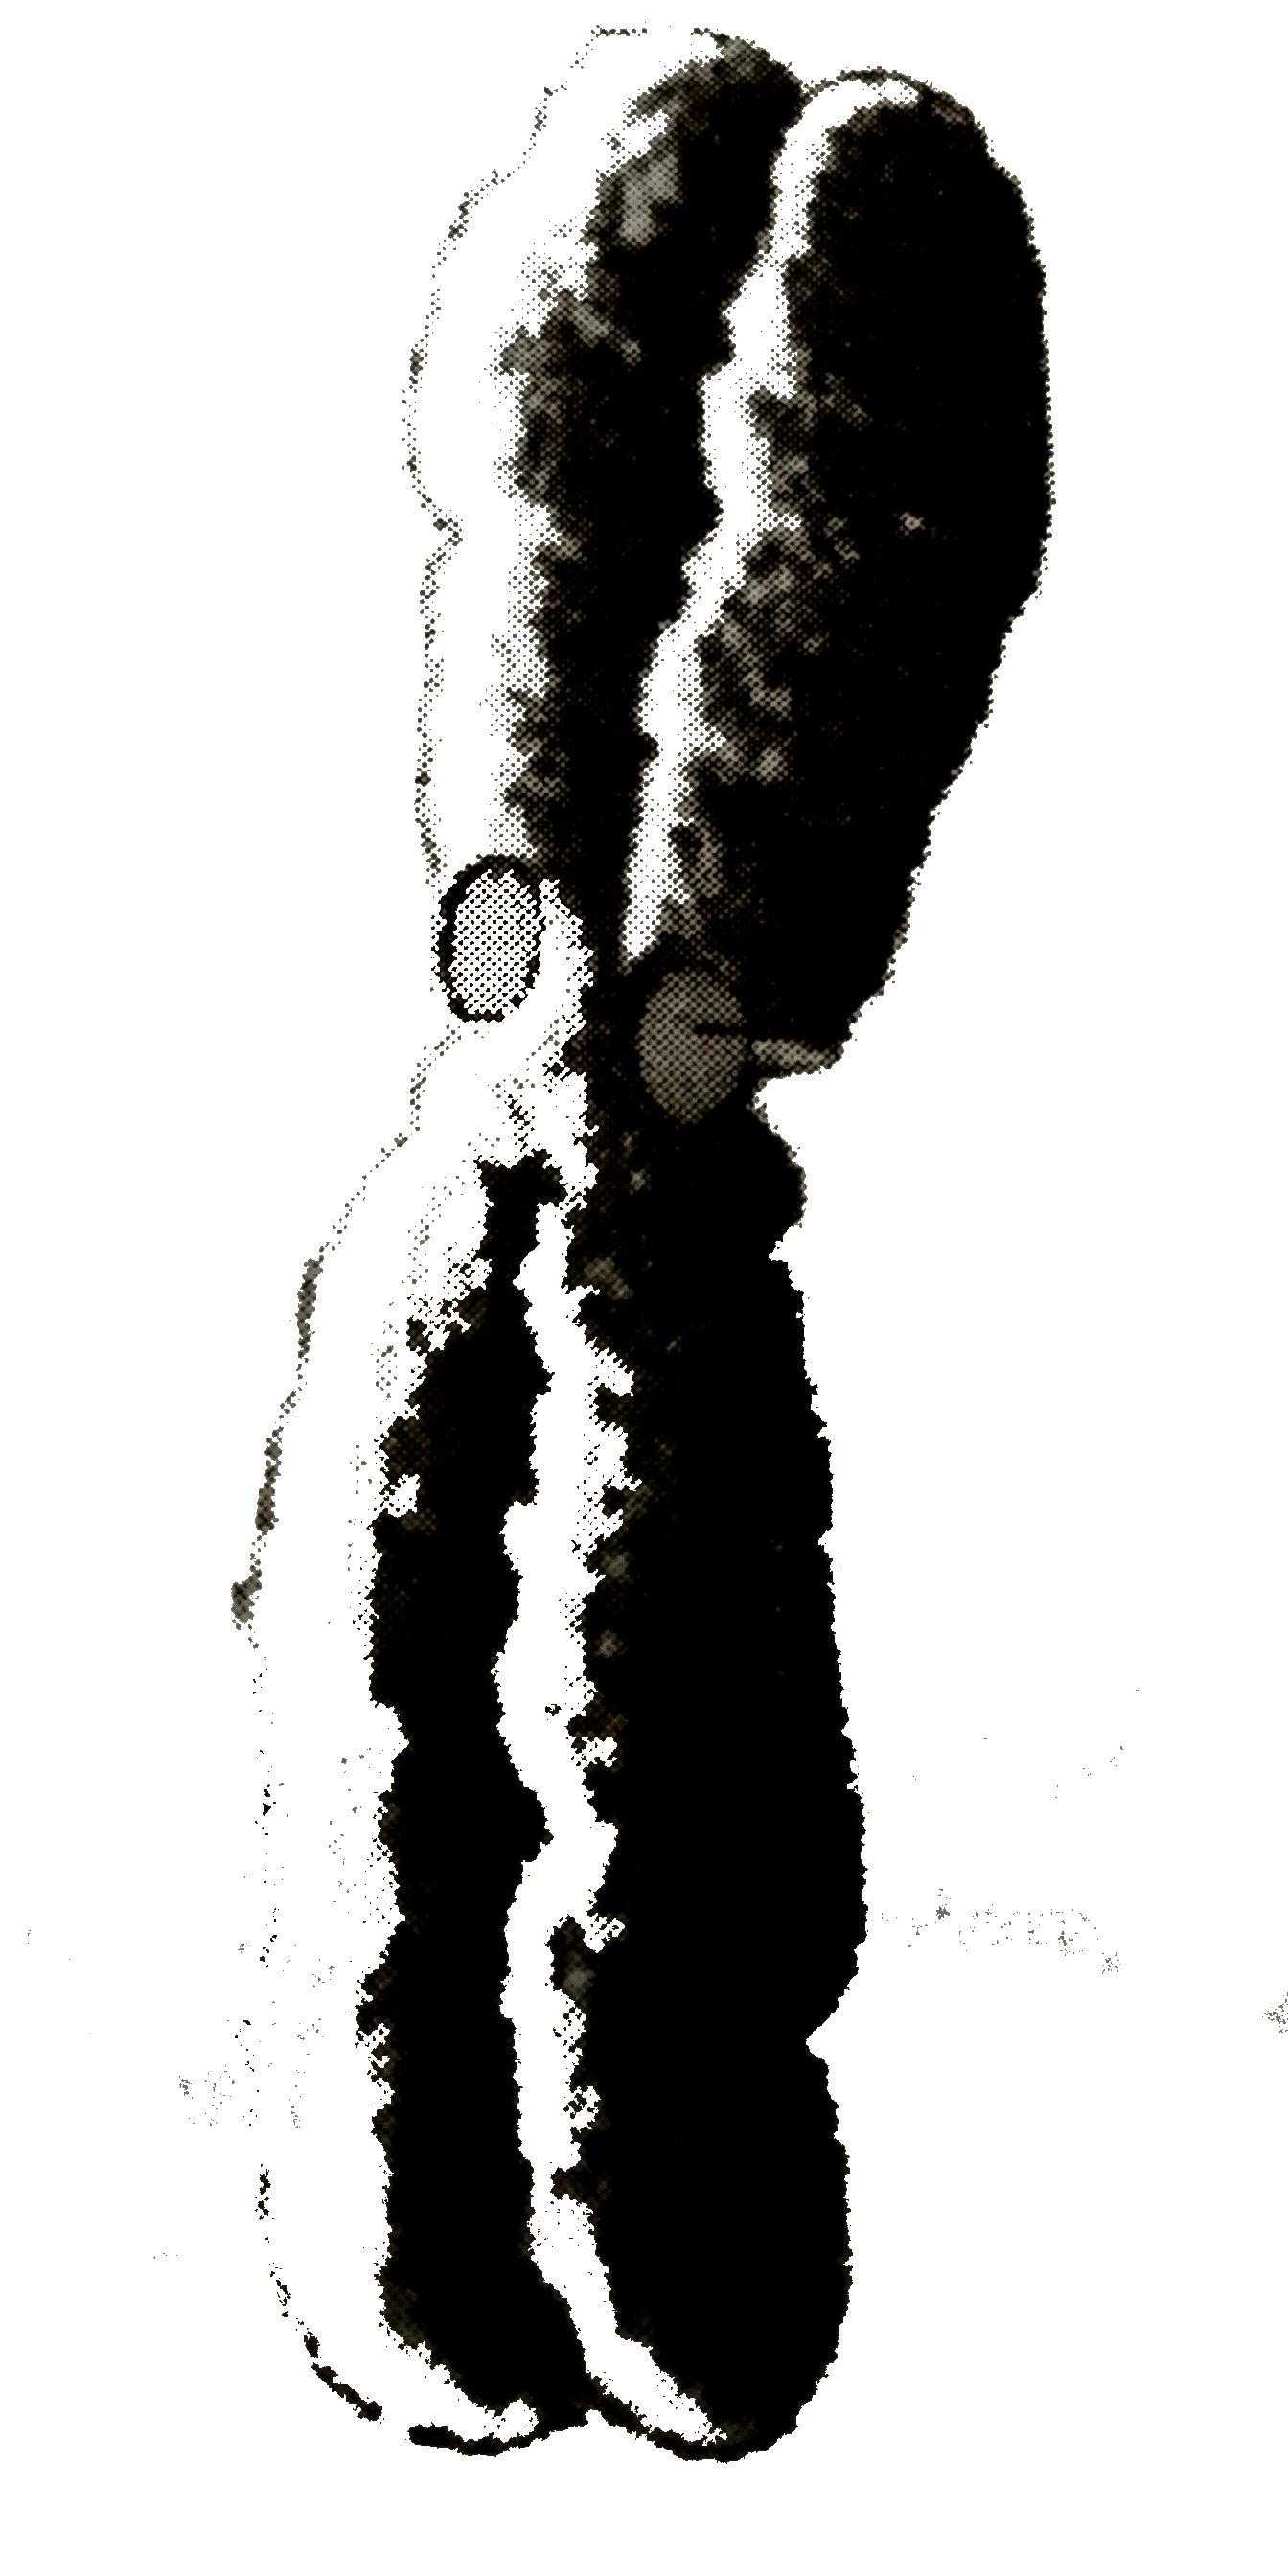 AGiven figure shows a chromosome with two centrome on surface of it.BGiven figure shows a chromosome with two kinetochores on surface of it.CGiven figure shows a chromosome with two chromatids attached at primary constrictionDBoth B and C
 - Question 2 - Select One
Recognise the figure and find out the correct match .
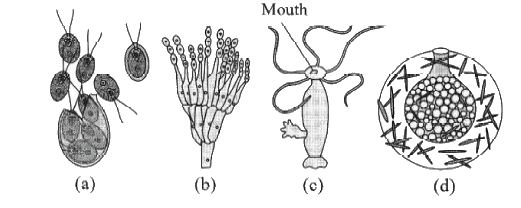
 Aa-iii,b-ii,c-I,d-ivBa-iv,b-I,c-iii,d-iiCa-iii,b-ii,c-iv,d-iDa-iii,b-I,c-iv,d-ii
 - Question 3 - Select One
Recognise the figure and find out the correct matching
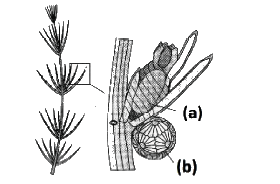 Aa-Archaegonium(male), b-antheridium (female sex organ)Ba-antheridium (female sex organ), b-oogonium (male sex organ)Ca-oogonium (female sex organ), b-antheridium (male sex organ)Da-antheridium (male sex organ), b-oogonium (female sex organ)
Recognise the figure and find out the correct matching.
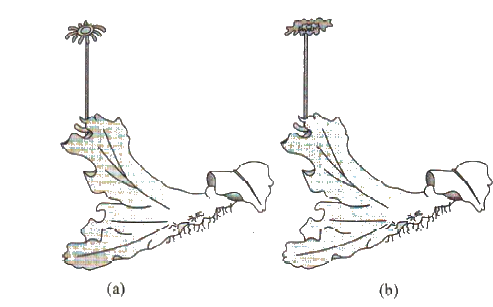 View Solution
Recognise the figure and find out the correct matching.
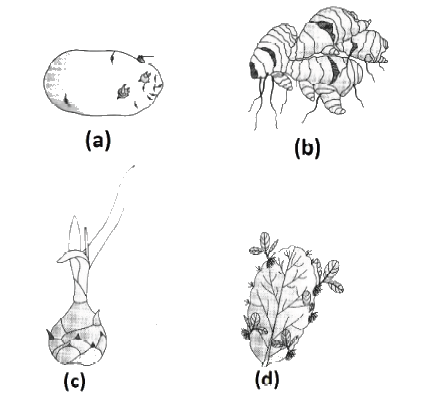 View Solution
Recognise the figure and find out the correct matching
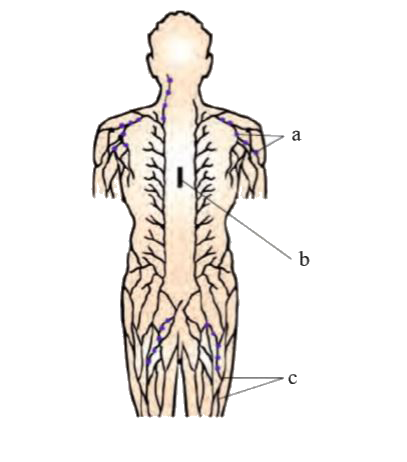 View Solution
Recognise the figure and find out the correct matching
 View Solution
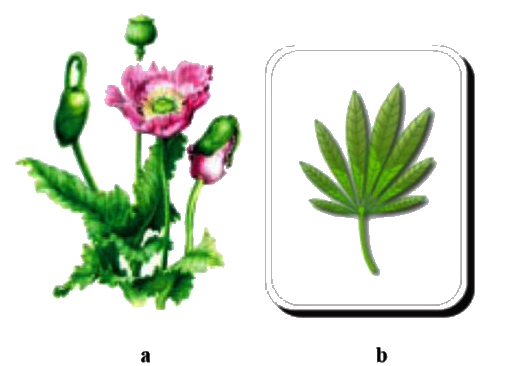
Recognise the figure and find out the correct matching
 View Solution


