Derive Supply Curve from Rising Part of Marginal Cost (MC) Curve
Derivation of Supply Curve from Rishing Part fo Marginal Cost (MC) Curve.
Supply curve finds its origin from the rising potion of marginal cost curve in a perfectly completitive market.
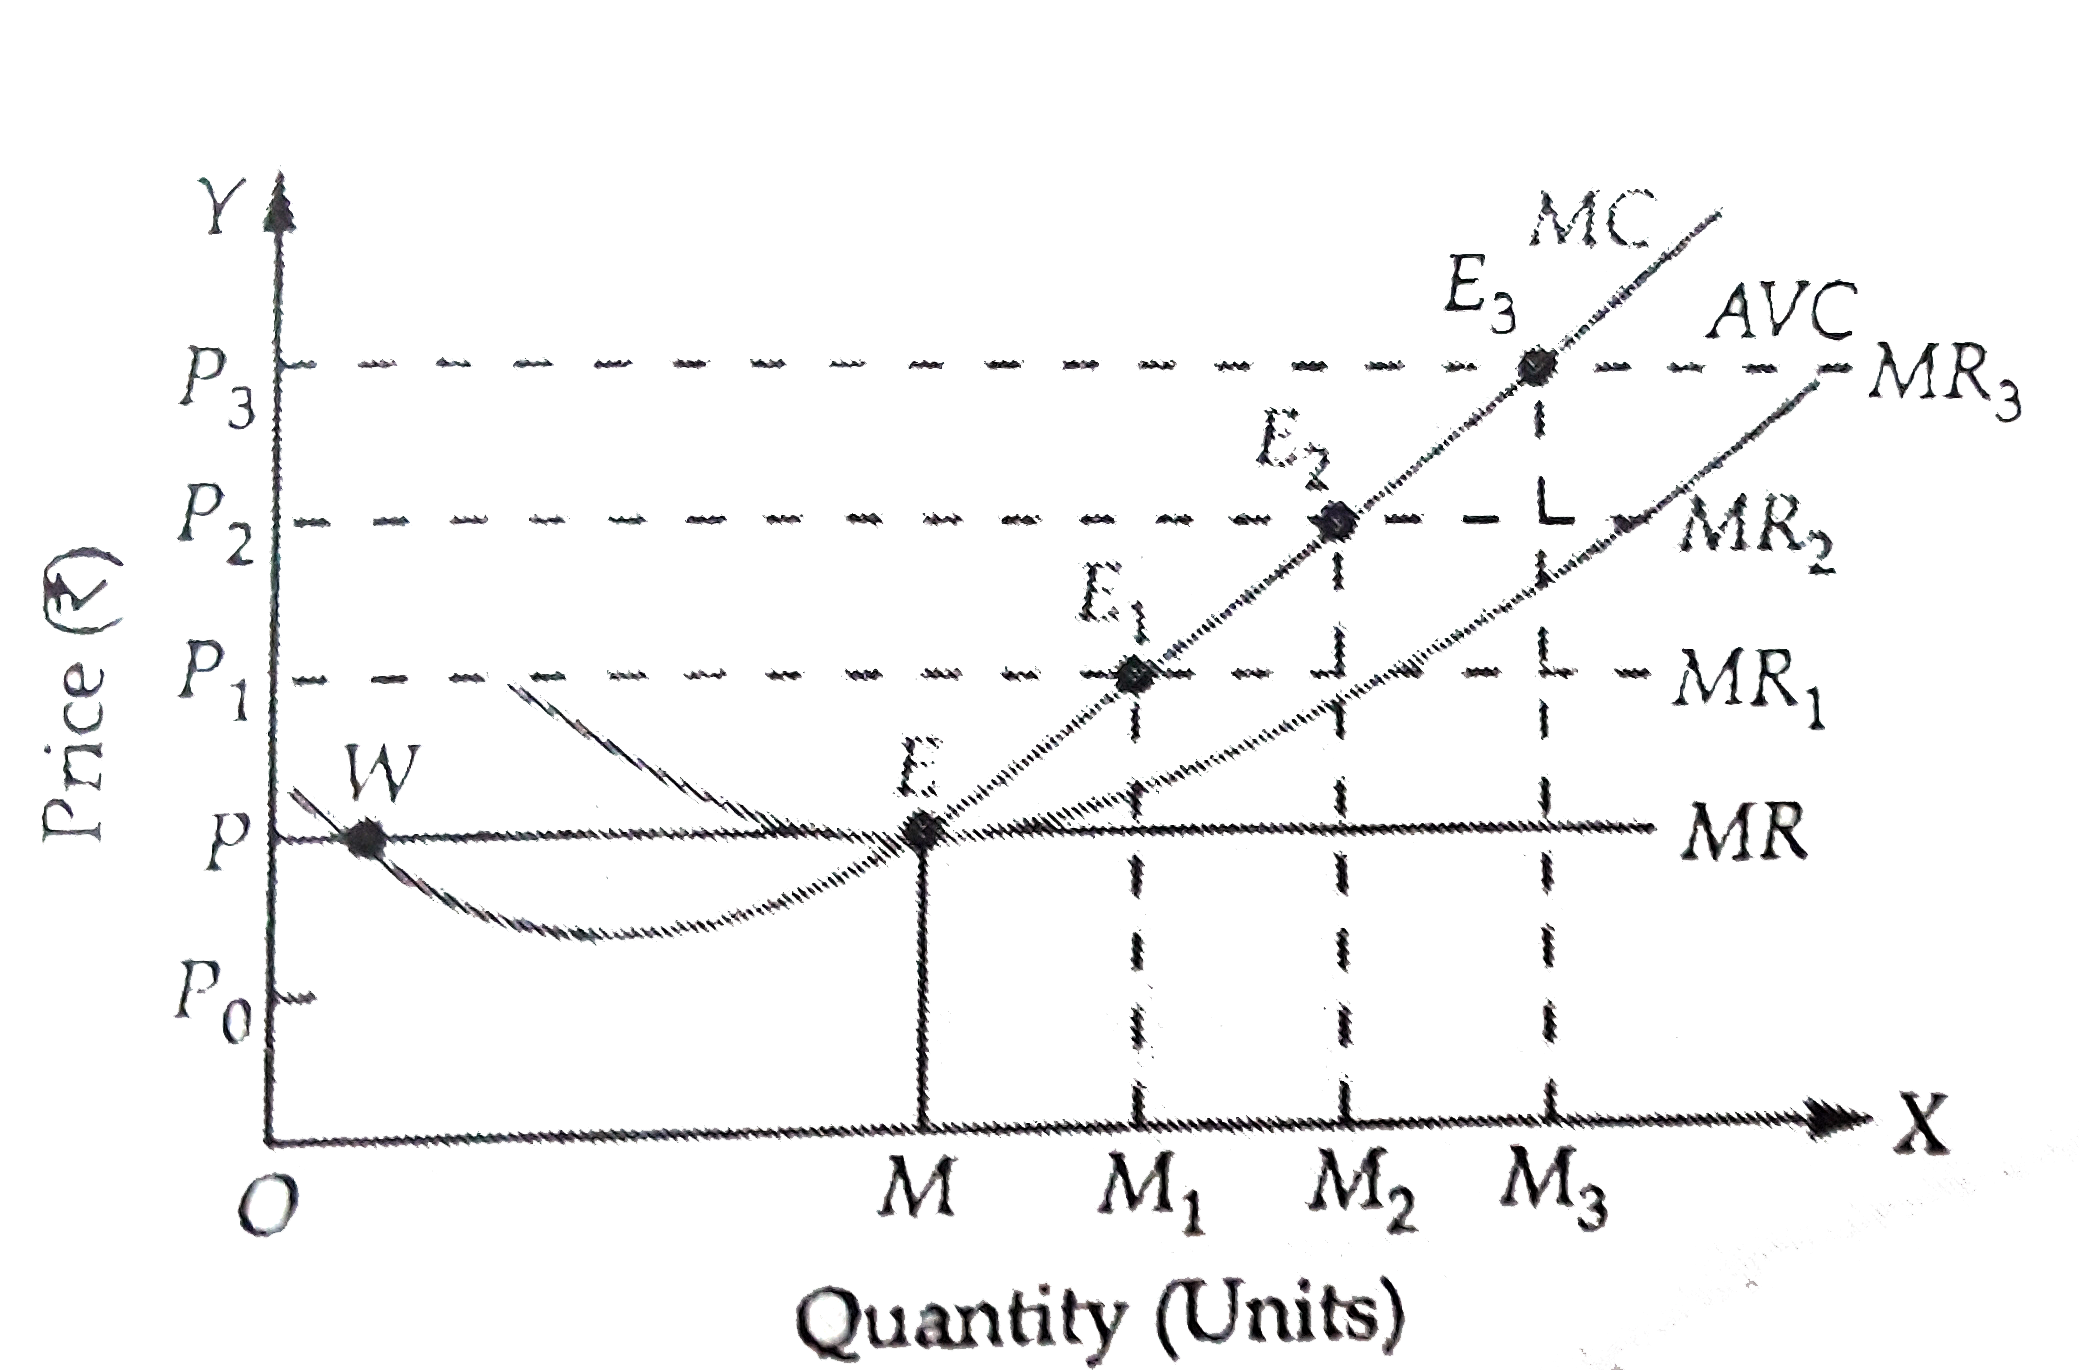
Referring to the diagram given below, a producer is in equilibrium at point E(not ar point W) as conditions of producer equilibrium are satisfied at point E(Refer to section 8.1 of chapter 8 for details). So at OP price the output produced by the producer is OM.
If price is OP1, the producer is in equilibrium at point E1 (MR=MC), therefore he supplies OM1 at price OP1. Further if the price rises to OP2, eqilibrium is at point E2 (MR=MC) and quantity supplied is OM2. At E3 quanity supplied in OM3.
For profit maximising firm the price must be greater than or equal to AVC because if
(i) Price lt AVC, a firm will not produce the firm is not able to recover its variable cost e.g., at price equal to OP0, the price charged by the price charged by the firm is less than minimum AVC (OP). Hence the firm will produce zero output.
(ii) Price = AVC represented by point E where price = AVC = OP. Hence a firm will produc OM level of output. Here the firm is just able to recover its variable cost.
(iii) Price gt AVC represented by points E1, E2 and E3 then firms increase production. At E1, the price (OP1) charged by firm is higher than its minimum AVC(OP). Hence a firm will increase production form OM to OM1 similarly at E2, Price gt AVC (OP2 gt OP) so the firm further increases production to OM2 and then to OM3.
Hence we observe that the producer produces and supplies more at higher levels of price which also satisfies law of supply indicating positive relation between price and quantity supplied. The supply curve we obtain from the above diagram would be ∃3 which shows that the firm produces that level of output where market price is greater than or equal to minimum AVC. Thus the firm's MC curve above the minimum AVC curve becomes the firm's supply curve.

Topper's Solved these Questions
- CONCEPTS OF COSTBOOK - RADHA BHUGANACHAPTER - CONCEPTS OF COSTEXERCISE - VALUE BASED QUESTIONS
3 Videos
- CONCEPTS OF COSTBOOK - RADHA BHUGANACHAPTER - CONCEPTS OF COSTEXERCISE - QUIDELINES TO NCERT QUESTION
9 Videos
- CONCEPTS OF COSTBOOK - RADHA BHUGANACHAPTER - CONCEPTS OF COSTEXERCISE - CONCEPTUAL QUESTIONS
5 Videos
- CONCEPTS OF REVENUEBOOK - RADHA BHUGANACHAPTER - CONCEPTS OF REVENUEEXERCISE - Unsolved numericals
4 Videos
Similar Questions
Knowledge Check
Area under marginal cost curve is
ATVCBTFCCAFCDAVCSupply curve of foreign exchange :
AHorizontal straight line parallel to X-axisBVerical straight line parallel to Y-axisCSlope downwardsDSlope upwards
Supply curve is the rising portion of marginal cost curve over and above the minimum of Average Variable cost curve. Do you agree? Support your answer with valid reason.
View SolutionSupply curve is the rising portion of marginal cost curve over and above the minimum of Average Variable cost curve'. Do you agree ? Support your answer with valid reason.
View SolutionSupply curve is the rising portion of marginal cost curve over and above the minimum of Average Variable cost curve. Do you agree? Support your answer with valid reason.
View SolutionDefine market supply curve.
View SolutionDraw Average Variable Cost (AVC), Average Total Cost (ATC) and Marginal Cost (MC) curves in a single diagram. State the relation between MC curve and AVC and ATC curves.
View SolutionWhy is short run marginal cost curve 'U'-shaped?
View Solution
