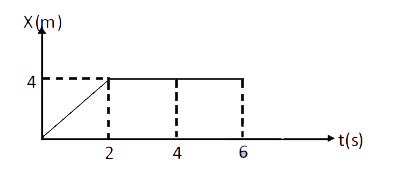
v-t graph of an object of mass 1 kg is shown.Select the wrong statement-

Work done on the object in 30 s is zero
The average acceleration of the object is zero
The average velocity of the object is zero
The average force on the object is zero
The correct Answer is:C
(c ) Average velocity =Total displacementTime
=Area under v-t graphTime
Since area ≠0
∴Average velocity≠0
Topper's Solved these Questions
- WORK, ENERGY AND POWERBOOK - DC PANDEYCHAPTER - WORK, ENERGY AND POWEREXERCISE - MEDICAL ENTRANCE SPECIAL QUESTIONS
16 Videos
- WORK, ENERGY AND POWERBOOK - DC PANDEYCHAPTER - WORK, ENERGY AND POWEREXERCISE - MATCH THE COLUMNS
7 Videos
- WORK, ENERGY AND POWERBOOK - DC PANDEYCHAPTER - WORK, ENERGY AND POWEREXERCISE - CHECK POINT 6.3
10 Videos
- WORK, ENERGY & POWERBOOK - DC PANDEYCHAPTER - WORK, ENERGY & POWEREXERCISE - Level 2 Comprehension Based
2 Videos
- WORK, POWER AND ENERGYBOOK - DC PANDEYCHAPTER - WORK, POWER AND ENERGYEXERCISE - E Integer Type Questions
11 Videos
Similar Questions
Knowledge Check
Select wrong statement.
AThe viroids were discovered by DJ IvanowskyBWM Stanley showed that viruses could be crystallisedCThe term 'contagium vivum fluldum' was coined by MW BeijerinckDMosaic disease in tobacco and AIDS in human belong are caused by virusesVelocity time graph of an object of mass 2kg is shown in figure. The force required to move the object for first four seconds is
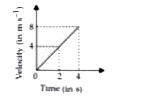 A0NB4NC2ND8N
Displacement time graph of an object of mass 2kg is shown in figure. The force required to move the object for first four seconds is
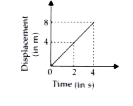 A0B4NC2ND8N
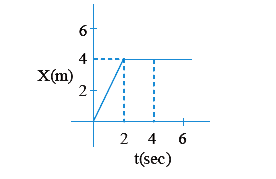
In the figure, the position time graph of a particle of mass 0.1 kg is shown. The impulse at t=2 second is :
View Solution
The distance-time graph for an object is shown above. Which one of the following statements holds true for this object?
View SolutionIn the figure given, the position-time graph of a particle of mass 0.1 kg is shown the impulse at t = 2s is
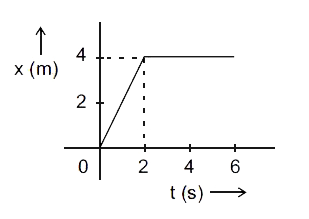
View SolutionIn the figure given below, the position–time graph of a particle of mass 0·1 kg is shown. The impulse at t=2sec is
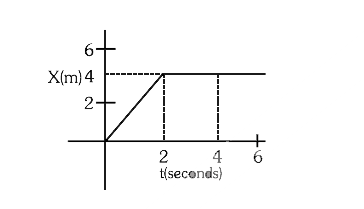
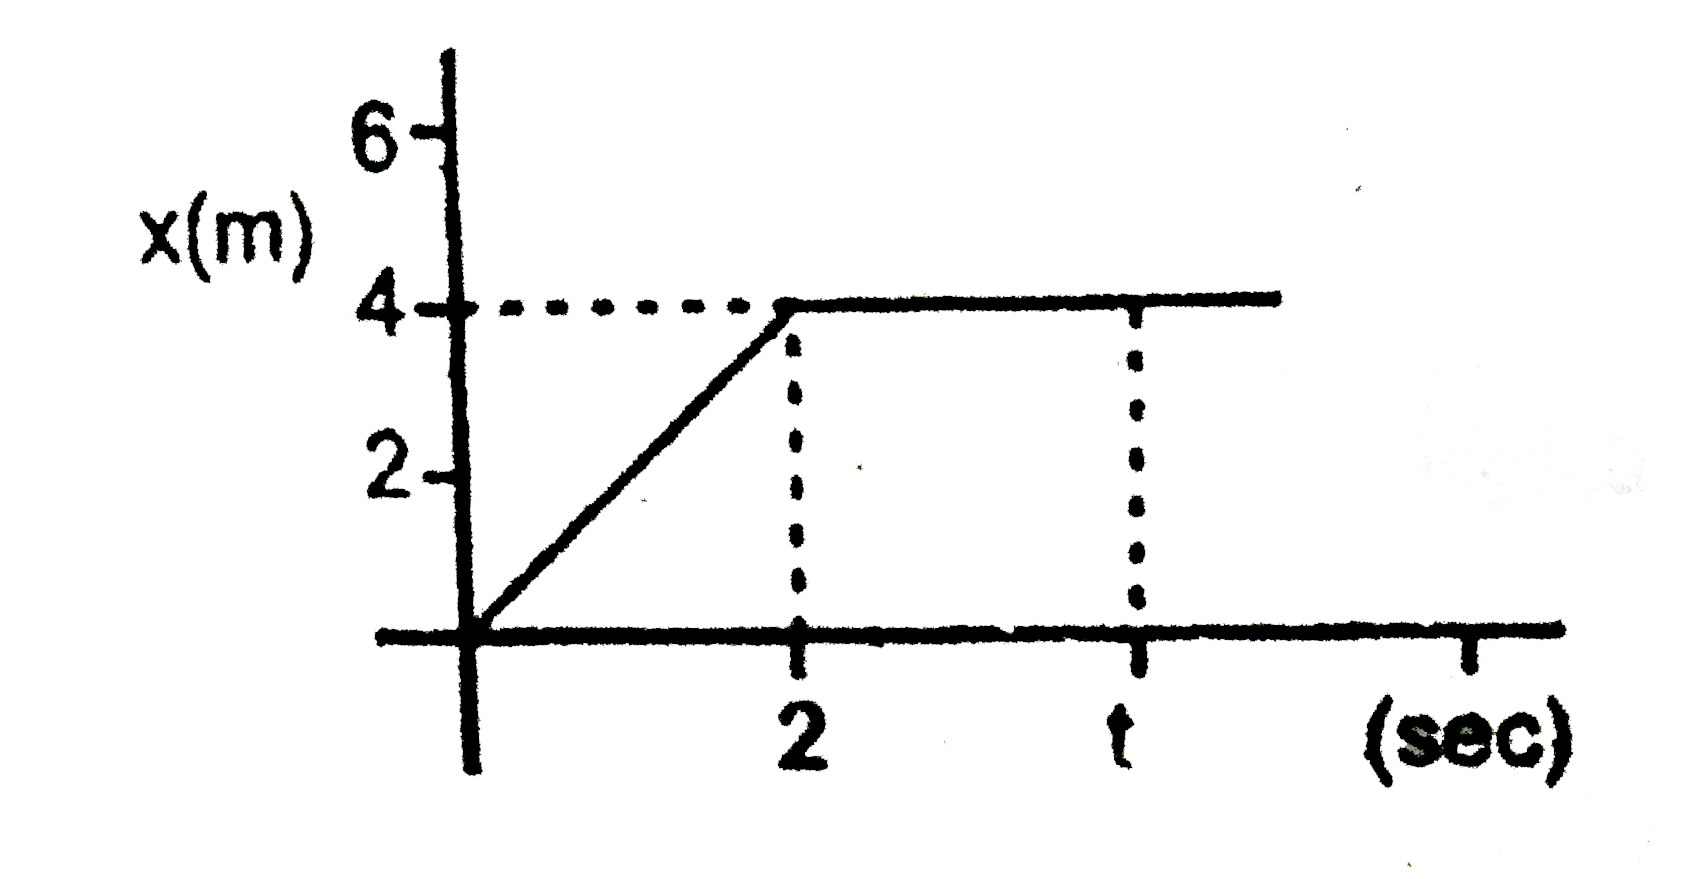
View SolutionIn the figure given below, the position time graph of a particle of mass 0.1kg is shown. The impulse at t=2 sec is
View Solution

