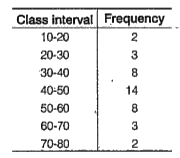
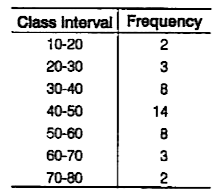
The following table gives distribution of marks for 50 students of a clas. Calculate mean deviation from the mean and median respectively from the data:

The correct Answer is:MD¯¯¯X=10.56, MDm=10.24
Step by step video, text & image solution for The following table gives distribution of marks for 50 students of a clas. Calculate mean deviation from the mean and median respectively from the data: by Economics experts to help you in doubts & scoring excellent marks in Class 11 exams.
Topper's Solved these Questions
- BOOK - TARUN JAIN & VK OHRICHAPTER - MEASURES OF DISPERSIONEXERCISE - NCERT Questions (With Hints to Answers)11videos
MEASURES OF DISPERSION
- BOOK - TARUN JAIN & VK OHRICHAPTER - MEASURES OF CENTRAL TENDENCY MEDIAN AND MODEEXERCISE - NCERT Questions (With Hints to Answers)5videos
MEASURES OF CENTRAL TENDENCY MEDIAN AND MODE
- BOOK - TARUN JAIN & VK OHRICHAPTER - ORGANISATION OF DATAEXERCISE - EXERCISE NCERT13videos
ORGANISATION OF DATA
Similar Questions
Knowledge Check
- Question 1 - Select One
The mean deviation from the mean for the following data is
 A5B10C15D20
 - Question 2 - Select One
The mean deviation from the mean for the following data is
 A5B10C15D20
Find out the mean deviation from the median and its coefficient from the following data:
 View Solution
Calulate the mean deviation from the median of the following data
 View Solution
Calculate the mean deviation from the median of the following data:
 View Solution
Nine students of a class obtained following marks. Calculate mean deviation from median.
 View Solution
Calculate mean deviation and its coefficient from median from the following data:
 View Solution
Calculate mean deviation and its coefficient from mean from the following data:
 View Solution


