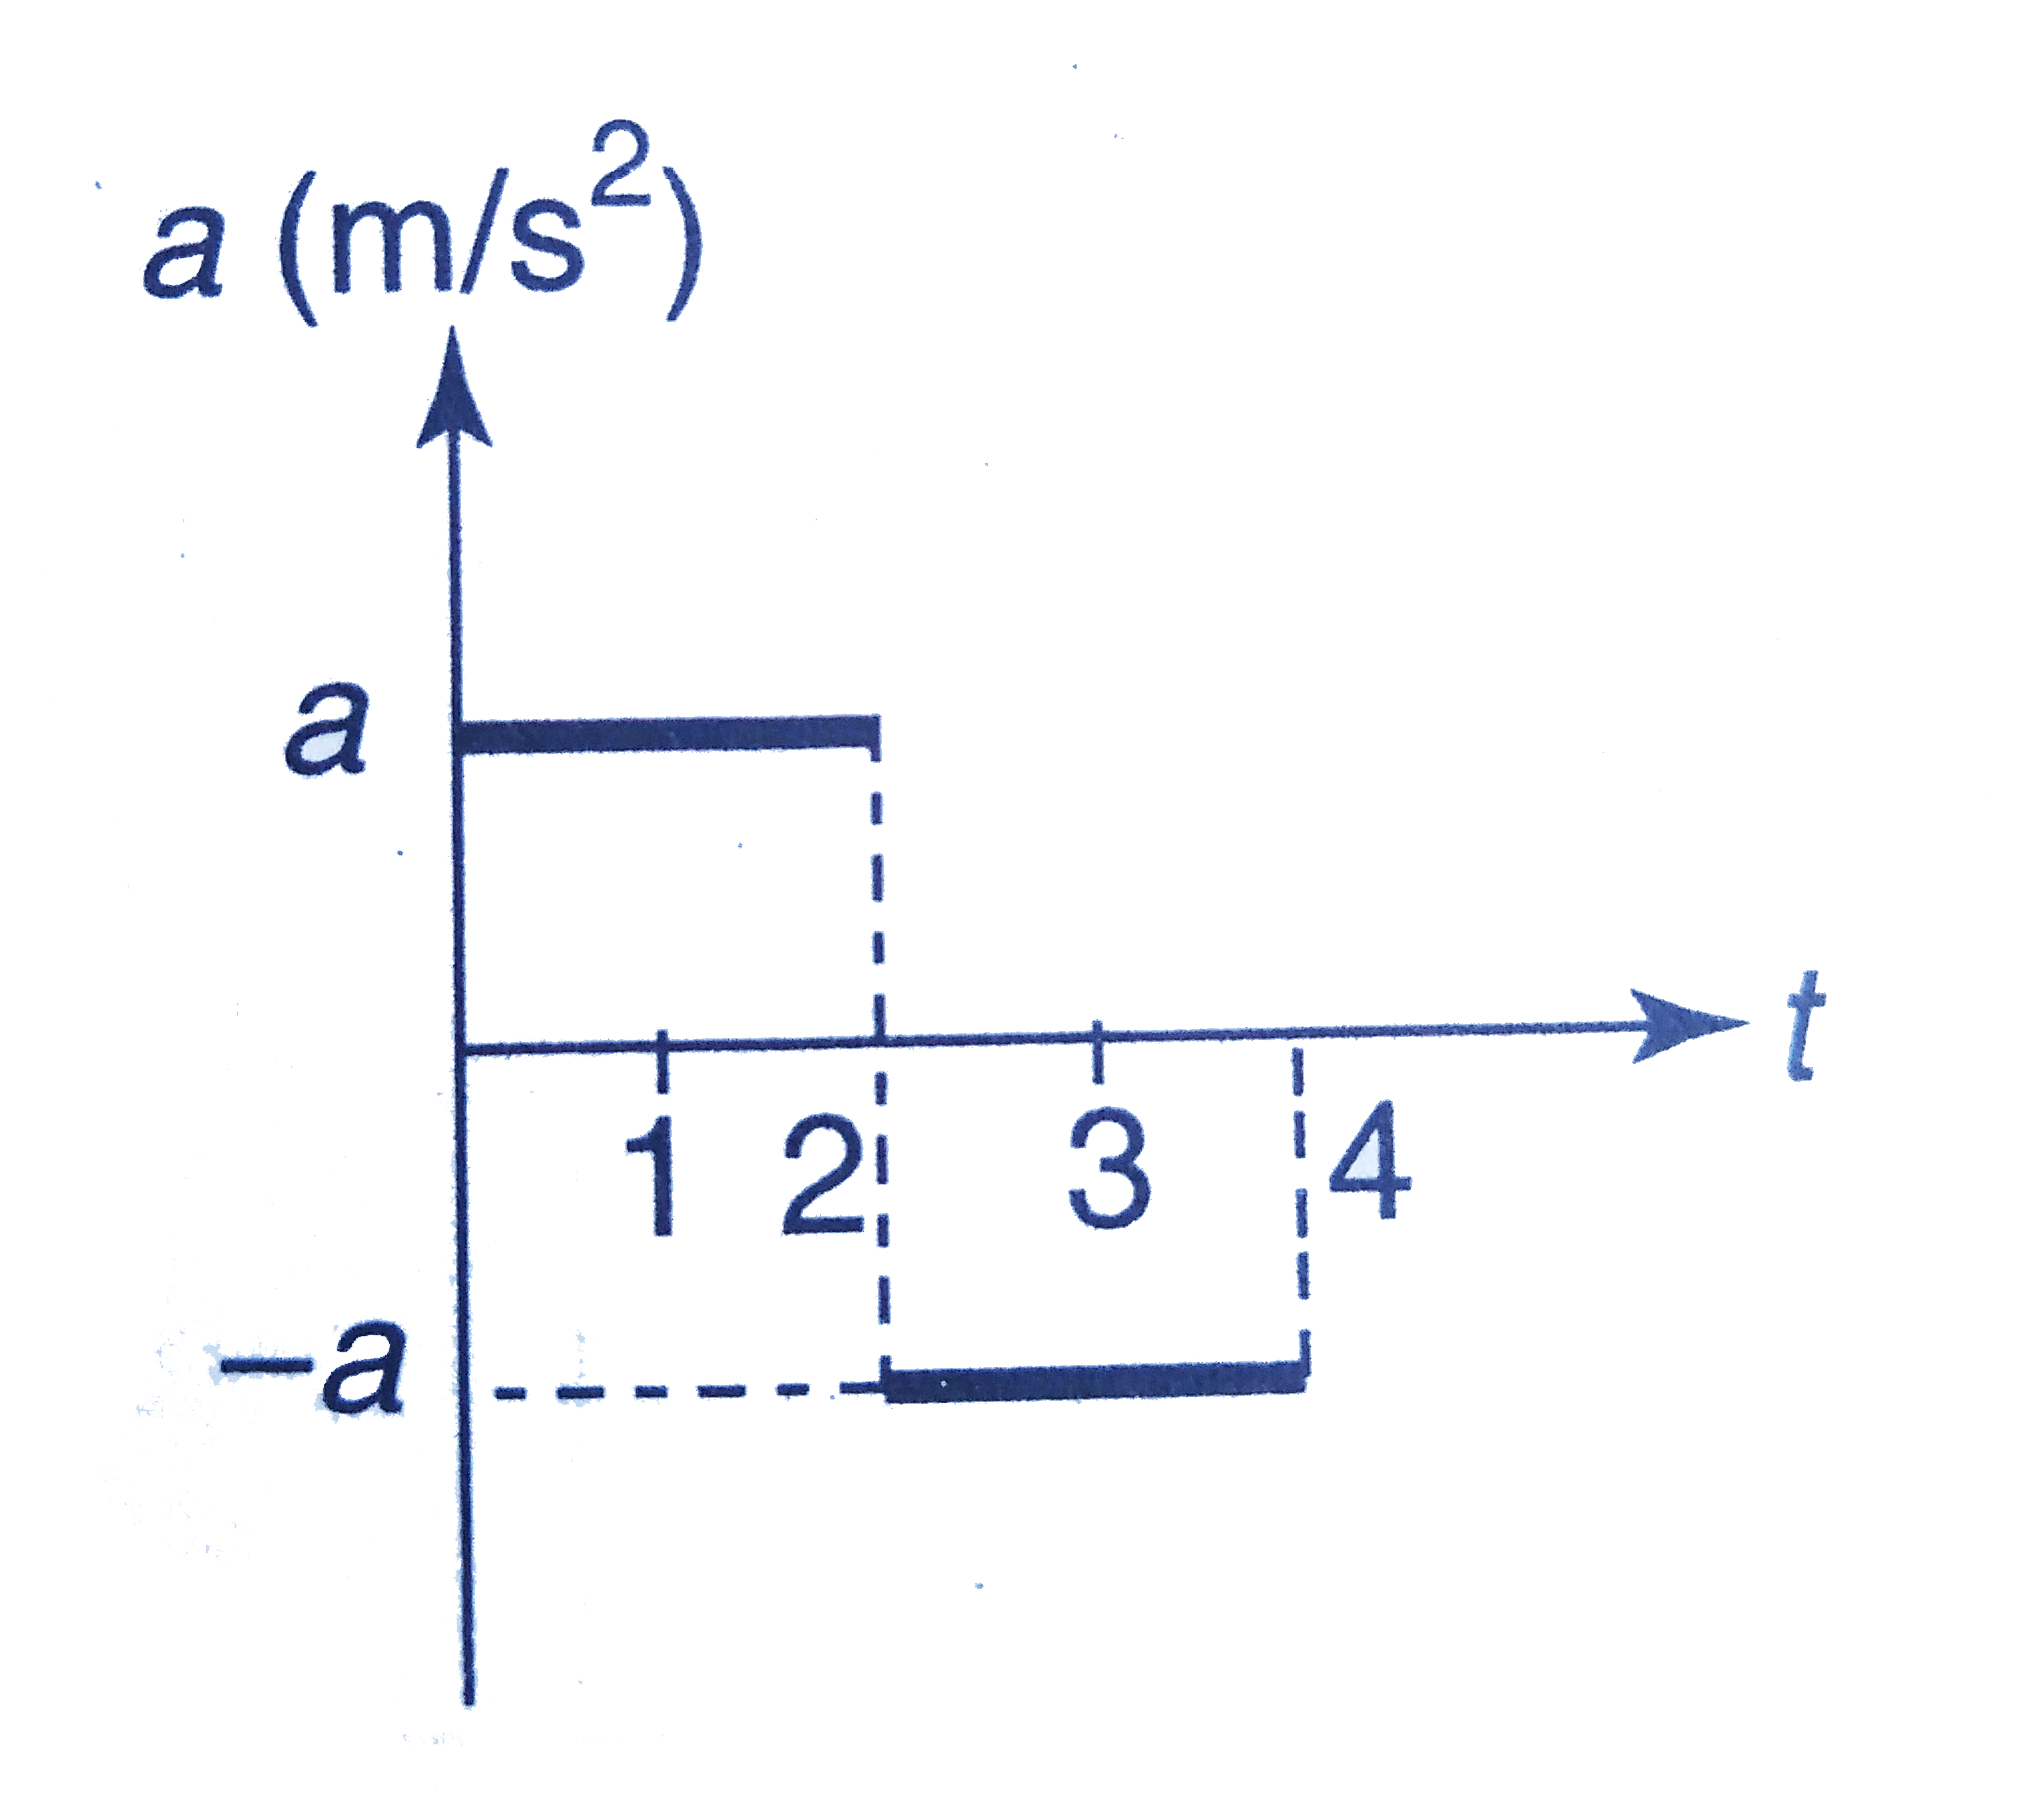
A particle starts from rest at t=0 and undergoes an acceleration as shown in figure.
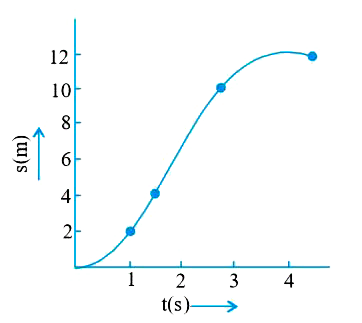
Draw the displacement-time graph of the motion of the particle during the same time interval. In both the above cases, explain the various steps.
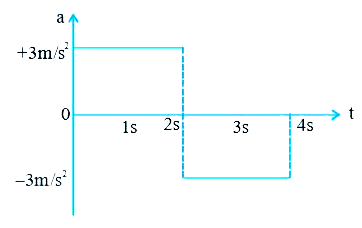
The displacement of the particle in time interval t = 0 to t = 2 is given by
s=ut+12 at2=0+12×3×t232t2
Therefore, the displacement at t = 0, t = 1 s and t = 2 s respectively are 0, 1.5 m and 6 m. In the time interval from t = 2s to t = 4 or t . = 0 or t . = 2s ( t . = t – 2), the displacement is given by
s.=ut.+12a(t.)2=6t.12×3×t2=6t−1.5t2
(Hence for this time interval u=6m/sanda=–3m/s2). The displacement at t . = 1s and t . = 2 i.e., t = 3s and t = 4s are, therefore, (6 –1.5) = 4.5 m and (12 – 6) = 6 m respectively more than the displacement at t = 2s which is 6 m . Hence the displacement at t = 3s and t = 4s are (4.5 + 6) = 10.5 cm and (6 + 6) = 12 m respectively.
These results are tabulated below:
Time (s) 0 1 2 3 4
Displacement (m/s) 0 1.5 6 10.5 12
Figure shows the displacement-time graph of the motion
Similar Questions
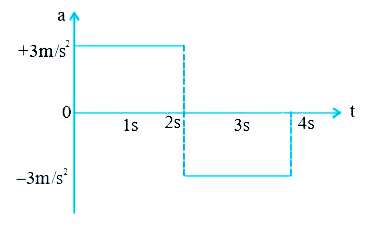
A particle starts from rest at t=0 and undergoes an acceleration as shown in figure.
Draw the velocity-time graph of the motion of the particle during the interval from zero to 4 second.
 View Solution
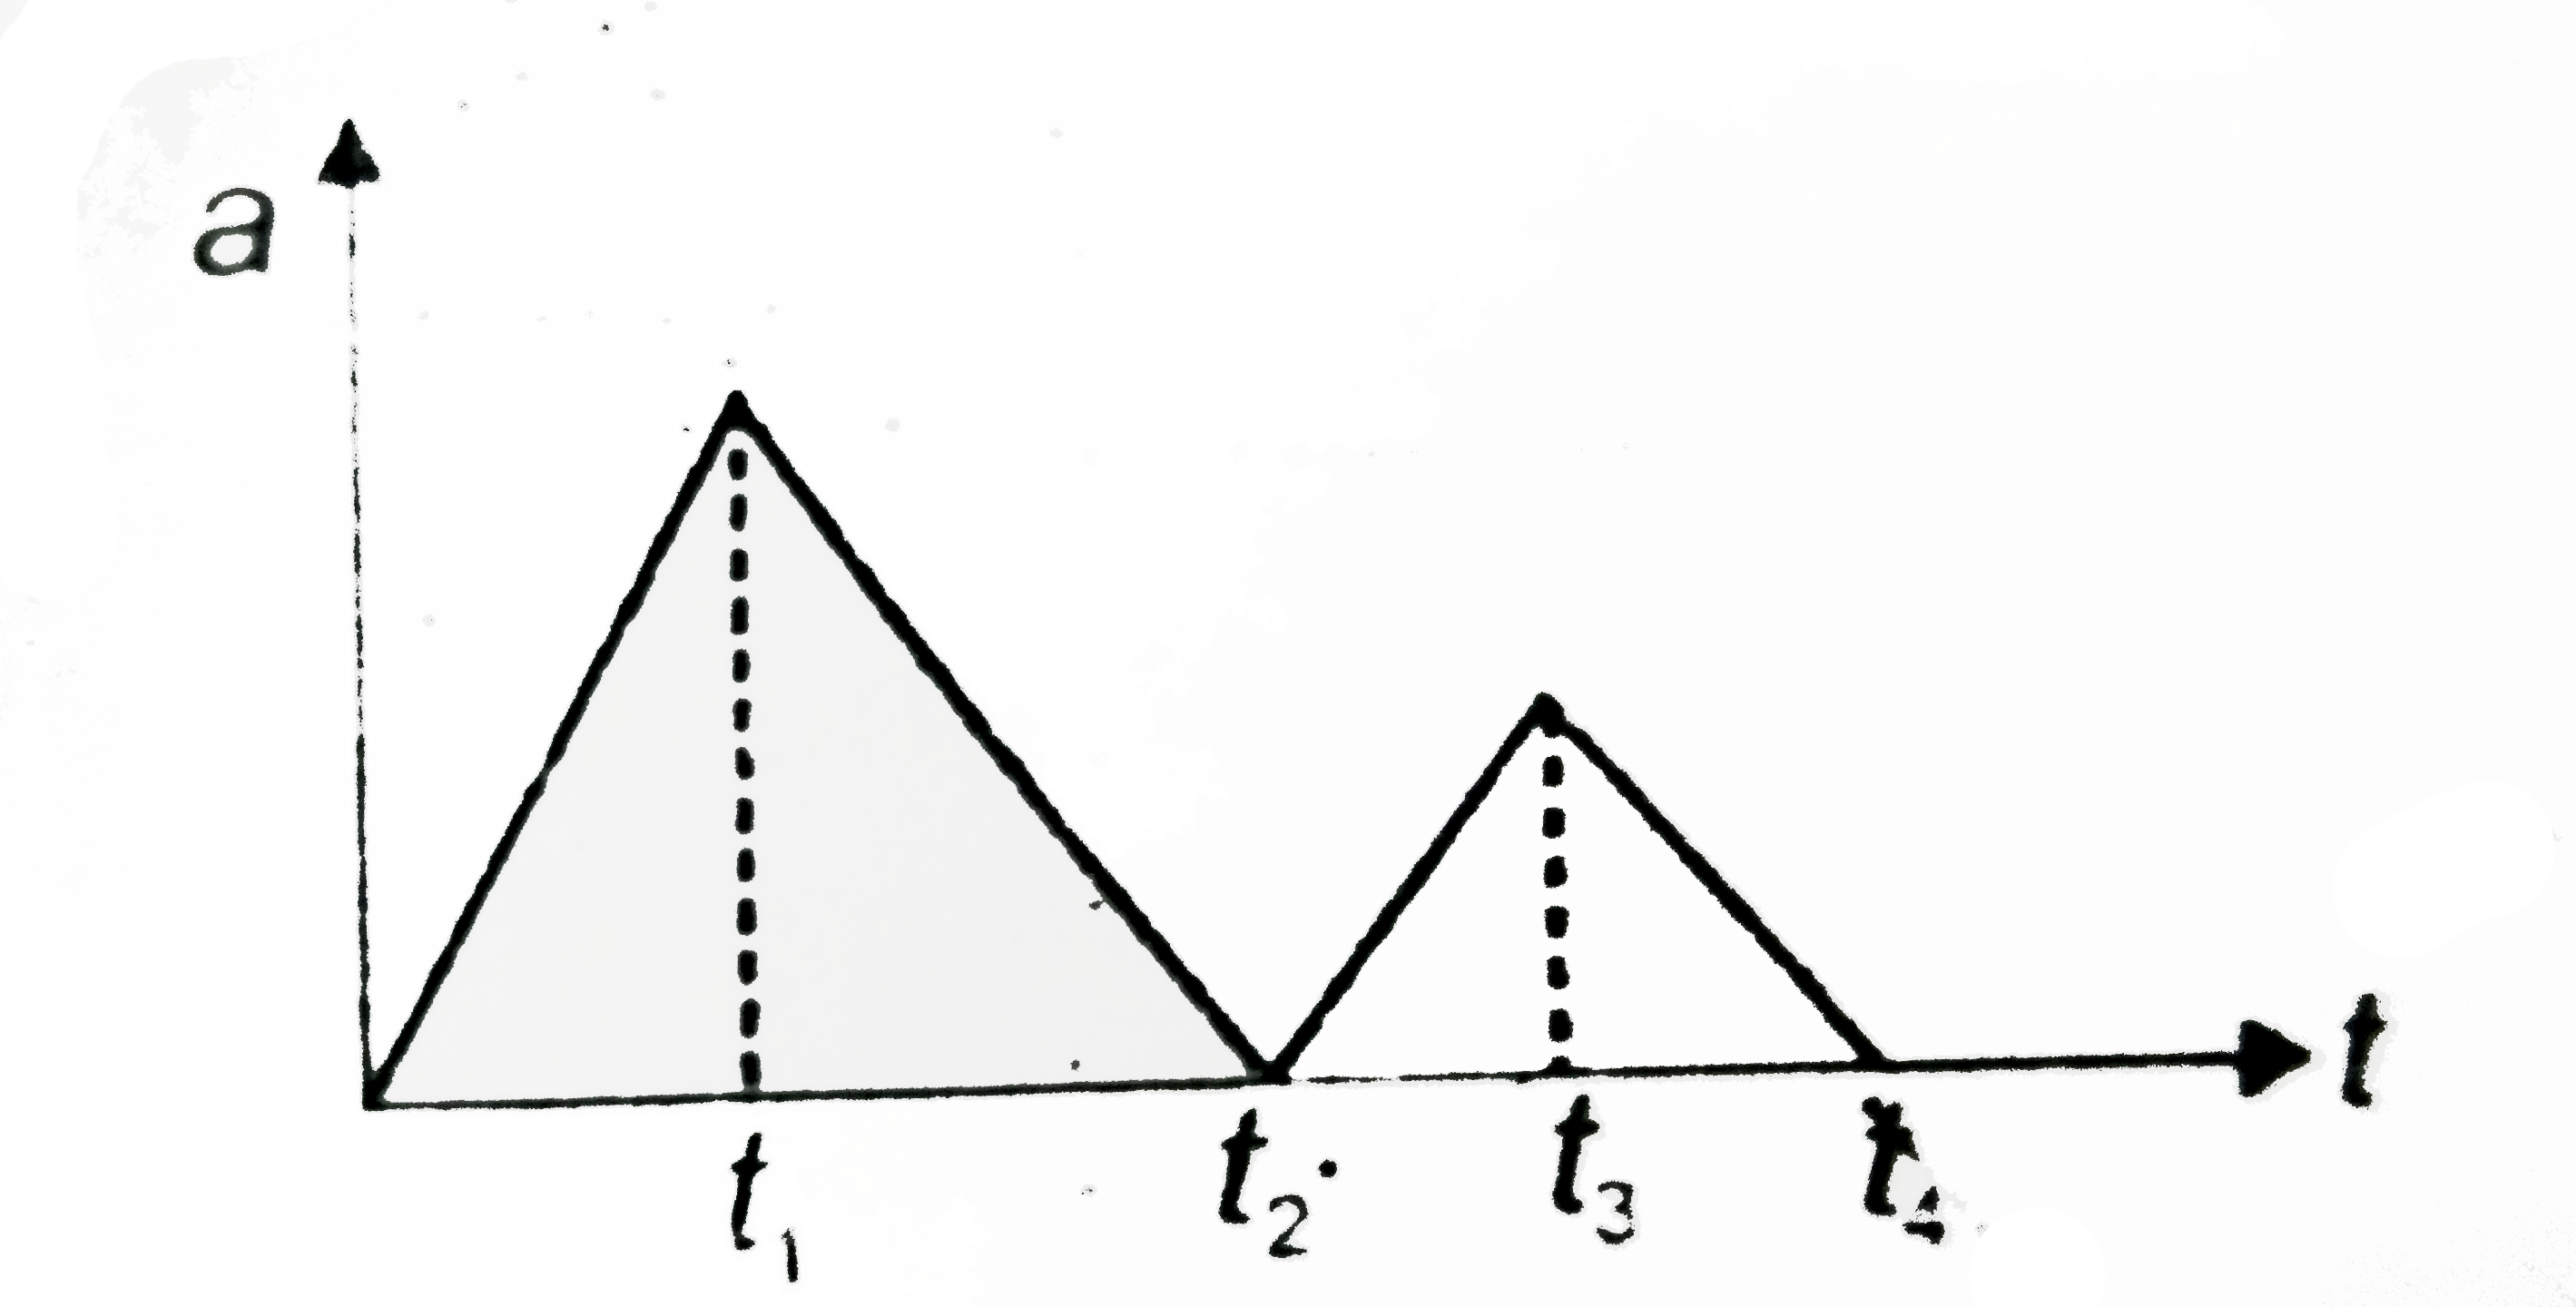
A particle starts moving from rest on a straight line. Its acceleration a verses time t is shown in the figure. The speed of the particle is maximum at the instant
 View Solution
Knowledge Check
- Question 1 - Select One
A particle starts from rest and undergoes an acceleration as shown in figure. The velocity-time graph from figure will have a shape.
 A
A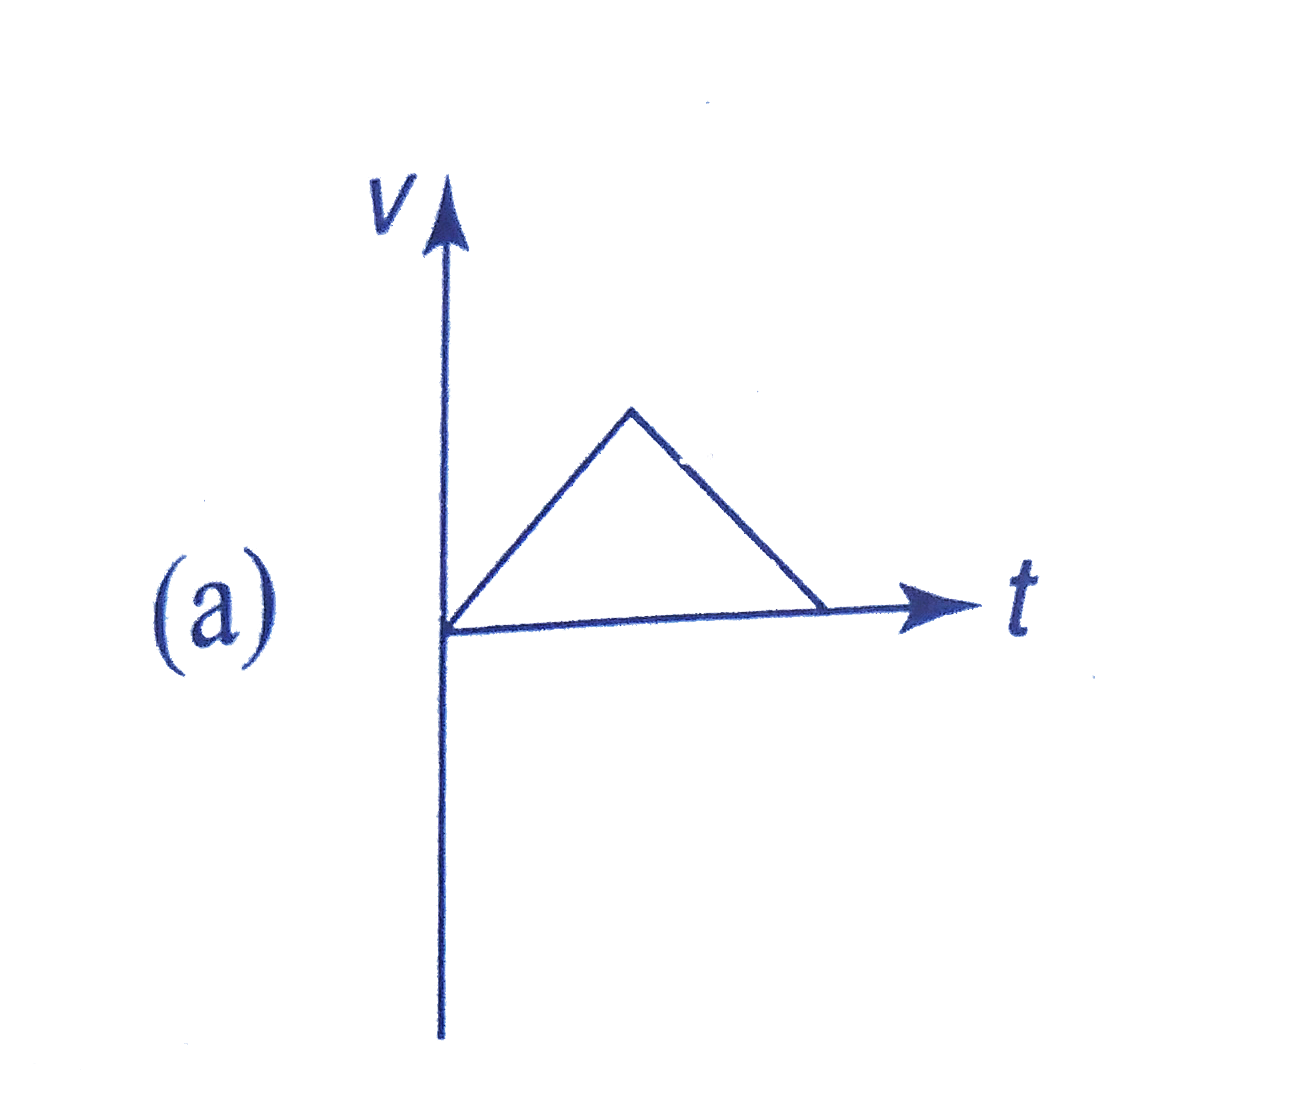 .B
.B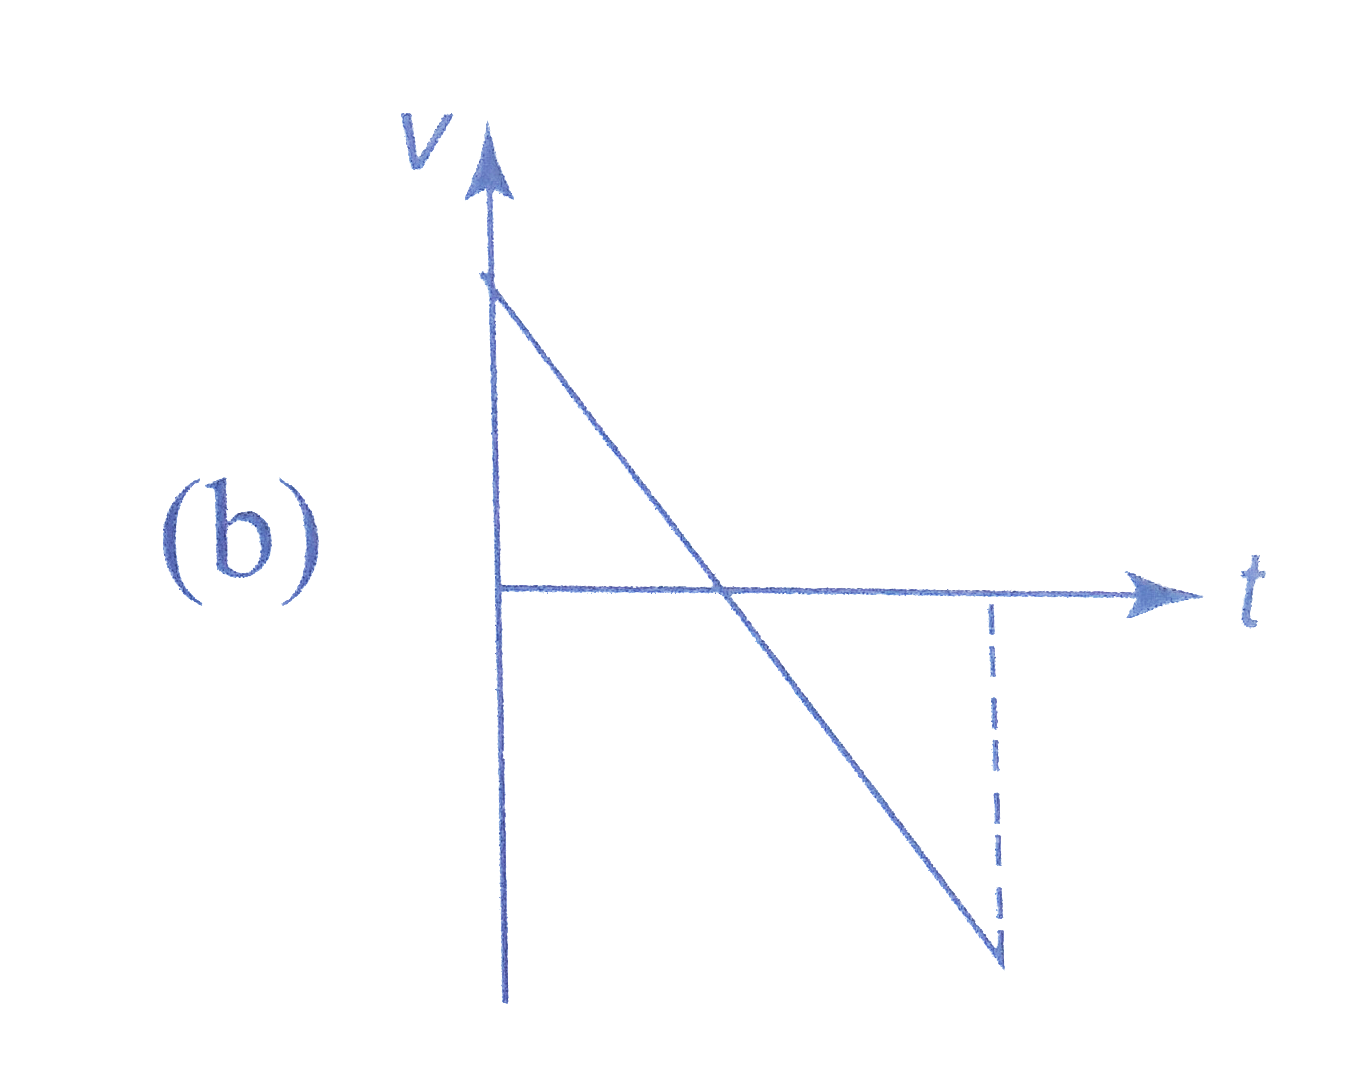 .C
.C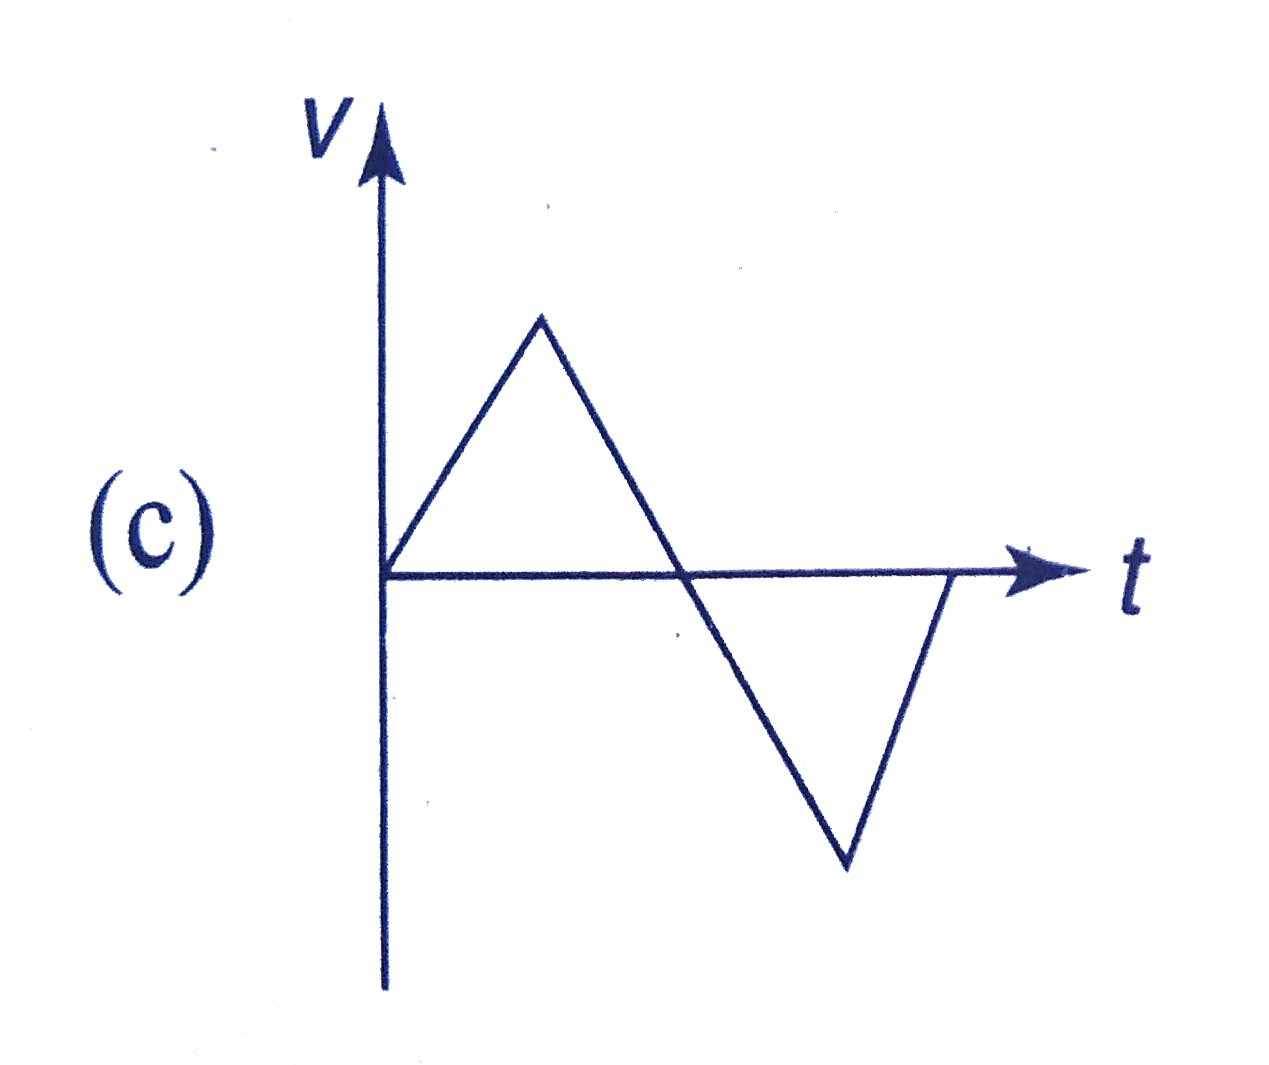 .D
.D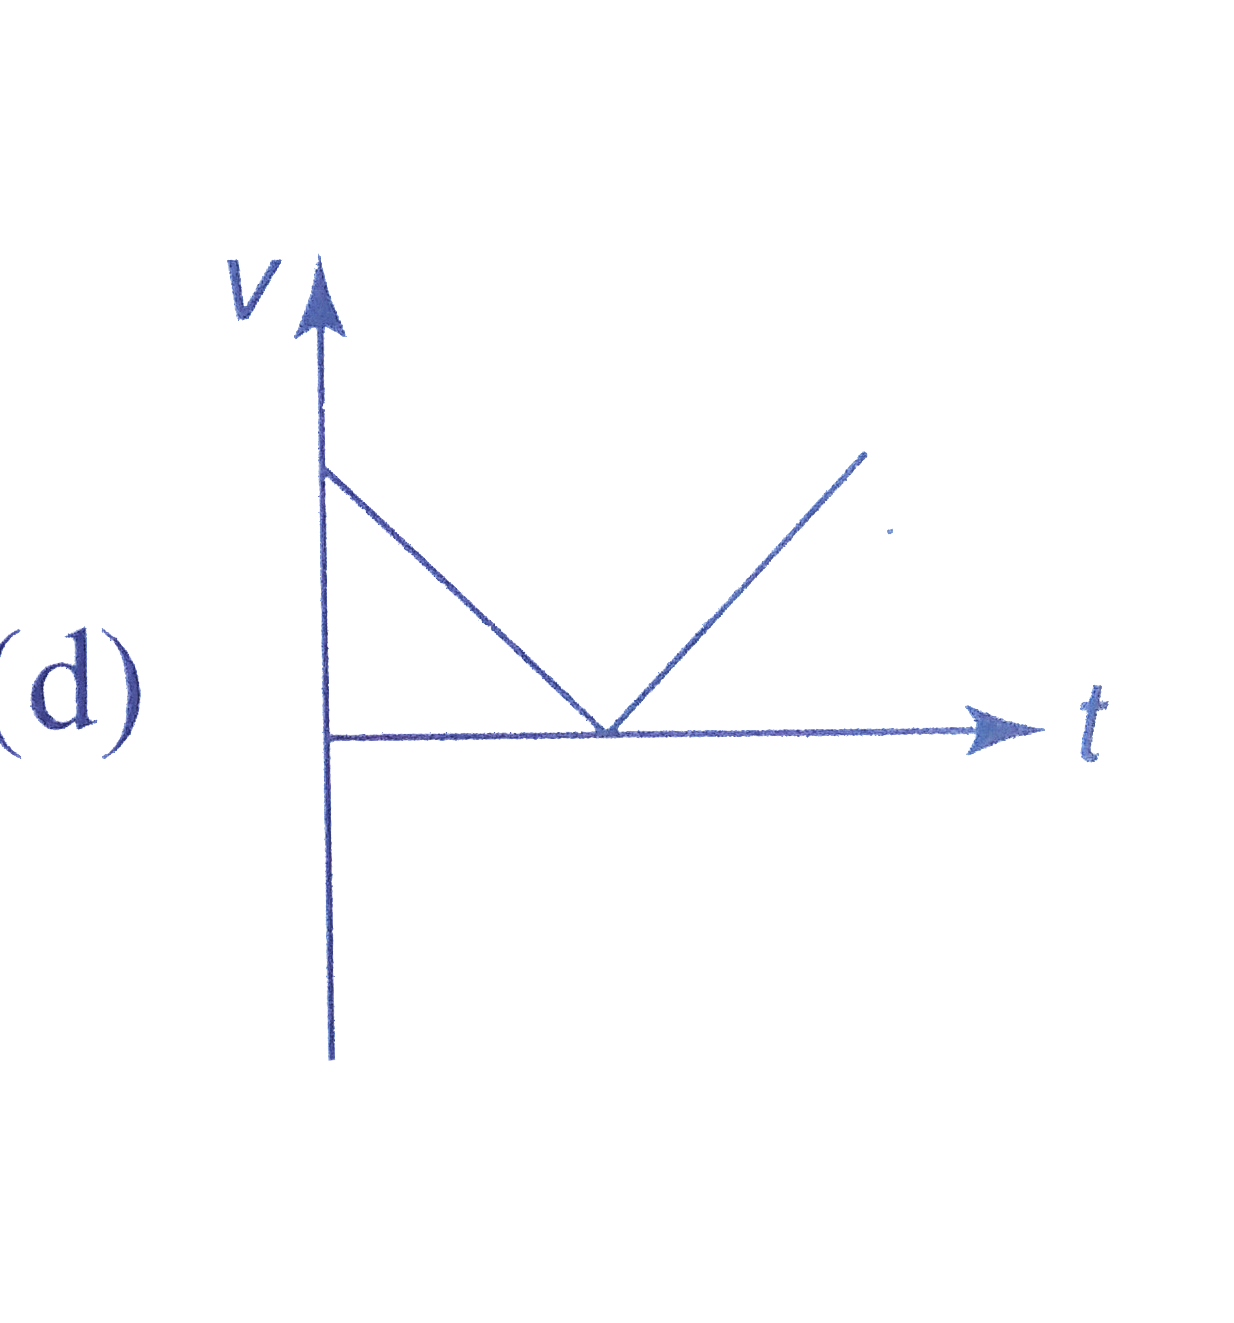 .
. - Question 2 - Select One
A particle starts from rest and moves with acceleration a which varies with time t as a=kt where k is a costant. The displacement s of the particle at time t is
A12kt2B12at2C16at2DNone - Question 3 - Select One
A particle starts from rest with a time varying acceleration a=(2t−4). Here t is in second and a in m/s2
The velocity time graph of the particle isAparabola passing through originBstraight line not passing through originCparabola not passing through originDstraight line passing through origin
The velocity time graph for a particle is shown in figure. Draw acceleration time graph from it.
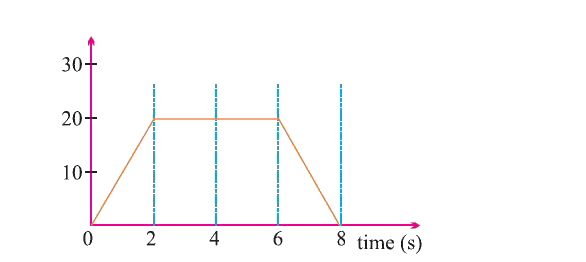 View Solution
A particle starts from rest. Its acceleration is varying with time as shown in the figure. When the particle comes to rest, its distance from its starting point is
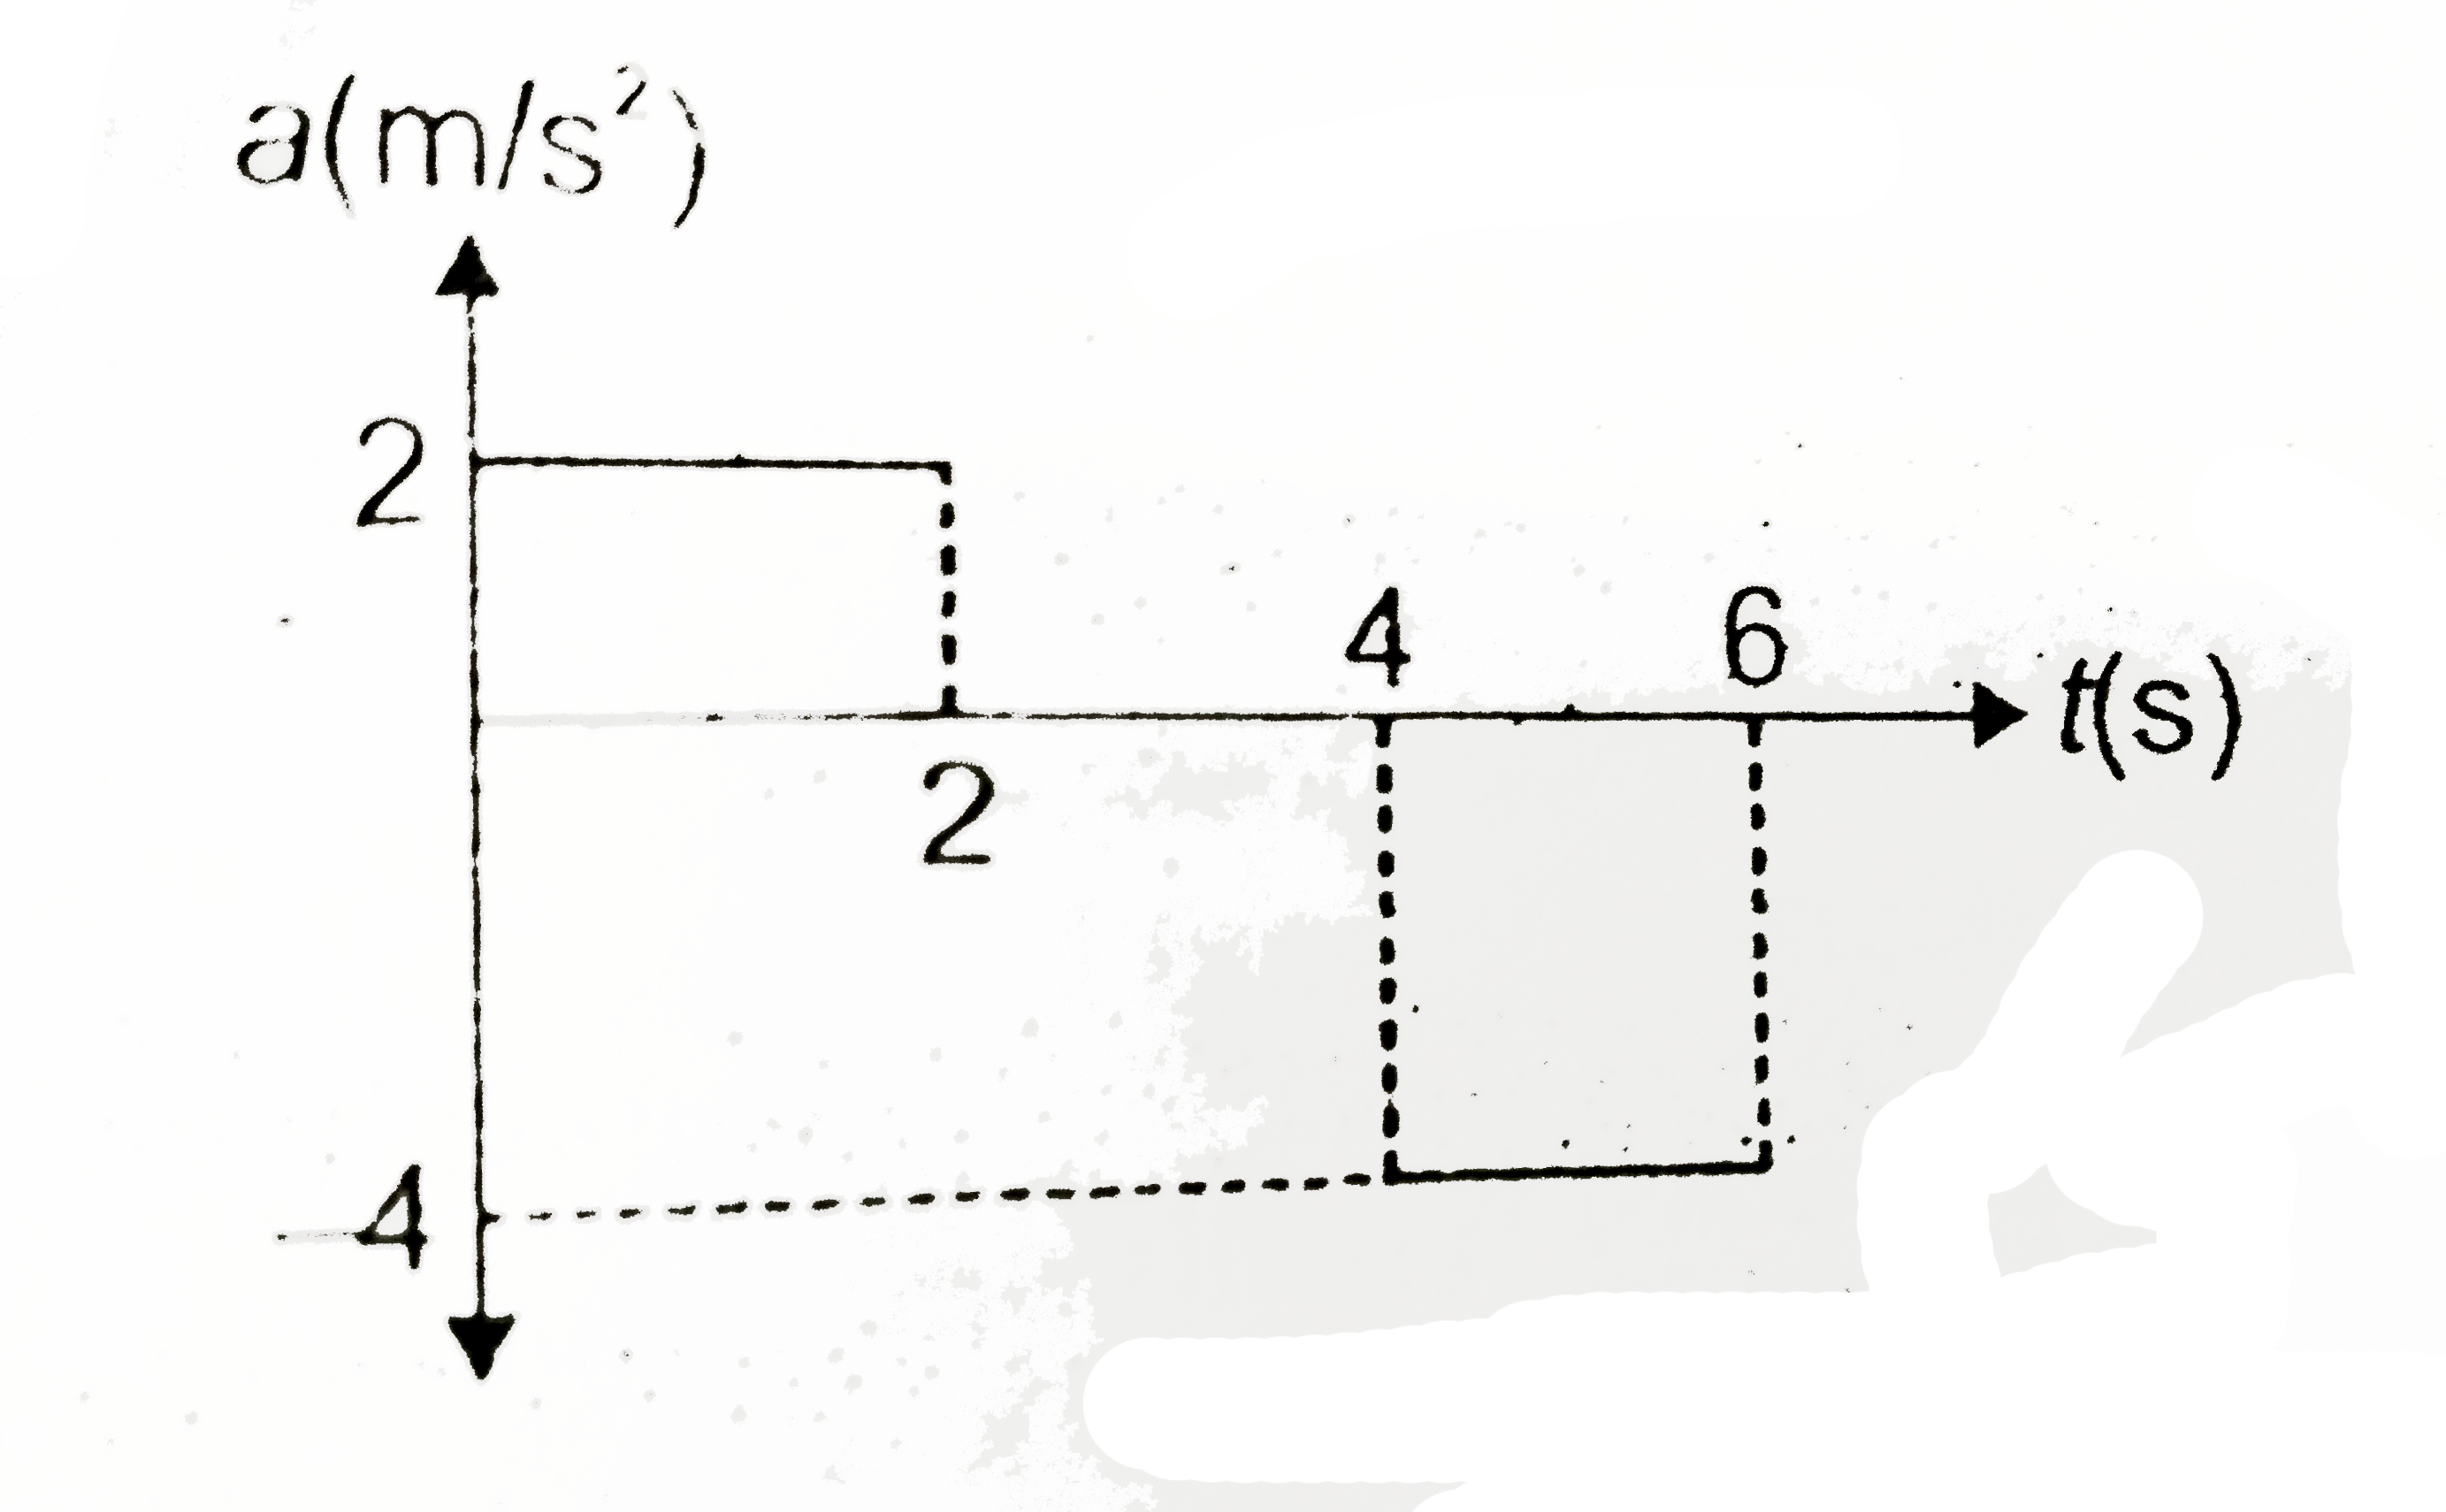 View Solution
A particle of mass M starting from rest undergoes uniform acceleration. If the speed acquired in time T is V, the power delivered to the particle is -
View SolutionA particle of mass M, starting from rest, undergoes uniform acceleration. If the speed acquired in time T is V, the power delivered to the particle is
View SolutionA particle starting from rest. Its acceleration (a) versus time (t) is as shown in the figure.
The maximum speed of the particle will be.
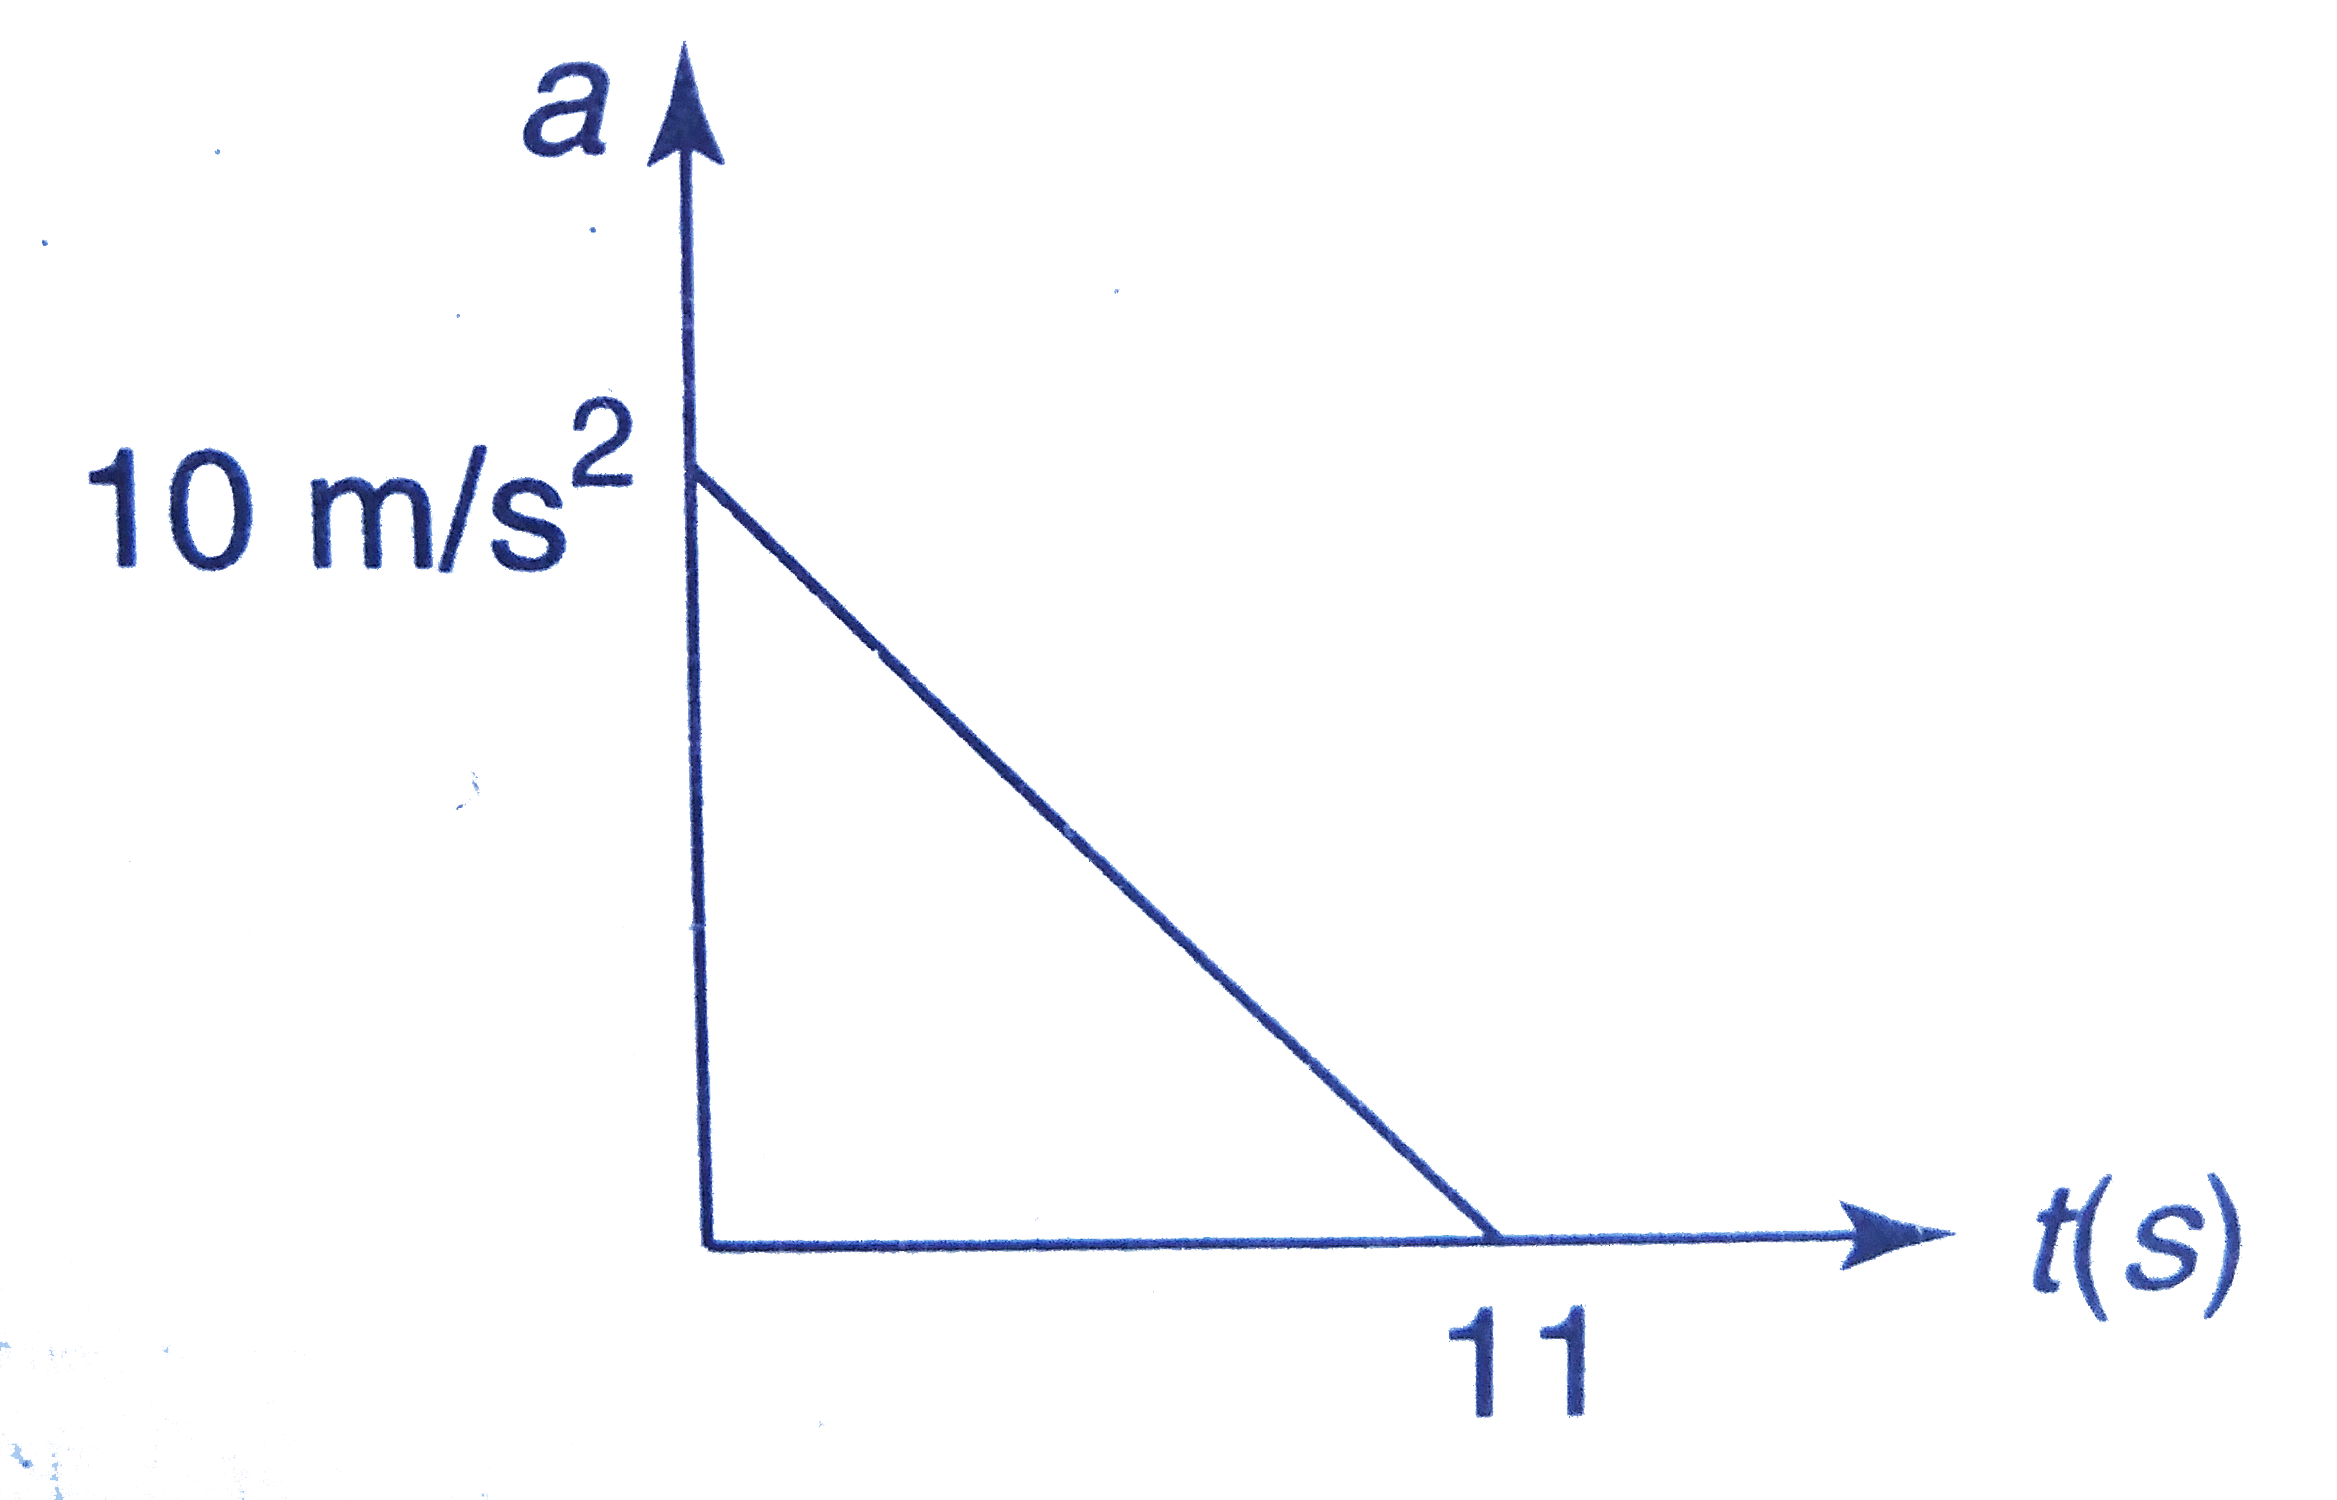 View Solution

