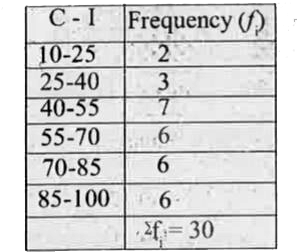
Calculate the mode for the following frequency distribution table
 Solution in Kannada
Step by step video & image solution for Calculate the mode for the following frequency distribution table by Maths experts to help you in doubts & scoring excellent marks in Class 10 exams.
Updated on:21/07/2023Topper's Solved these Questions
- PRACTICE QUESTION PAPER 13BOOK - CPC CAMBRIDGE PUBLICATIONCHAPTER - PRACTICE QUESTION PAPER 13EXERCISE - ANSWER THE FOLLOWING QUESTIONS
34 Videos
- PRACTICE QUESTION PAPER 12BOOK - CPC CAMBRIDGE PUBLICATIONCHAPTER - PRACTICE QUESTION PAPER 12EXERCISE - ANSWER THE FOLLOWING QUESTION
32 Videos
- PROBABILITYBOOK - CPC CAMBRIDGE PUBLICATIONCHAPTER - PROBABILITYEXERCISE - EXERCISE 14. 2 (OPTIONAL)
5 Videos
Similar Questions
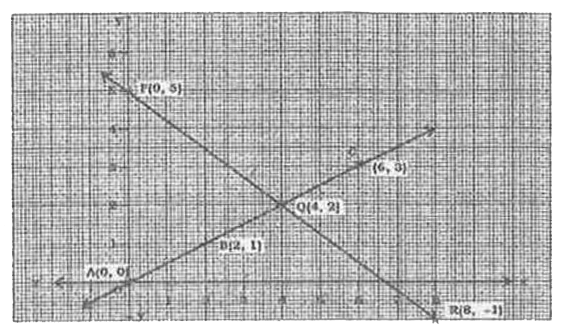
The given graph represents a pair of linear equations in two variables : write how many solutions these pair of equations have

View SolutionIf the product of zeroes of polynomial f(y) =ay3−6y2+11y−6 is 4 then find the value of 'a'.
View SolutionTwo customers shyam and Ekta are visiting a particular shop in the same week (Tuesday to Saturday) . Each is equally likely to visit the shop on any day as on another day. What is the probability that both will visit the shop on (i) the same day ? (ii) consecutive day ? (iii) different days ?
View SolutionMatch the following lists:

View SolutionHow many lines of symmetry does the above figure have ?
View SolutionWhich of the following are correct chain isomers of butane ? (i)
View SolutionDetermine the point of symmetry of a regular hexagon.
View SolutionDtermine the images of the following figure about the given line :
View SolutionMatch the following Column A to Column B

View SolutionMatch the following Column A to Column B

View SolutionMatch the following Column A to Column B

View SolutionCalculate the volume of the given solid.
ltimg src="https://d10lpgp6xz60nq.cloudfront.net/physics_images/PS_MATH_VII_C06_E03_002_Q01.png" width="80%"gt
View SolutionThe inequation represented by the graph given below is :
View SolutionThe inequation that best describes the graph given below is _________
View SolutionThe inequation that best describes the following graph is _________
View SolutionWhich inequations represent the shaded region in the given figure
View Solution
