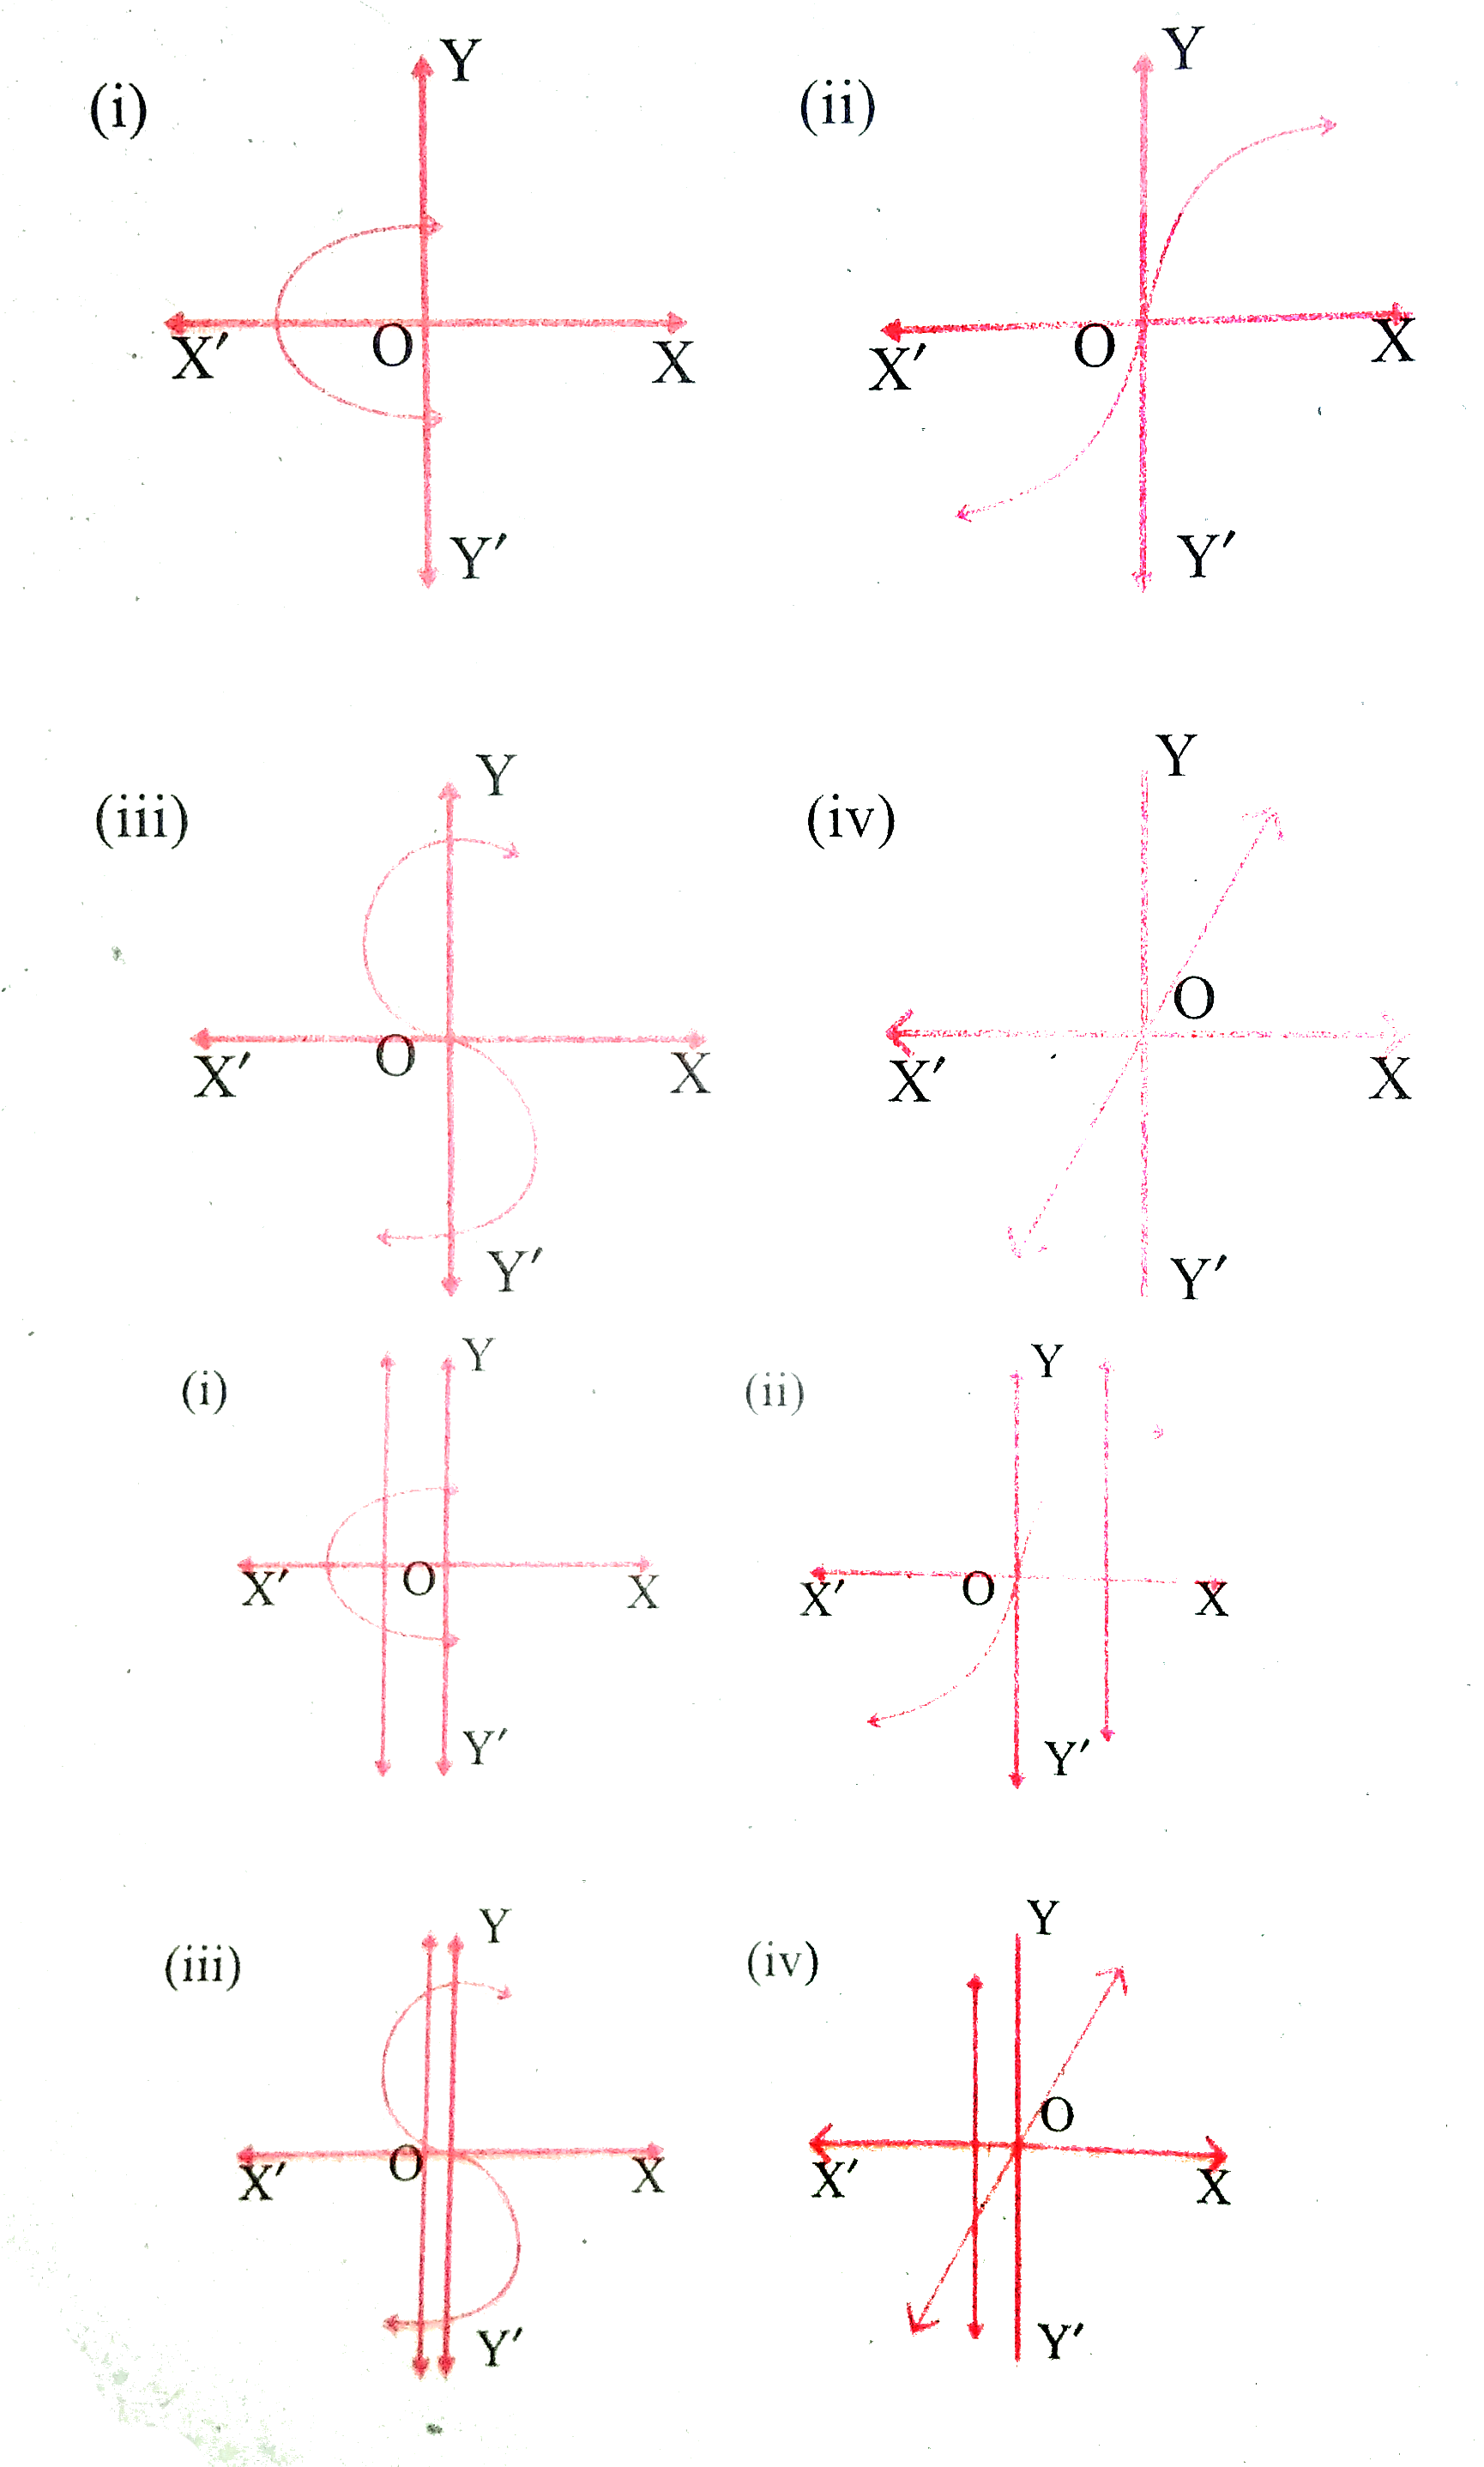
Determine whether the graph given below represents functions. Give reason for your answers concering each graph
 Solution in Tamil
Step by step video & image solution for Determine whether the graph given below represents functions. Give reason for your answers concering each graph by Maths experts to help you in doubts & scoring excellent marks in Class 10 exams.
Updated on:21/07/2023Topper's Solved these Questions
- RELATIONS AND FUNCTION BOOK - PREMIERS PUBLISHERSCHAPTER - RELATIONS AND FUNCTION EXERCISE - EXERCISE 1.5
18 Videos
- RELATIONS AND FUNCTION BOOK - PREMIERS PUBLISHERSCHAPTER - RELATIONS AND FUNCTION EXERCISE - EXERCISE 1.6
15 Videos
- RELATIONS AND FUNCTION BOOK - PREMIERS PUBLISHERSCHAPTER - RELATIONS AND FUNCTION EXERCISE - EXERCISE 1.3
16 Videos
- NUMBERS AND SEQUENCESBOOK - PREMIERS PUBLISHERSCHAPTER - NUMBERS AND SEQUENCESEXERCISE - OTHER IMPORTANT OBJECTIVE TYPE QUESTIONS
23 Videos
- STATISTICS AND PROBABILITY BOOK - PREMIERS PUBLISHERSCHAPTER - STATISTICS AND PROBABILITY EXERCISE - OTHER IMPORTANT OBJECTIVE TYPE QUESTIONS
23 Videos
Similar Questions
Using the functions f and given below ,find f∘gandg∘f, Check whether f∘g=g∘f,
f(x) =x-6,g(x) =x2
View SolutionIf n(A×B)=6andA={1,3}, then n(B) is
View SolutionLet f={(x,y)∣x,y∈Nandy=2x} be a relation on N. Find the domain, co-domain and range. Is this relation a function?
View SolutionThe quotient and remainder when 19 is divided by −3 are :
View SolutionIf the sum and mean of the data are 418 and 11 respectively then the no. of observation is the data is:
View SolutionDetermine the point of symmetry of a regular hexagon.
View SolutionDtermine the images of the following figure about the given line :
View SolutionMatch the following Column A to Column B

View SolutionMatch the following Column A to Column B

View SolutionMatch the following Column A to Column B

View SolutionFind the area of figure given below.

View SolutionFind the perimeter of the figure given below.

View SolutionFind the area of the figure given below.

View SolutionCalculate the volume of the given solid.
ltimg src="https://d10lpgp6xz60nq.cloudfront.net/physics_images/PS_MATH_VII_C06_E03_002_Q01.png" width="80%"gt
View SolutionThe area of the shaded part in the figure given below is ______.

View SolutionThe inequation represented by the graph given below is :
View Solution
