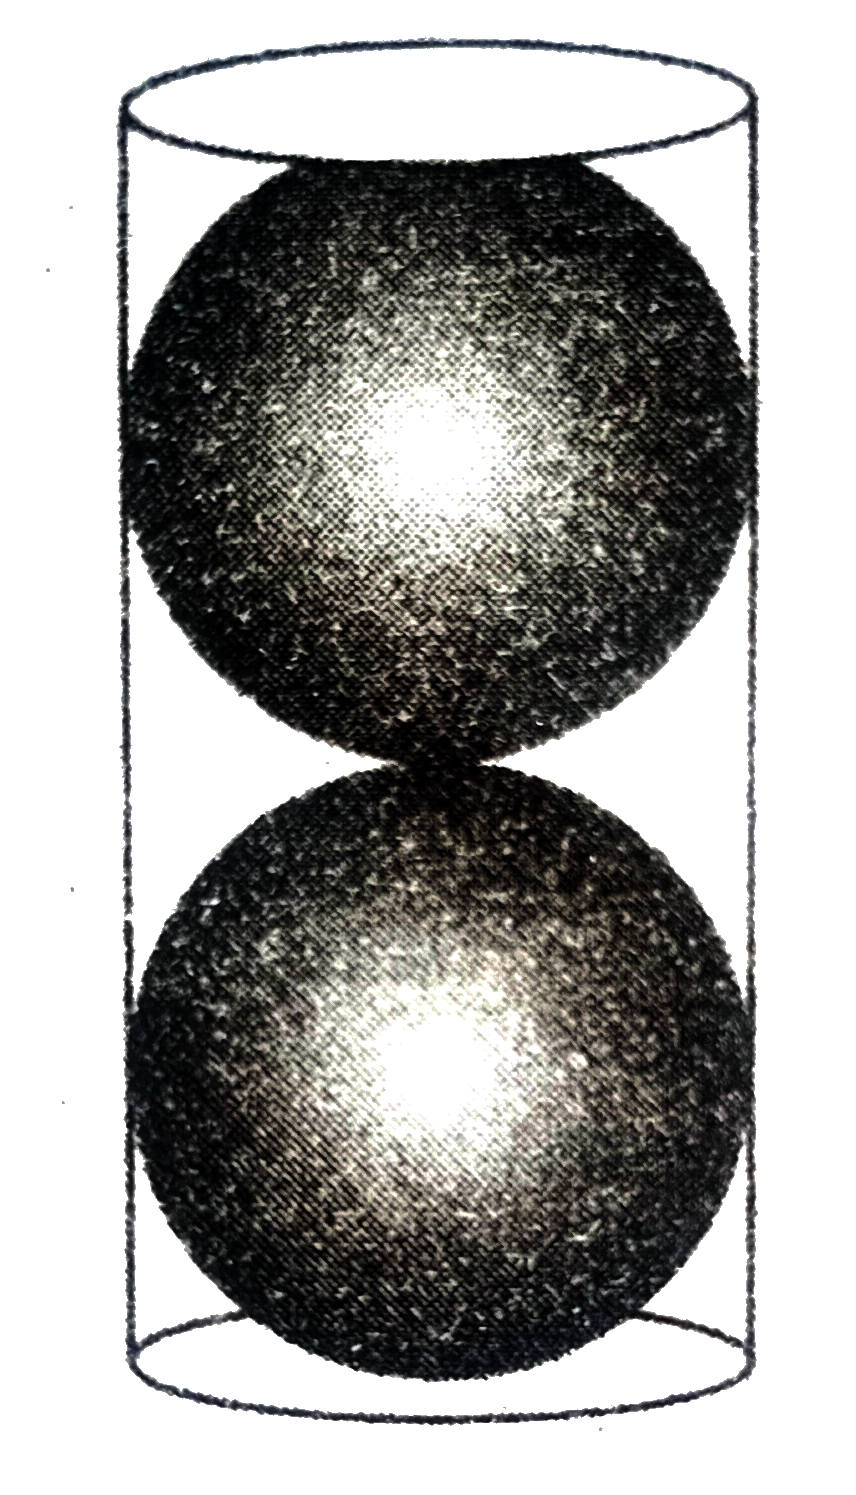
The adjacent figure shows a cylindrical can with two balls. The can is just large enough so that two balls will fit inside with the lid on. The radius of each tennis ball is 3 cm. Calculate the following

height of the cylinder.Solution in Tamil
Step by step video & image solution for The adjacent figure shows a cylindrical can with two balls. The can is just large enough so that two balls will fit inside with the lid on. The radius of each tennis ball is 3 cm. Calculate the following height of the cylinder. by Maths experts to help you in doubts & scoring excellent marks in Class 10 exams.
Updated on:21/07/2023Topper's Solved these Questions
- MENSURATIONBook:PREMIERS PUBLISHERSChapter:MENSURATIONExercise:OTHER IMPORTANT OBJECTIVE TYPE QUESTIONS
Explore 16 Videos
- MENSURATIONBook:PREMIERS PUBLISHERSChapter:MENSURATIONExercise:SOLUTION TO PROGRESS CHECK
Explore 23 Videos
- GEOMETRYBook:PREMIERS PUBLISHERSChapter:GEOMETRYExercise:OTHER IMPORTANT OBJECTIVE TYPE QUESTIONS
Explore 22 Videos
- NUMBERS AND SEQUENCESBook:PREMIERS PUBLISHERSChapter:NUMBERS AND SEQUENCESExercise:OTHER IMPORTANT OBJECTIVE TYPE QUESTIONS
Explore 23 Videos
Similar Questions
Match the following:

View SolutionRight circular cone is a solid obtained by revolving ……. about ………
View SolutionHow many tangents can be drawn to the circle from an exterior point ?
View SolutionThe quotient and remainder when 19 is divided by −3 are :
View SolutionHow many lines of symmetry does the above figure have ?
View SolutionWhich of the following are correct chain isomers of butane ? (i)
View SolutionDetermine the point of symmetry of a regular hexagon.
View SolutionDtermine the images of the following figure about the given line :
View SolutionMatch the following Column A to Column B

View SolutionMatch the following Column A to Column B

View SolutionMatch the following Column A to Column B

View SolutionThe inequation represented by the graph given below is :
View SolutionThe inequation that best describes the graph given below is _________
View SolutionThe inequation that best describes the following graph is _________
View SolutionWhich inequations represent the shaded region in the given figure
View Solution