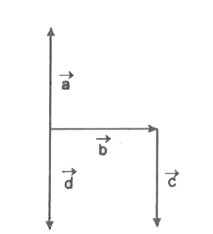
चित्र में कौन-से सदिश (i) सरेखा है ,(ii) समान है (iii)सह-आदिम है।

The correct Answer is:(i)सदिश →a,→c तथा →d सरेखा है |
(ii)सदिश →a तथा →c समान है।
(iii) सदिश →a,→b तथा →d सह-आदिम है।
Step by step video, text & image solution for चित्र में कौन-से सदिश (i) सरेखा है ,(ii) समान है (iii)सह-आदिम है। by Maths experts to help you in doubts & scoring excellent marks in Class 12 exams.
Updated on:21/07/2023Topper's Solved these Questions
- सदिशBOOK - MITTAL PUBLICATIONCHAPTER - सदिशEXERCISE - प्रश्नवाली 13.2
24 Videos
- सदिशBOOK - MITTAL PUBLICATIONCHAPTER - सदिशEXERCISE - प्रश्नवाली 13.3
21 Videos
- सदिशBOOK - MITTAL PUBLICATIONCHAPTER - सदिशEXERCISE - CHECK YOUR POTENTIALITY
15 Videos
- सततता तथा अवकलनीयता BOOK - MITTAL PUBLICATIONCHAPTER - सततता तथा अवकलनीयता EXERCISE - Check your potentiality
12 Videos
- समाकलन BOOK - MITTAL PUBLICATIONCHAPTER - समाकलन EXERCISE - Competition Questions
30 Videos
Similar Questions
निम्नलिखित सदिशों के अदिश गुणफल ज्ञात कीजिए -
4ˆi+4ˆj−ˆk और 5ˆi+ˆj+2ˆk
View Solutionनिम्नलिखित सदिशों से सदिश गुणन ज्ञात कीजिए -
2ˆi+3ˆj−5ˆk और ˆi−ˆj+ˆk
View Solutionसदिश 2ˆi+aˆj−ˆk का सदिश ˆi+2ˆj+ˆk पर प्रक्षेप −5√6 है , तब a का मान है :
View Solutiona तथा b के मान इस प्रकार है कि
f(x)=⎧⎪⎨⎪⎩7यदिx≤2ax+bयदि2<x<921यदिx≥9 द्वारा परिभाषित फलन एक सतत फलन है, तब a तथा b के मान होंगे -
View Solution∫17sin(x7+10)dx बराबर है -
View SolutionHow many lines of symmetry does the above figure have ?
View SolutionWhich of the following are correct chain isomers of butane ? (i)
View SolutionDetermine the point of symmetry of a regular hexagon.
View SolutionDtermine the images of the following figure about the given line :
View SolutionMatch the following Column A to Column B

View SolutionMatch the following Column A to Column B

View SolutionMatch the following Column A to Column B

View SolutionFind the area of the figure given below.

View SolutionThe area of the shaded part in the figure given below is ______.

View SolutionThe inequation represented by the graph given below is :
View SolutionThe inequation that best describes the graph given below is _________
View Solution
