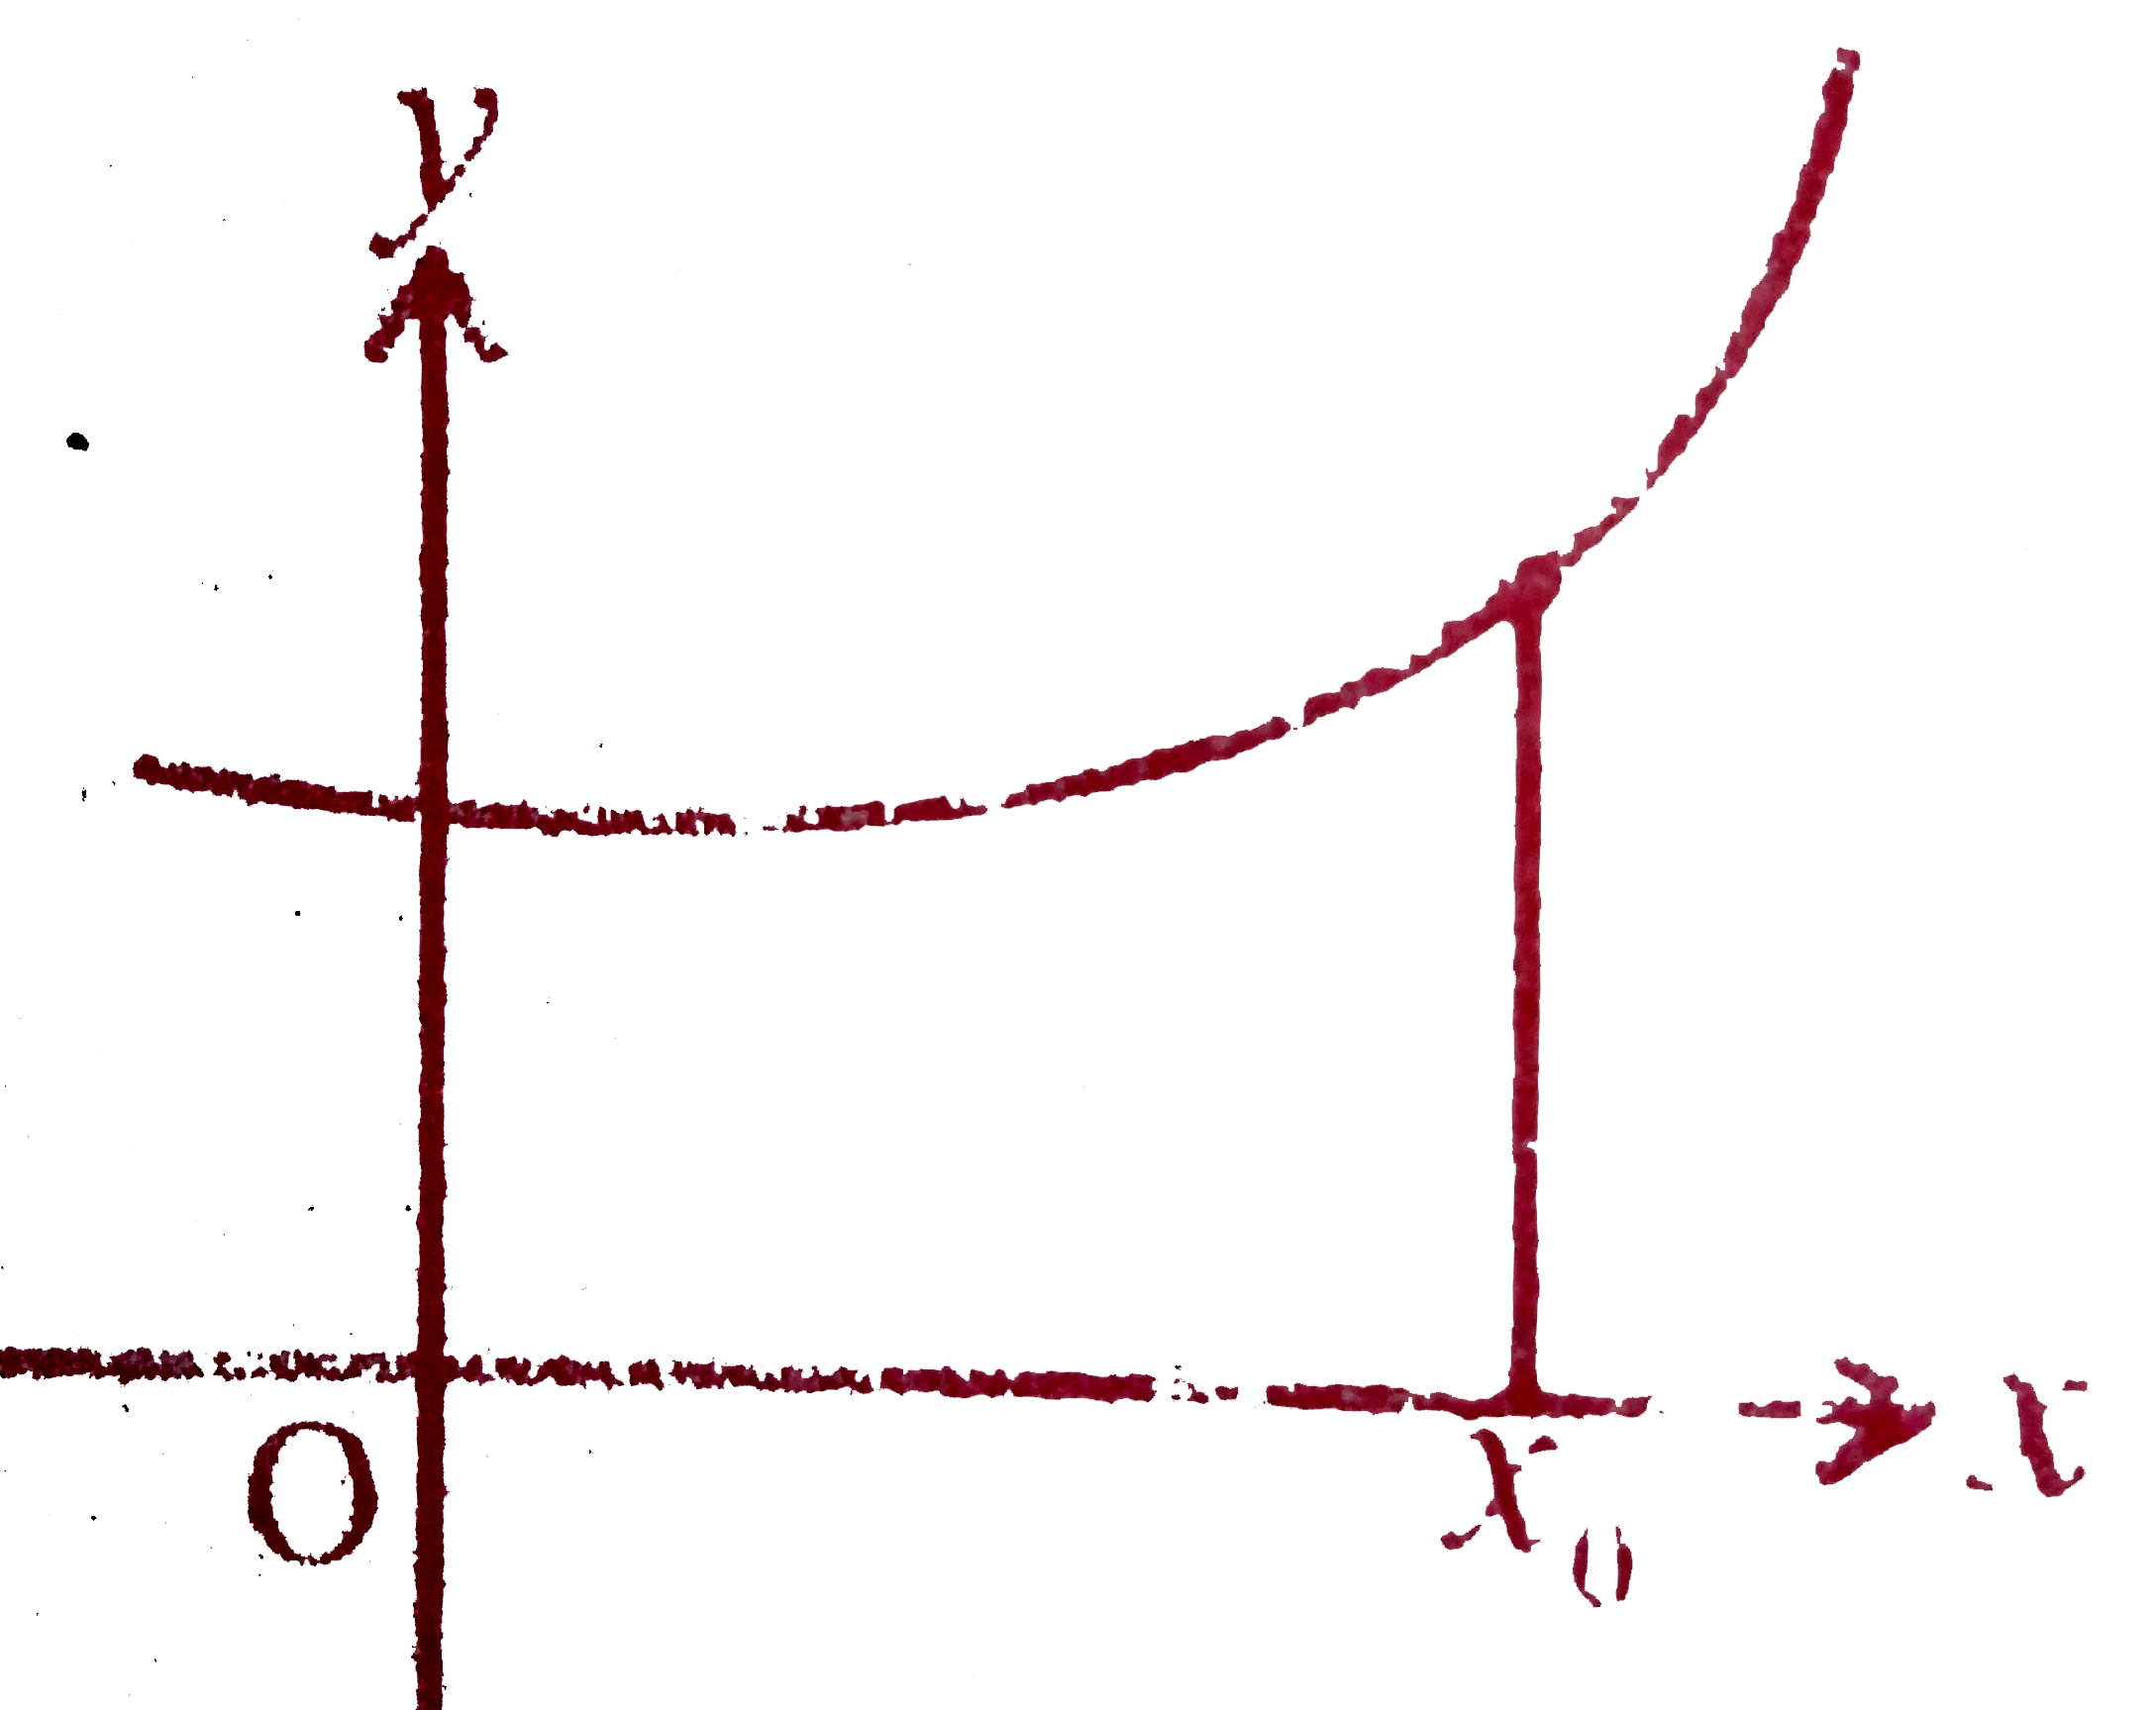
State how continuity is destroyed at x=x0 for each of the following graphs.
 Solution in Tamil
The correct Answer is:Continuity Function
Step by step video, text & image solution for State how continuity is destroyed at x=x_0 for each of the following graphs. by Maths experts to help you in doubts & scoring excellent marks in Class 11 exams.
Topper's Solved these Questions
- BOOK - PREMIERS PUBLISHERSCHAPTER - DIFFERENTIAL CALCULUS LIMITS AND CONTINUITYEXERCISE - SOLUTION TO EXERCISE 9.625videos
DIFFERENTIAL CALCULUS LIMITS AND CONTINUITY
- BOOK - PREMIERS PUBLISHERSCHAPTER - DIFFERENTIAL CALCULUS LIMITS AND CONTINUITYEXERCISE - PROBLEMS FOR PRACTICE58videos
DIFFERENTIAL CALCULUS LIMITS AND CONTINUITY
- BOOK - PREMIERS PUBLISHERSCHAPTER - DIFFERENTIAL CALCULUS LIMITS AND CONTINUITYEXERCISE - SOLUTION TO EXERCISE 9.428videos
DIFFERENTIAL CALCULUS LIMITS AND CONTINUITY
- BOOK - PREMIERS PUBLISHERSCHAPTER - DIFFEREMTIAL CALCULUS DIFFERENTIABILITY AND METHODS OF DIFFERENTITAION EXERCISE - PROBLEMS FOR PRACTICE73videos
DIFFEREMTIAL CALCULUS DIFFERENTIABILITY AND METHODS OF DIFFERENTITAION
- BOOK - PREMIERS PUBLISHERSCHAPTER - EXAMINATION QUESTION PAPER MARCH 2019EXERCISE - PART -IV4videos
EXAMINATION QUESTION PAPER MARCH 2019
Similar Questions
Choose the correct or the most suitable answer from the given four alternatives.
limx→0sinxx01:37View SolutionEvaluate :limx→0√x+4−2x by filling the table.
 06:07View Solution
limx→∞(1+1x)7x
02:11View SolutionIfy=13√x+log5x+8,f∈ddydx.
01:31View SolutionWrite any five different forms of an equation of a straight line.
02:45View SolutionHow many lines of symmetry does the above figure have ?
02:17View SolutionWhich of the following are correct chain isomers of butane ? (i)
05:41View SolutionDetermine the point of symmetry of a regular hexagon.
02:10View SolutionDtermine the images of the following figure about the given line :
02:17View SolutionMatch the following Column A to Column B
 02:10View Solution
Match the following Column A to Column B
 04:23View Solution
Match the following Column A to Column B
 01:13View Solution
The inequation represented by the graph given below is :
01:50View SolutionThe inequation that best describes the graph given below is _________
02:41View SolutionThe inequation that best describes the following graph is _________
03:12View SolutionWhich inequations represent the shaded region in the given figure
02:34View Solution

