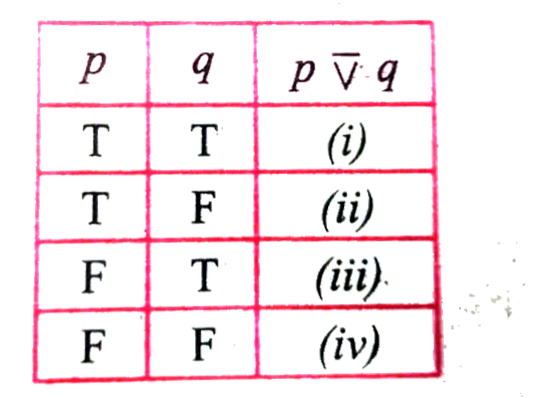
Truth table for p−∪q is given below

Which of the following is true? Solution in Tamil
iiiiiiivaFTTF
iiiiiiivbFFTT
iiiiiiivcTFTF
iiiiiiivdFFFF
The correct Answer is:A
Step by step video, text & image solution for Truth table for p overset(-)(cup) q is given below Which of the following is true? by Maths experts to help you in doubts & scoring excellent marks in Class 12 exams.
Topper's Solved these Questions
- BOOK - PREMIERS PUBLISHERSCHAPTER - DISCRETE MATHEMATICSEXERCISE - Solution To Exercise 12.320videos
DISCRETE MATHEMATICS
- BOOK - PREMIERS PUBLISHERSCHAPTER - DIFFERENTIALS AND PARTIAL DERIVATIVESEXERCISE - PROBLEMS FOR PRACTICE40videos
DIFFERENTIALS AND PARTIAL DERIVATIVES
- BOOK - PREMIERS PUBLISHERSCHAPTER - INVERSE TRIGONOMETRIC FUNCTIONS EXERCISE - PROBLEMS FOR PRACTICE ( ANSWER THE FOLLOWING QUESTIONS ):24videos
INVERSE TRIGONOMETRIC FUNCTIONS
Similar Questions
A binary operation on a set S is a function from
02:15View SolutionThe percentage error of the seventh root of 700 is approximate how many times the percentage of 700:
06:07View SolutionFind the principal value of
sin−11√202:11View SolutionName the enzymes 'P' and 'Q' that are involved in the processes given below.
ltimg src="https://d10lpgp6xz60nq.cloudfront.net/physics_images/BIO_044_SQP_XII_E01_005_Q01.png" width="80%"gt01:31View SolutionWhich of the following are correct chain isomers of butane ? (i)
02:45View SolutionDetermine the point of symmetry of a regular hexagon.
02:17View SolutionDtermine the images of the following figure about the given line :
05:41View SolutionMatch the following Column A to Column B
 03:28View Solution
Match the following Column A to Column B
 02:31View Solution
Match the following Column A to Column B
 02:21View Solution
Find the area of figure given below.
 02:03View Solution
Find the perimeter of the figure given below.
 02:10View Solution
Find the area of the figure given below.
 02:17View Solution
The area of the shaded part in the figure given below is ______.
 02:10View Solution
The inequation represented by the graph given below is :
04:23View SolutionThe inequation that best describes the graph given below is _________
01:49View Solution

