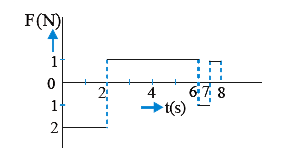
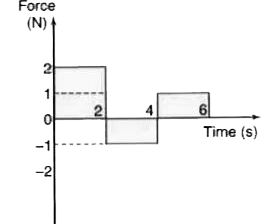
A force-time graph for the motion of a body is shown in fig. change in linear momentum between 0 and 8 s is:-

A
Zero
B
4N-s
C
8Ns
D
None
Video Solution
Text Solution
The correct Answer is:A
Δp=∫Fdt=0 (area of F-t graph is zero)
|
Updated on:21/07/2023
Topper's Solved these Questions
- BOOK - ALLENCHAPTER - NEWTONS LAWS OF MOTIONEXERCISE - EXERCISE-III28videos
NEWTONS LAWS OF MOTION
- BOOK - ALLENCHAPTER - NEWTONS LAWS OF MOTIONEXERCISE - EXERCISE-I52videos
NEWTONS LAWS OF MOTION
- BOOK - ALLENCHAPTER - NEWTON'S LAWS OF MOTION & FRICTIONEXERCISE - EXERCISE (JA)4videos
NEWTON'S LAWS OF MOTION & FRICTION
- BOOK - ALLENCHAPTER - RACEEXERCISE - Basic Maths (Wave Motion & Dopplers Effect) (Stationary waves & doppler effect, beats)25videos
RACE
Similar Questions
Knowledge Check
- Question 1 - Select One
A force-time graph for the motion of a body is shown in figure. Change in linear momentum between 0 and 8 s is:
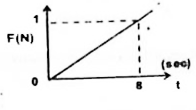 AZeroB4 N-sC8 NsDNone of these
 - Question 2 - Select One
A force time graph for the motion of a body is as shown in figure. Change in linear momentum between 0 and 6s is
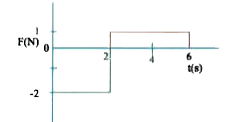 AzeroB8 NsC4 NsD2 Ns
 - Question 3 - Select One
A force time graph for the motion of a body is as shown in Change in linear momentum between 0 and 6s is
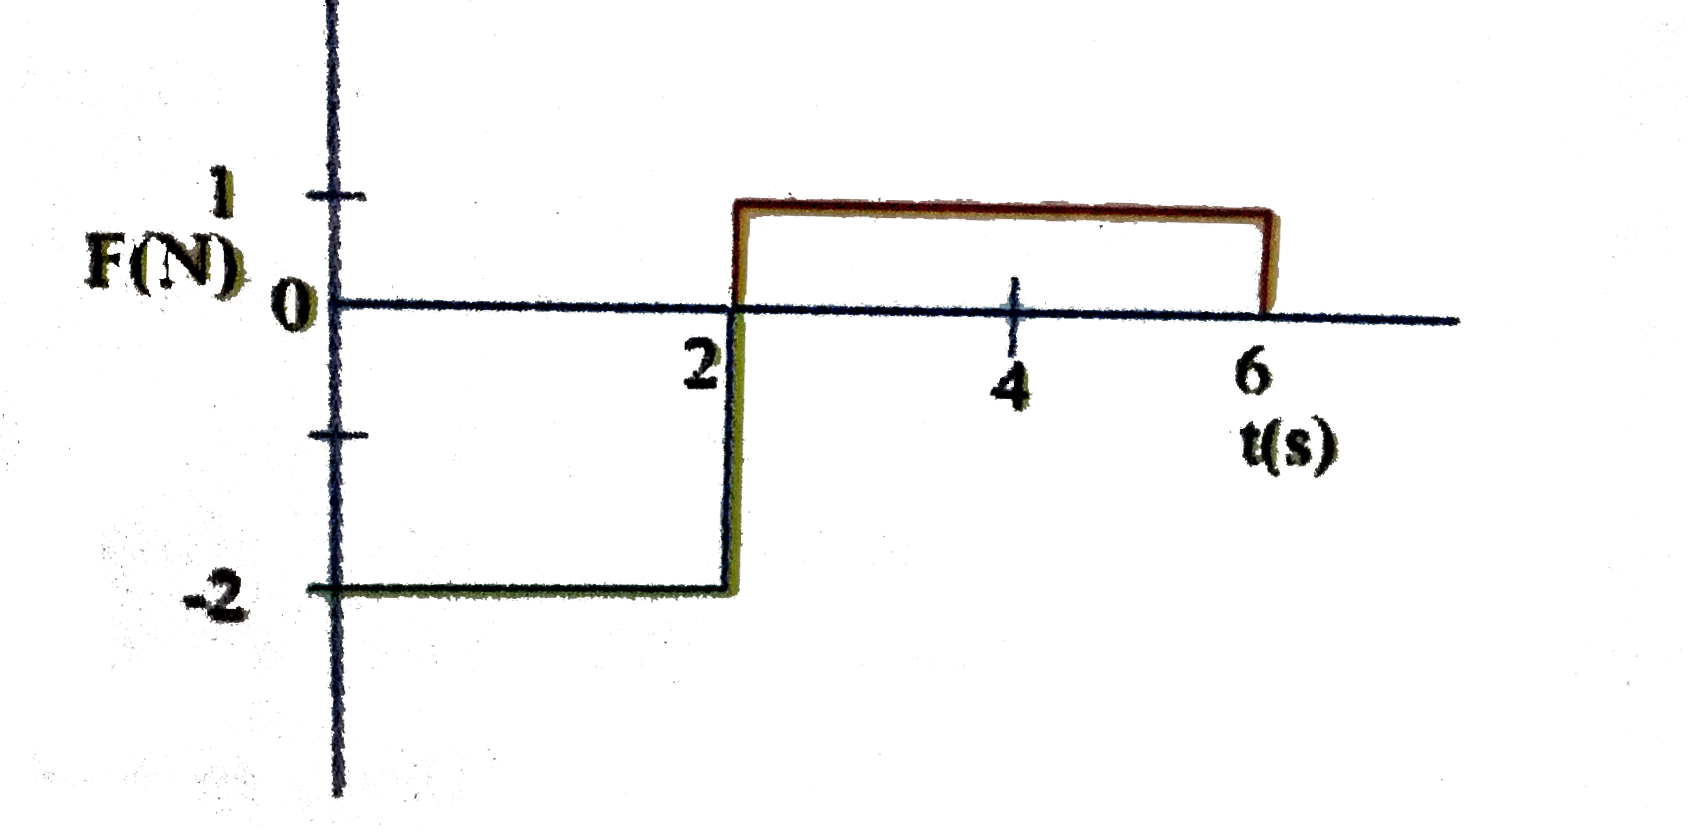 .AzeroB8NsC4NsD2Ns
s-t graph of a particle in motion is shown in Fig. Calculate
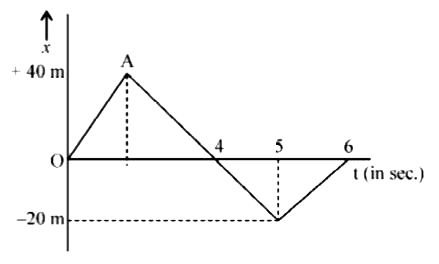
DisplacementView SolutionThe velocity-time graph of a linear motion is shown in figure. The displacement from the origin after 8 sec is :
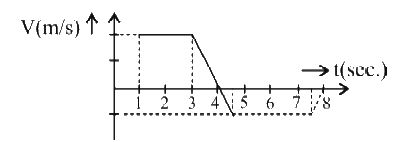 View Solution
A force-time graph for the motion of a body is shown in the figure. The change in the momentum of the body between zero and 10sec is
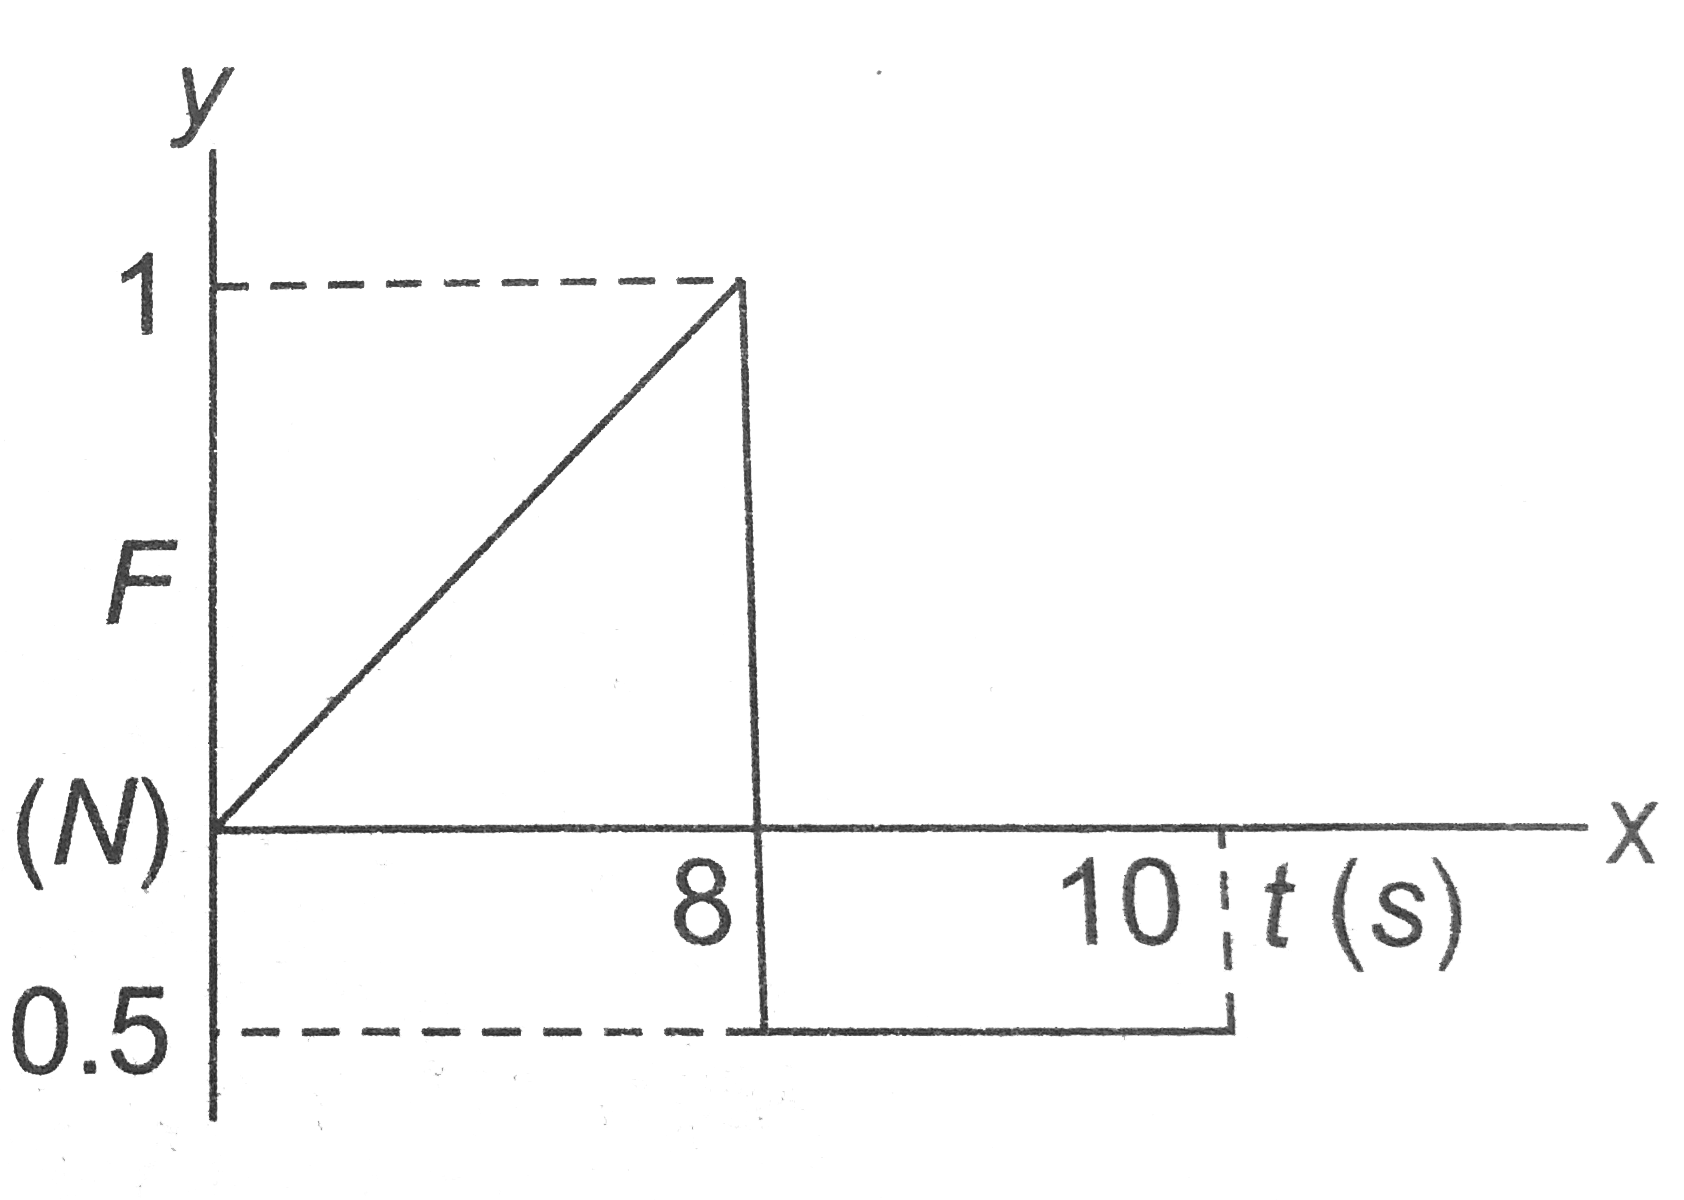 View Solution
A force-time graph for a linear motion is shown in figure. The linear momentum gained between 0 and 6 second is
 View Solution
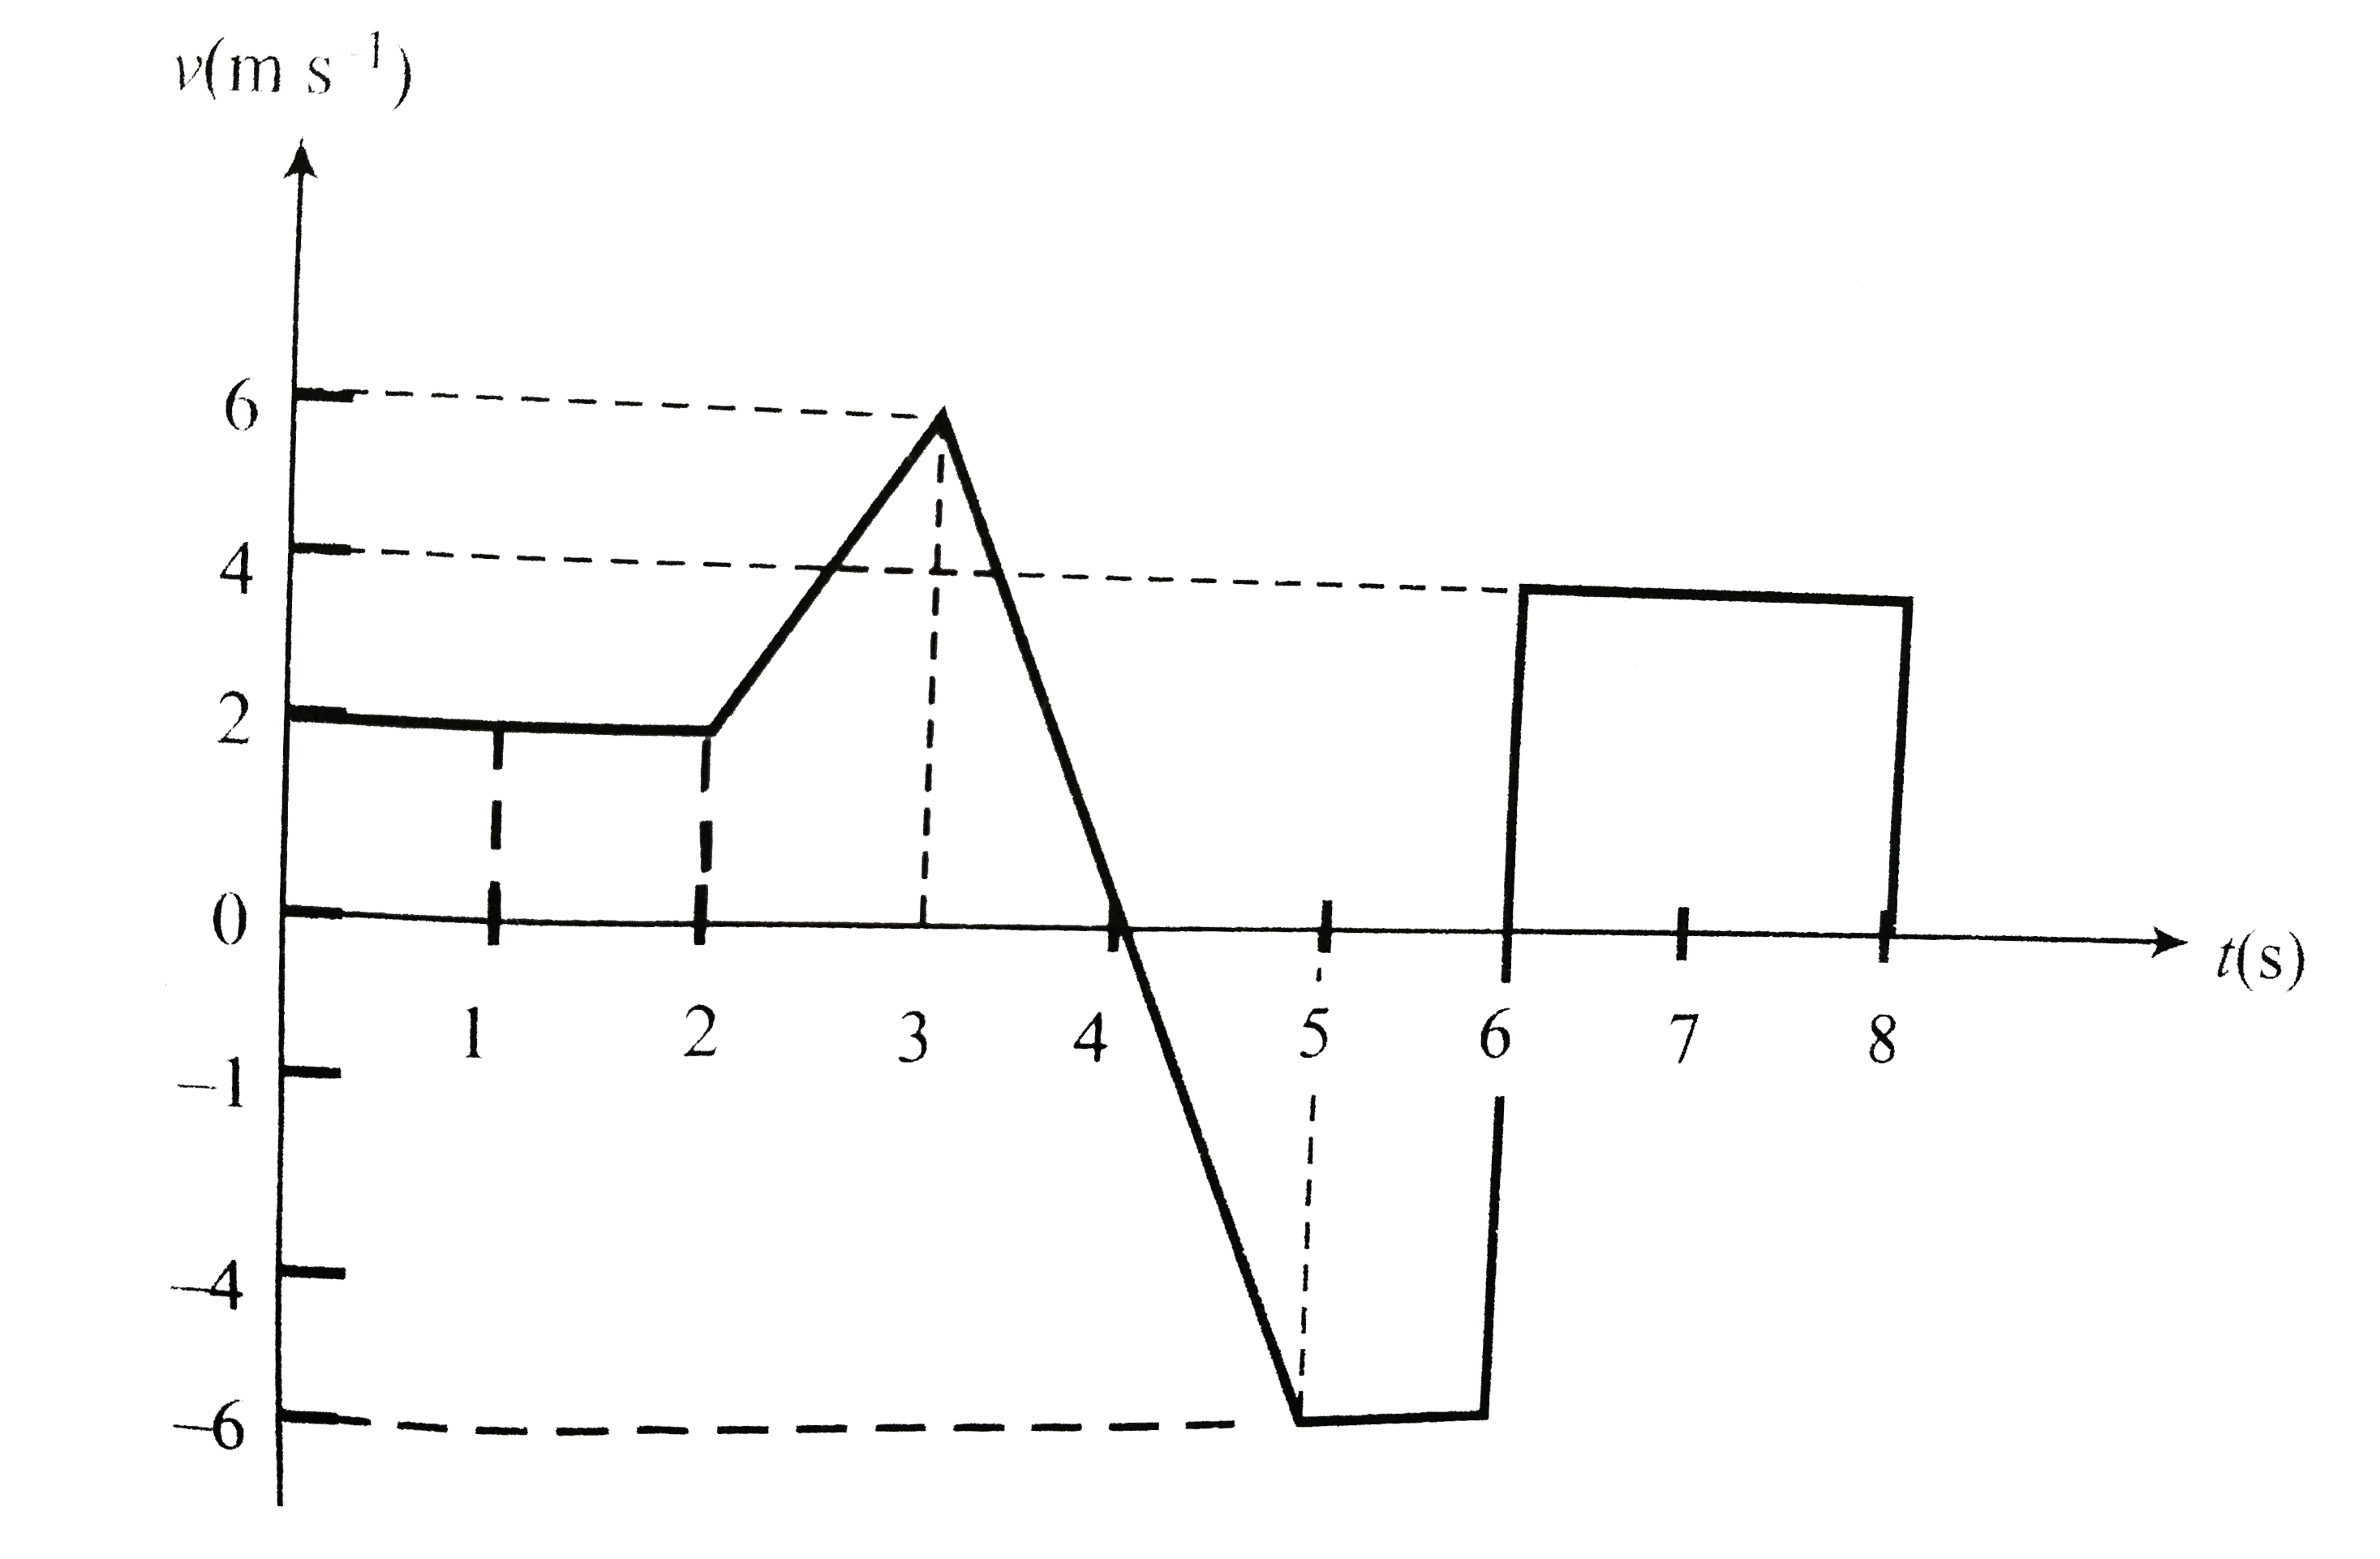
The velocity-time graph of a body is shown in .
The displacement of the body in 8s is.
 .View Solution


