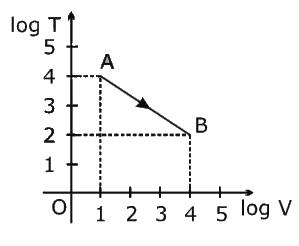
Figure shows the adiabatic curve on log-log scale performed on a ideal gas. The gas must be:-
_S01_085_Q01.png)
A
Monoatomic
B
Diatomic
C
A mixture of monoatomic and diatomic
D
A mixture of diatomic and polyatomic
Video Solution
Text Solution
The correct Answer is:C
For adiabatic process TVγ−1 = constant
⇒log T + (gamma - 1) "log" V=constant imlpiesslope=-(gamma-1) = - ((5)/(10)) implies gamma = (3)/(2)<br>Formonoa→micgasgamma =(5)/(3), For diatomic gas γ=75 As75<γ=32<53
Hence, the gas must be a mixture of monoatomic & diatomic gas.
|
Topper's Solved these Questions
- GEOMETRICAL OPTICSBook:ALLENChapter:GEOMETRICAL OPTICSExercise:EXERCISE -01
Explore 65 Videos
- GEOMETRICAL OPTICSBook:ALLENChapter:GEOMETRICAL OPTICSExercise:EXERCISE -02
Explore 82 Videos
- GEOMETRICAL OPTICSBook:ALLENChapter:GEOMETRICAL OPTICSExercise:subjective
Explore 14 Videos
- CURRENT ELECTRICITYBook:ALLENChapter:CURRENT ELECTRICITYExercise:All Questions
Explore 427 Videos
- GRAVITATIONBook:ALLENChapter:GRAVITATIONExercise:EXERCISE 4
Explore 9 Videos
Similar Questions
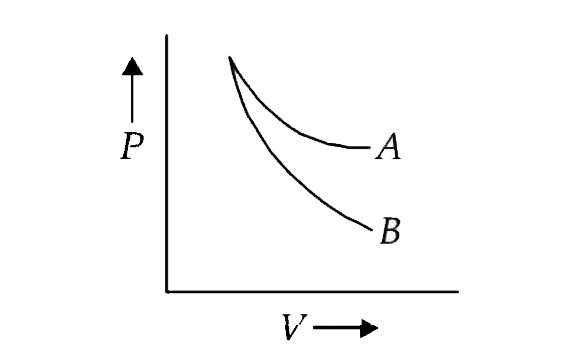
The curves A and B in the figure shown P-V graphs for an isothermal and an adiabatic process for an idea gas. The isothermal process is represented by the curve A.

View SolutionThe figure demonstrates the adiabatic curves for two gases, helium and carbon dioxide. Which curve corresponds to which gas?
View Solution
Knowledge Check
Figure shows, the adiabatic curve on a log T and log V scale performed on ideal gas. The gas is -
 AMonatomicBDiatomicCPolyatomicDMixture of monatomic and diatomic
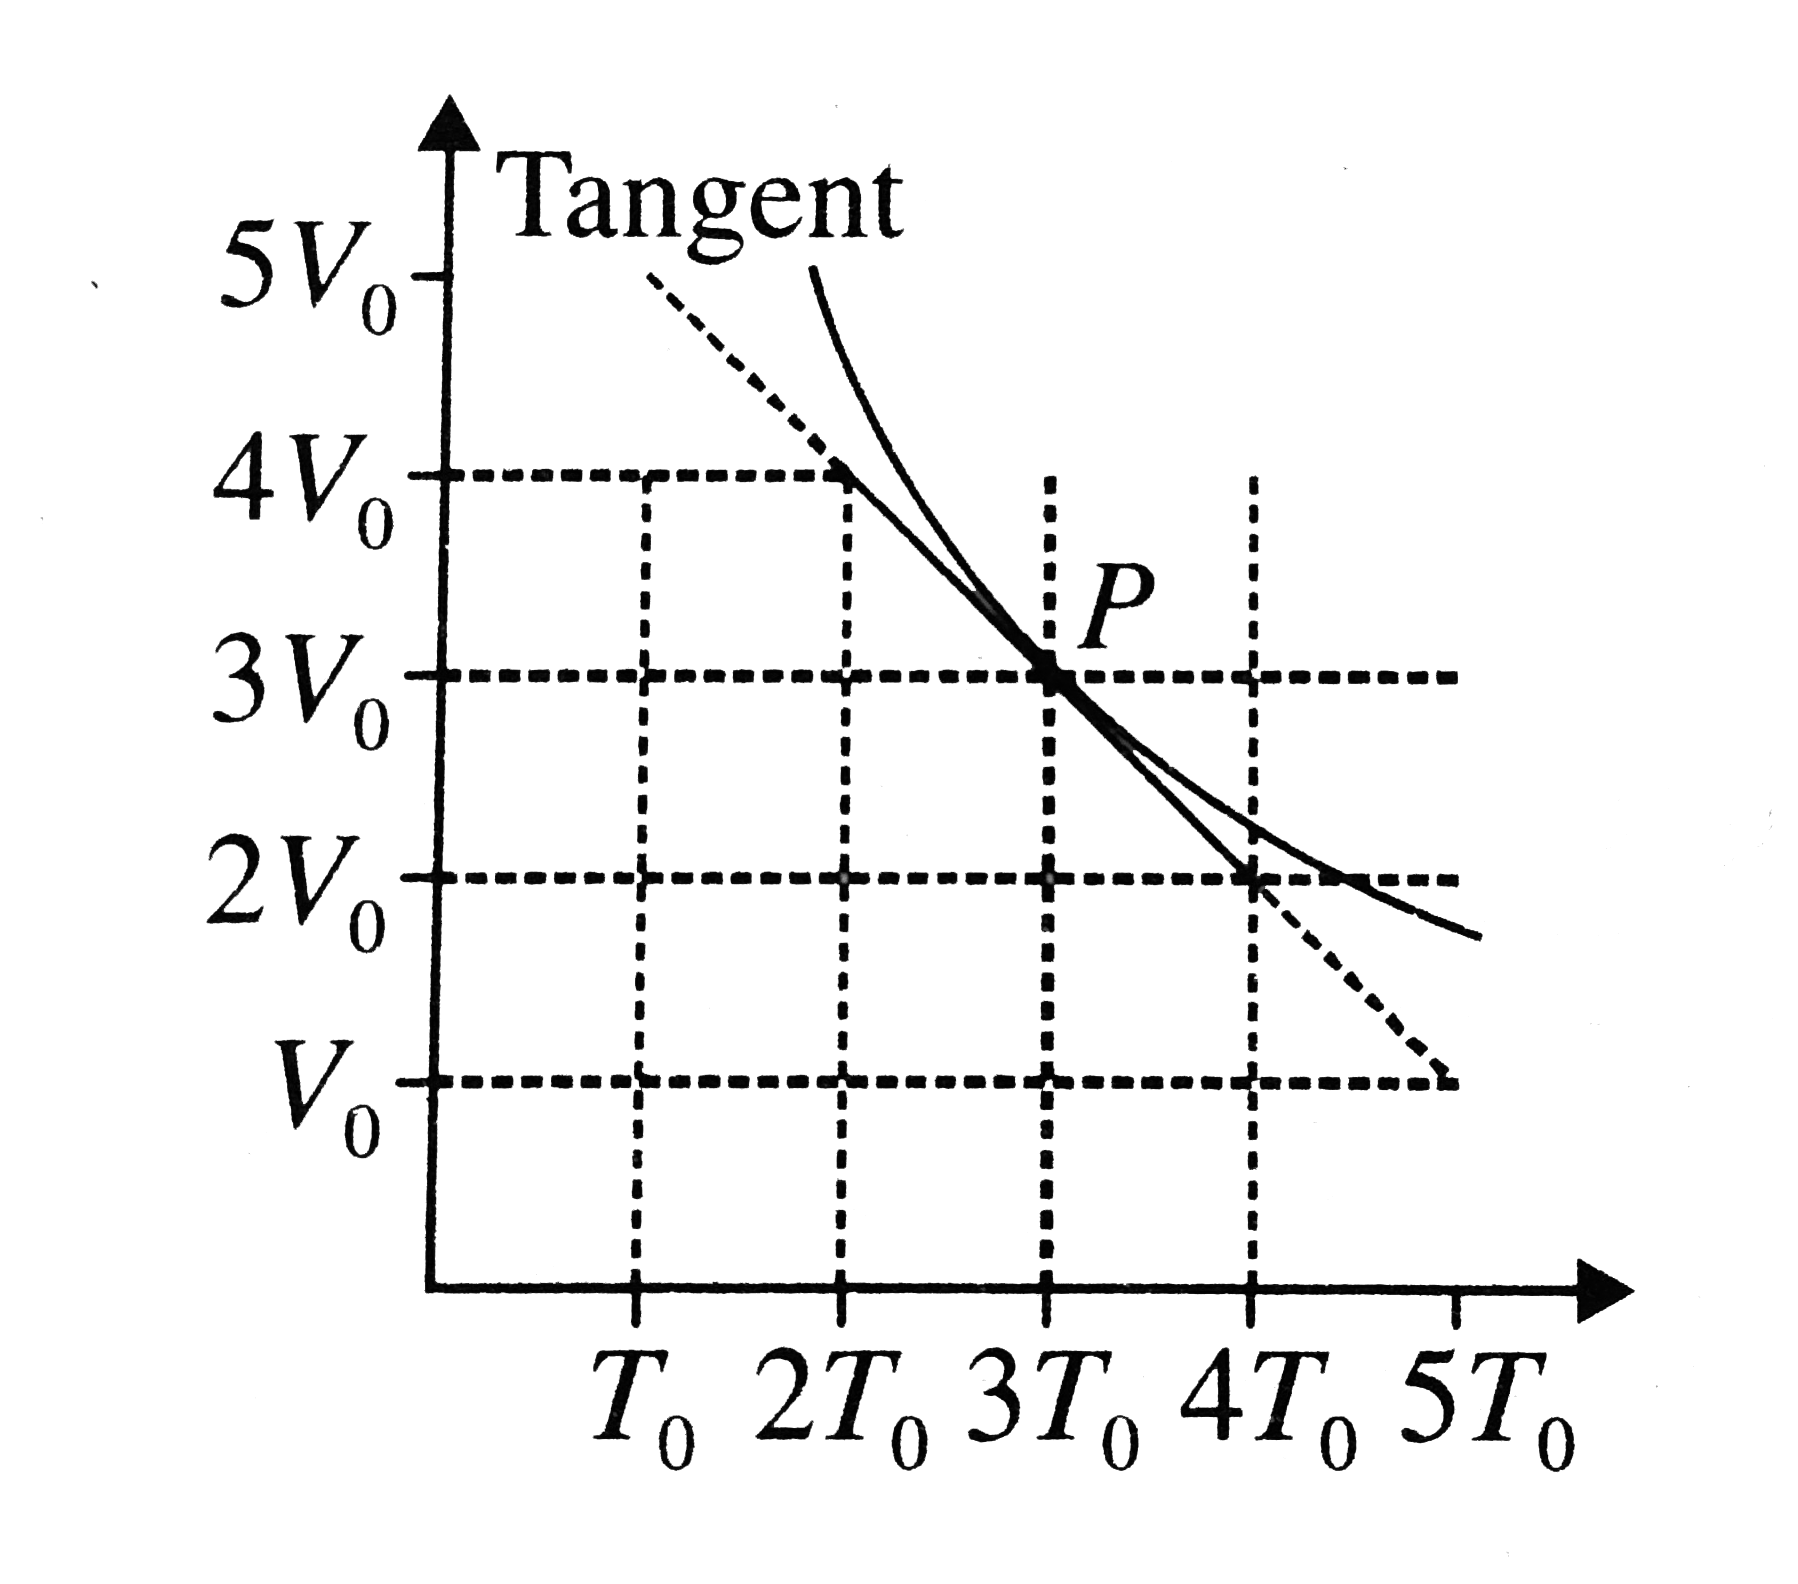
Figure shows the adiabatic curve for n moles of an ideal gas, the bulk modulus for the gas corresponding to the point P will be
 A5nRT03V0BnR(2+T0V0)CnR(1+T0V0)D2nRT0V0
For the adiabatic expansion of an ideal gas
APV1 = constantBTV−1 = constantCT1P1−y= constantDnone of the above
For the adiabatic expansion of an ideal gas
View SolutionFor the adiabatic expansion of an ideal gas:
View SolutionFor the adiabatic expansion of an ideal gas:
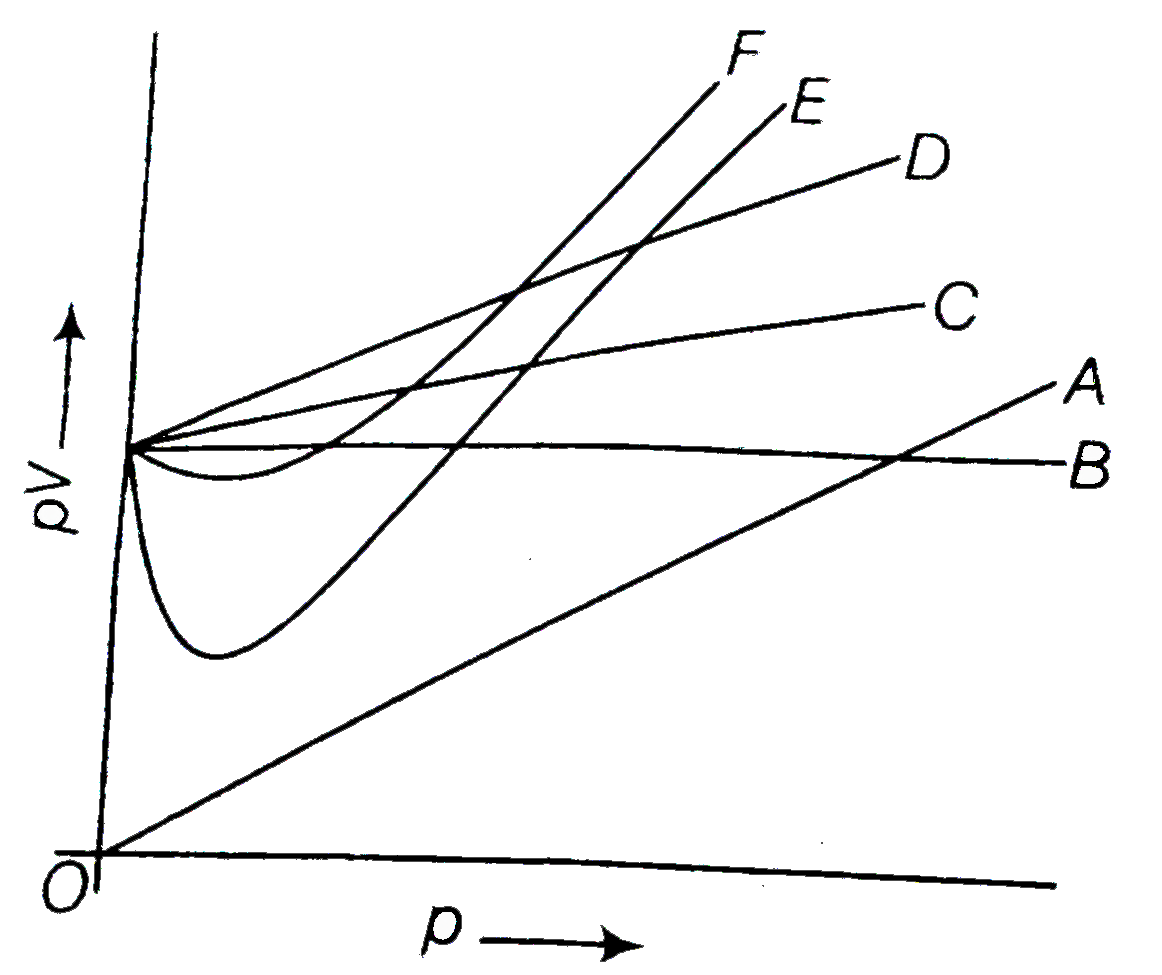
View SolutionWhich curve in figure represents the curve of ideal gas ?

View SolutionWhich curve in figure represents the curve of ideal gas?

View Solution
