The figure shows the results of an experiment involving photoelectric effect. The graphs A, B,C and D relate to a light beam having different wavelengths. Select the correct alternative.
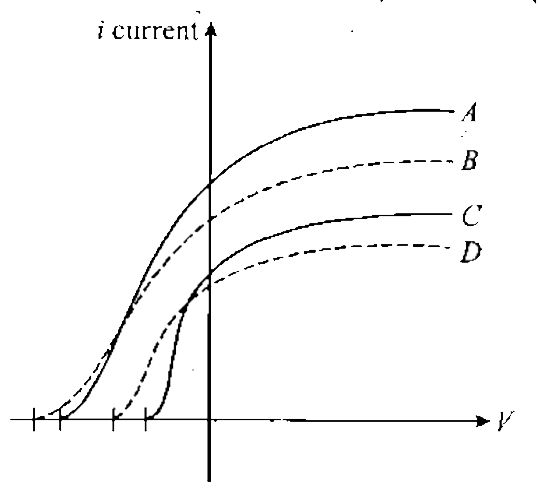
Beam B has highest frequency
Beam C has highest frequency
Beam A has highest rate of photoelectric emission
Photoelectron emitted by B have highest momentum
The correct Answer is:A, B, C, D
Stopping potential∝frequency∝1wavelength
Saturation current∝rate of photoelectron
emission. Also, K.Emax=hv−ϕ,P=√2mKE
Topper's Solved these Questions
- BOOK - ALLENCHAPTER - SIMPLE HARMONIC MOTIONEXERCISE - Exercise - 092videos
SIMPLE HARMONIC MOTION
- BOOK - ALLENCHAPTER - SIMPLE HARMONIC MOTIONEXERCISE - Exercise - 102videos
SIMPLE HARMONIC MOTION
- BOOK - ALLENCHAPTER - SIMPLE HARMONIC MOTIONEXERCISE - Exercise - 072videos
SIMPLE HARMONIC MOTION
- BOOK - ALLENCHAPTER - RACEEXERCISE - Basic Maths (Wave Motion & Dopplers Effect) (Stationary waves & doppler effect, beats)25videos
RACE
- BOOK - ALLENCHAPTER - TEST PAPEREXERCISE - PHYSICS4videos
TEST PAPER
Similar Questions
Thefigure shows the results of an experiment involving photoelectric effect. The graphs A, B,C and D relate to a light beam having different wavelengths. Select the correct alternative.
 View Solution
Plot a graph showing the variation of photoelectric current with anode potential for two light beam of same wavelength but different intensity.
View Solution
Knowledge Check
- Question 1 - Select One
Figure shows a results of an experiment inolving photoelectric effect. The graph A,B,C,D are related to light beams having differents wavelength. Choose incorrect option:
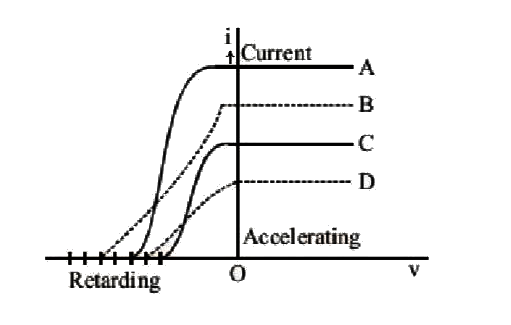 ABeam B has highest frequencyBPhotoelectrons ejected by beam B have momentum greater than C and less than ACBeam A has the highest rate of photoelectric emissionDBeam C has longest wavelength
 - Question 2 - Select One
Figure shows the results of an experiment involving photoelectric effect. The graphs A, B, C, D are related to the light beams having different wavelength. Choose incorrect option :-
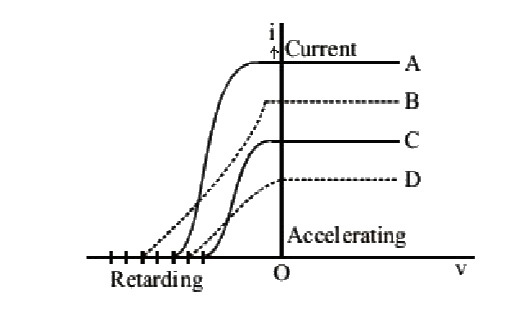 ABeam B has highest frequencyBPhotoelectrons ejected by beam B have momentum greater than C and less then ACBeam A has the highest rate of photoelectric emissionDBeam C has longest wavelength
 - Question 3 - Select One or More
For photoelectric effect with incident photon wavelength λ, the stopping potential is V0 Select the correct graph.
A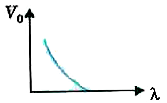 B
B C
C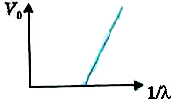 D
D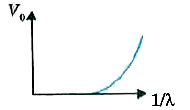
If →A×→B=→C+→D, then select the correct alternative.
View SolutionIdentify the figures A,B,C showing different types of muscle and select the correct option
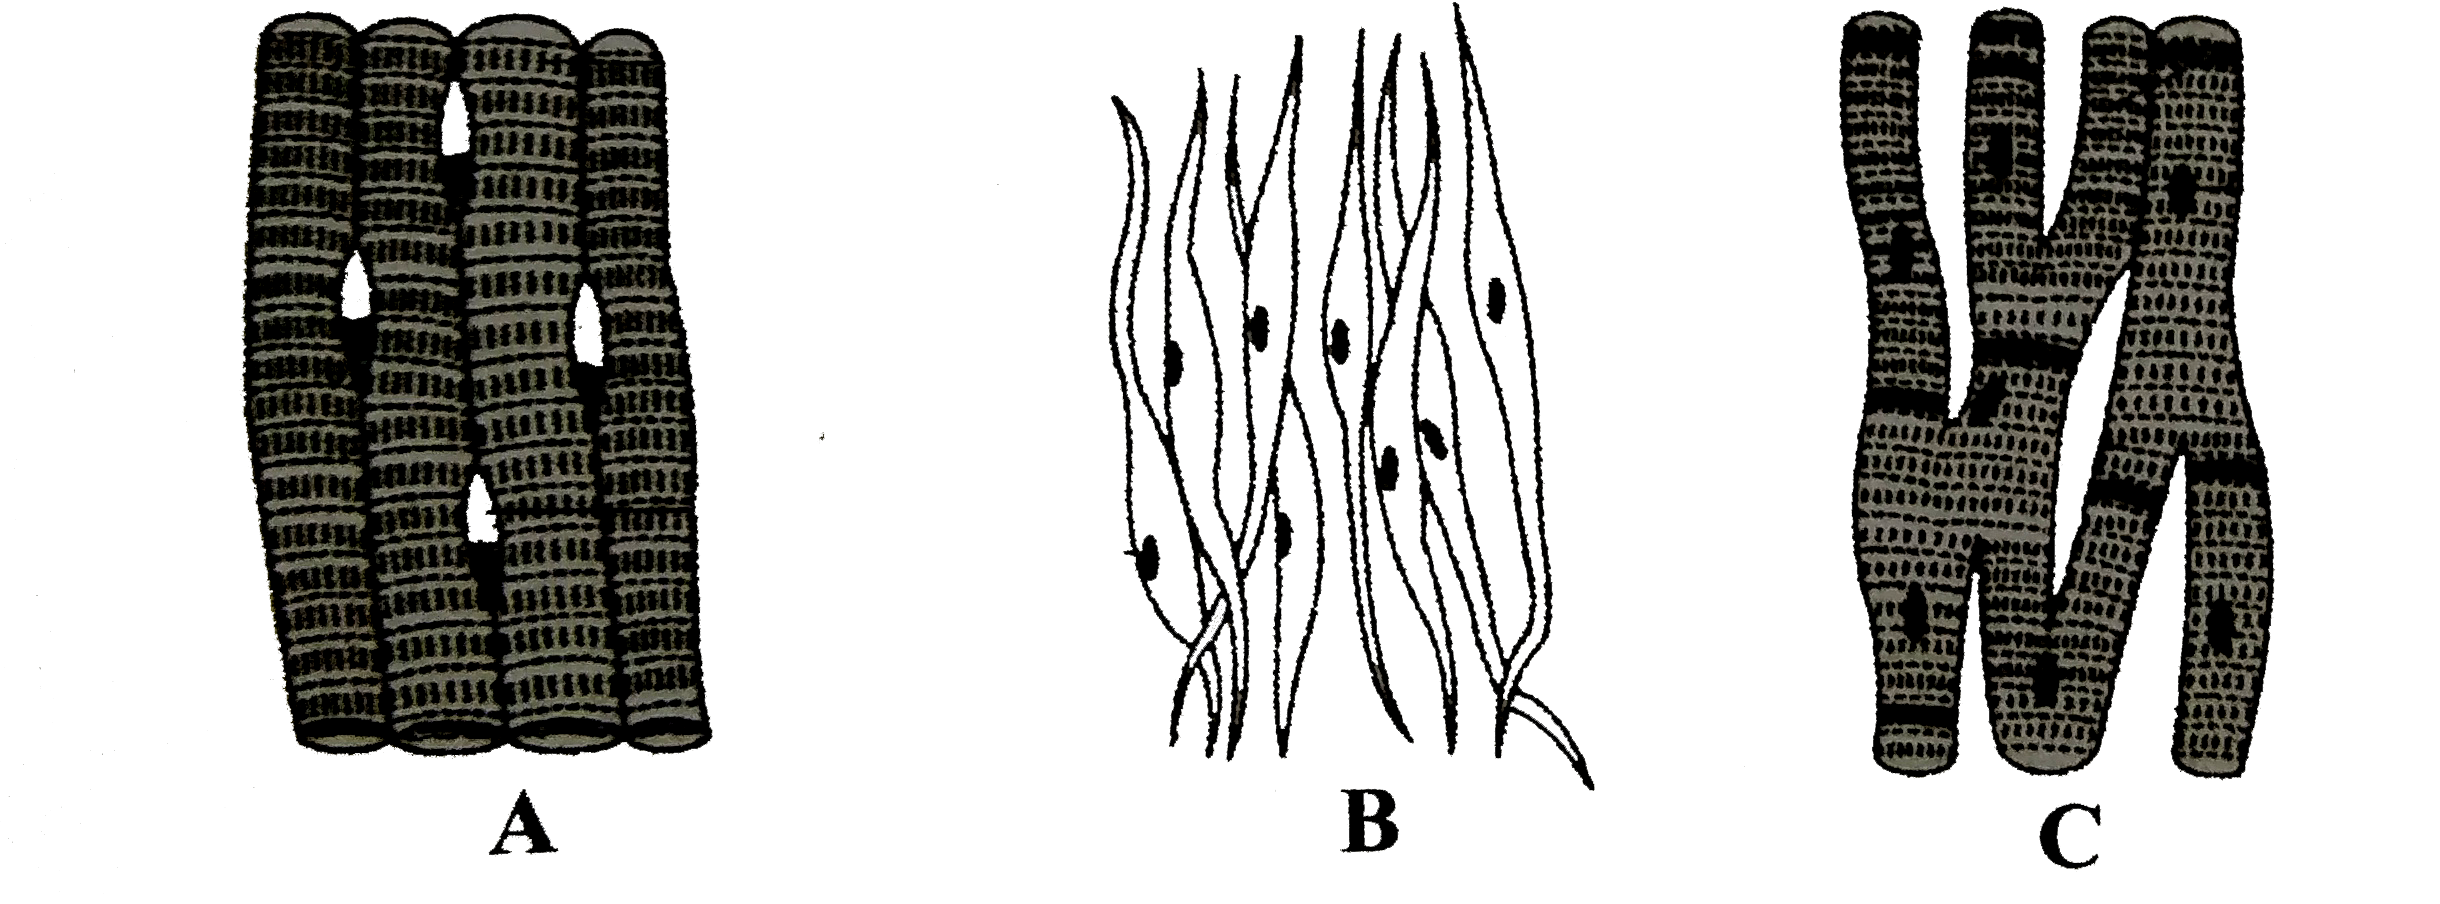 View Solution
Given figure shows the effect of interruption of skotoperiod (dark period) in a short day plant by light of different types.
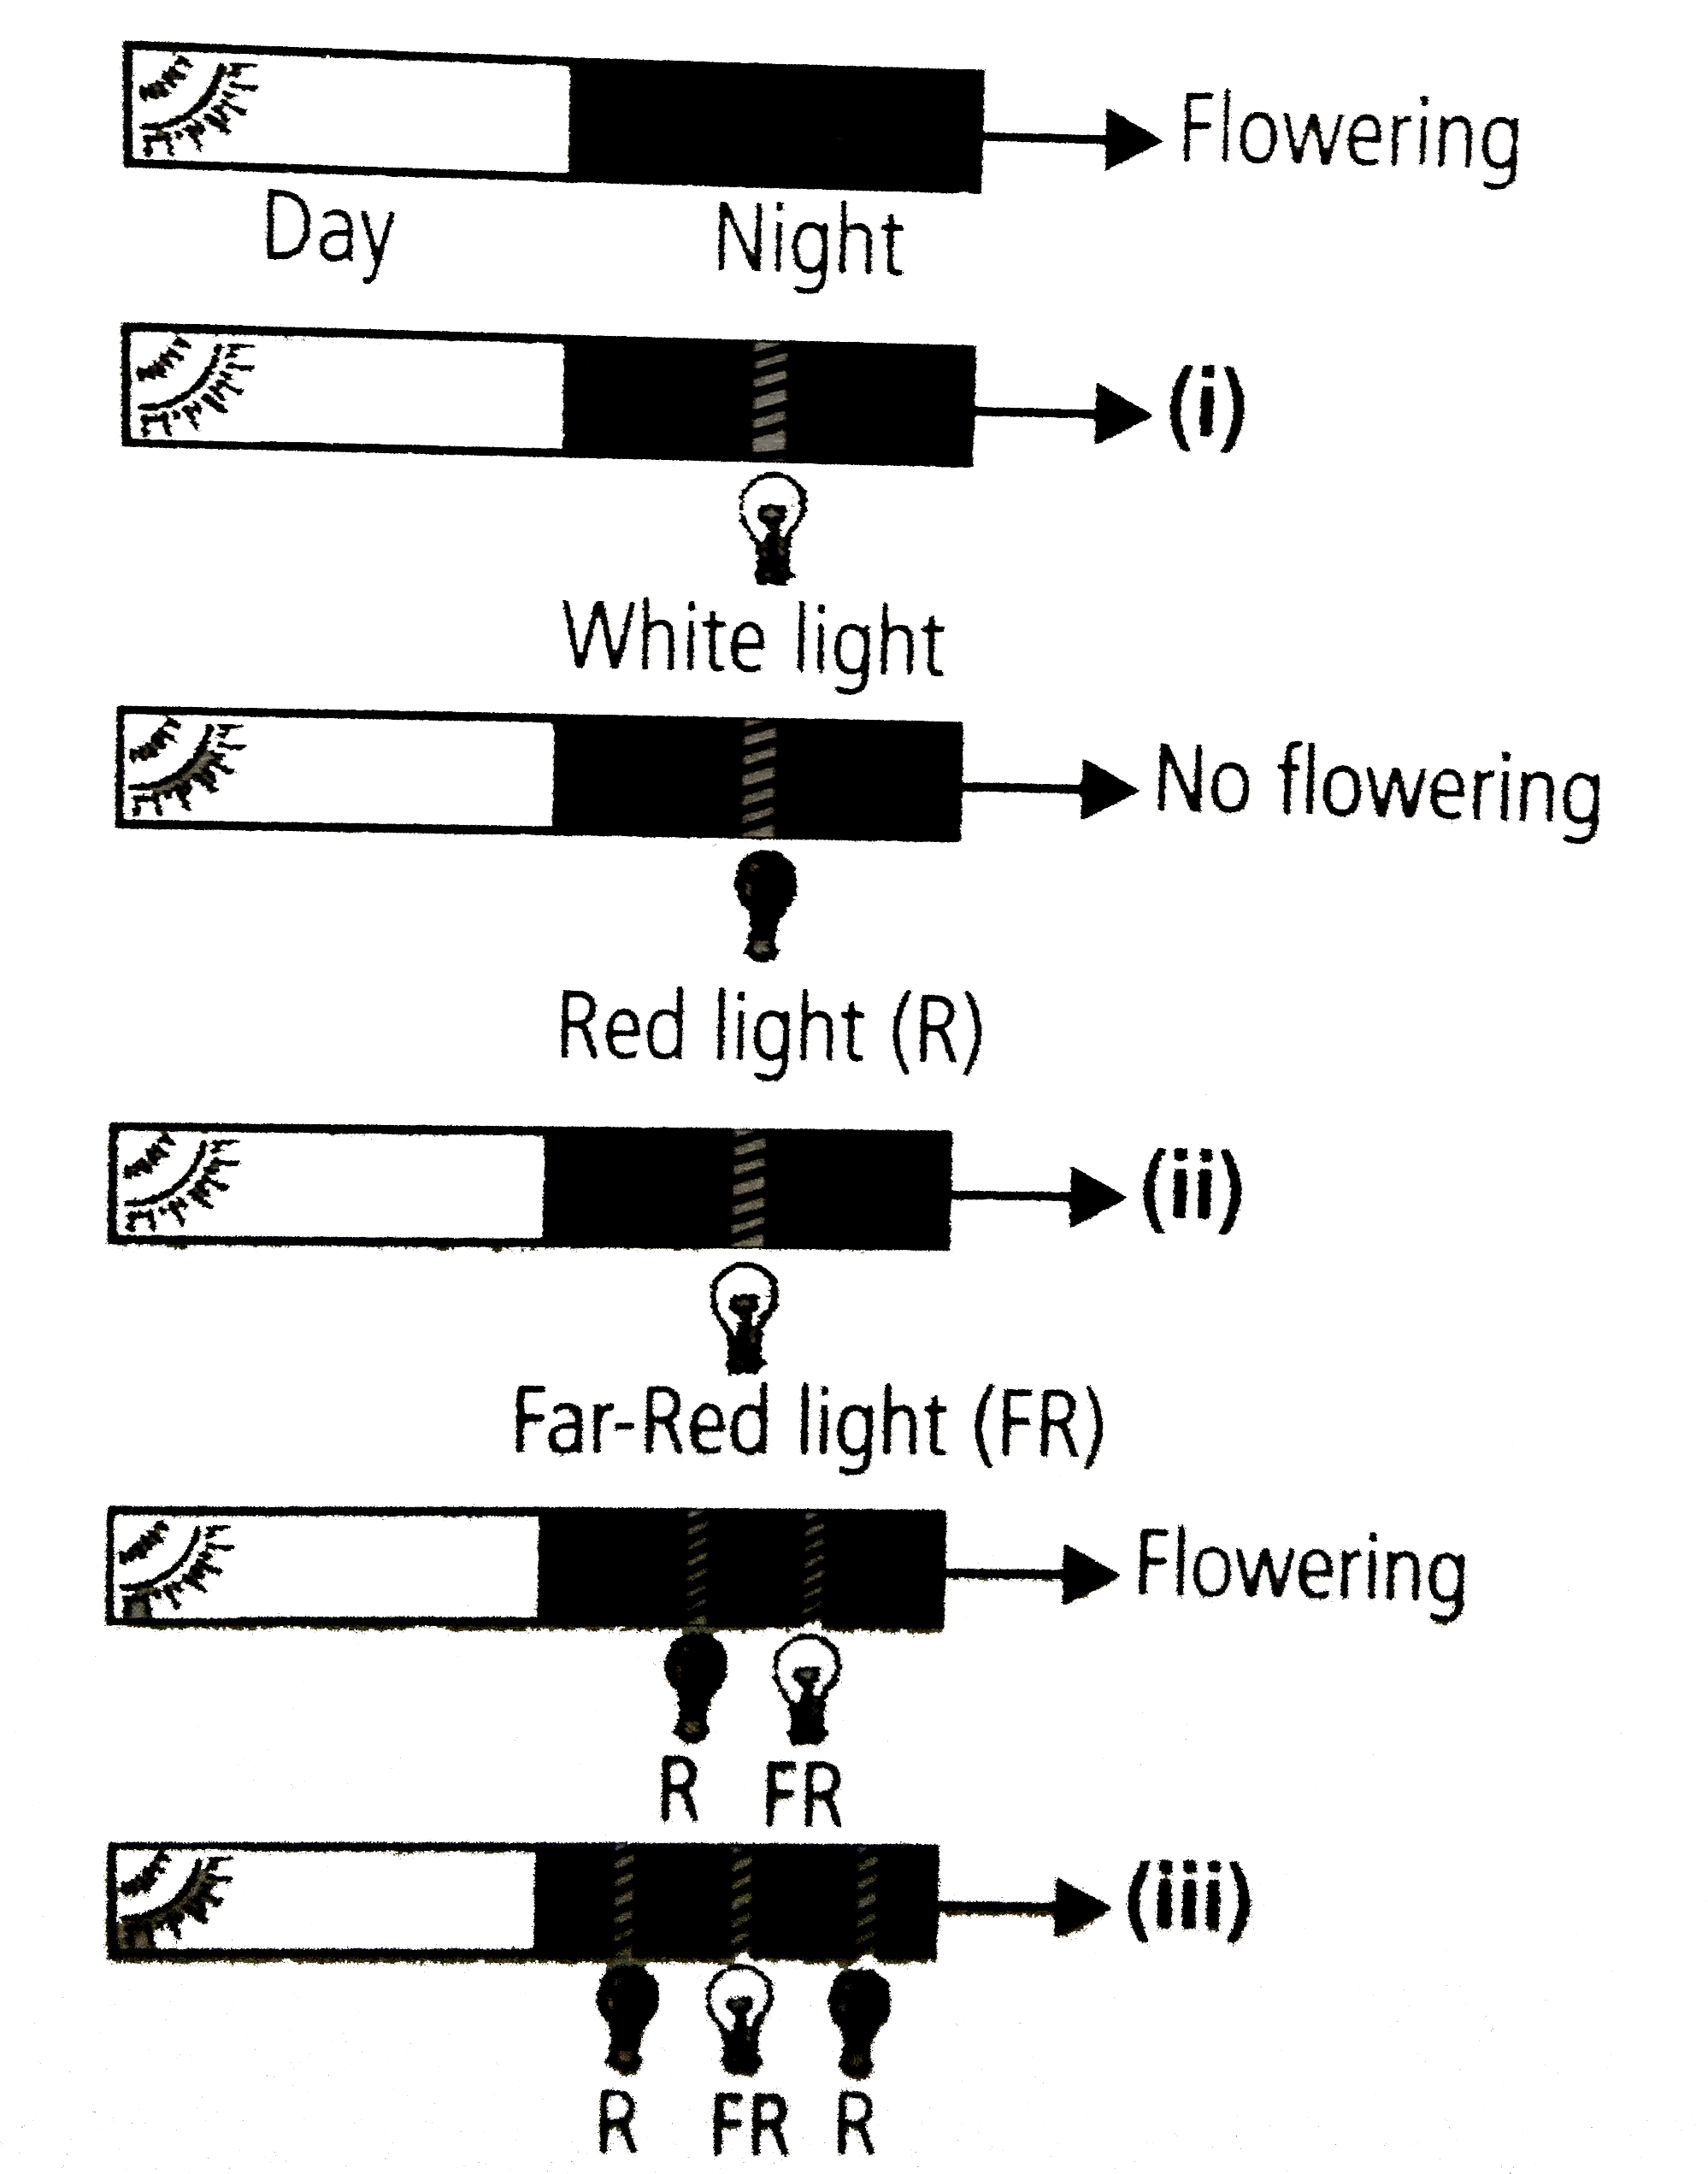
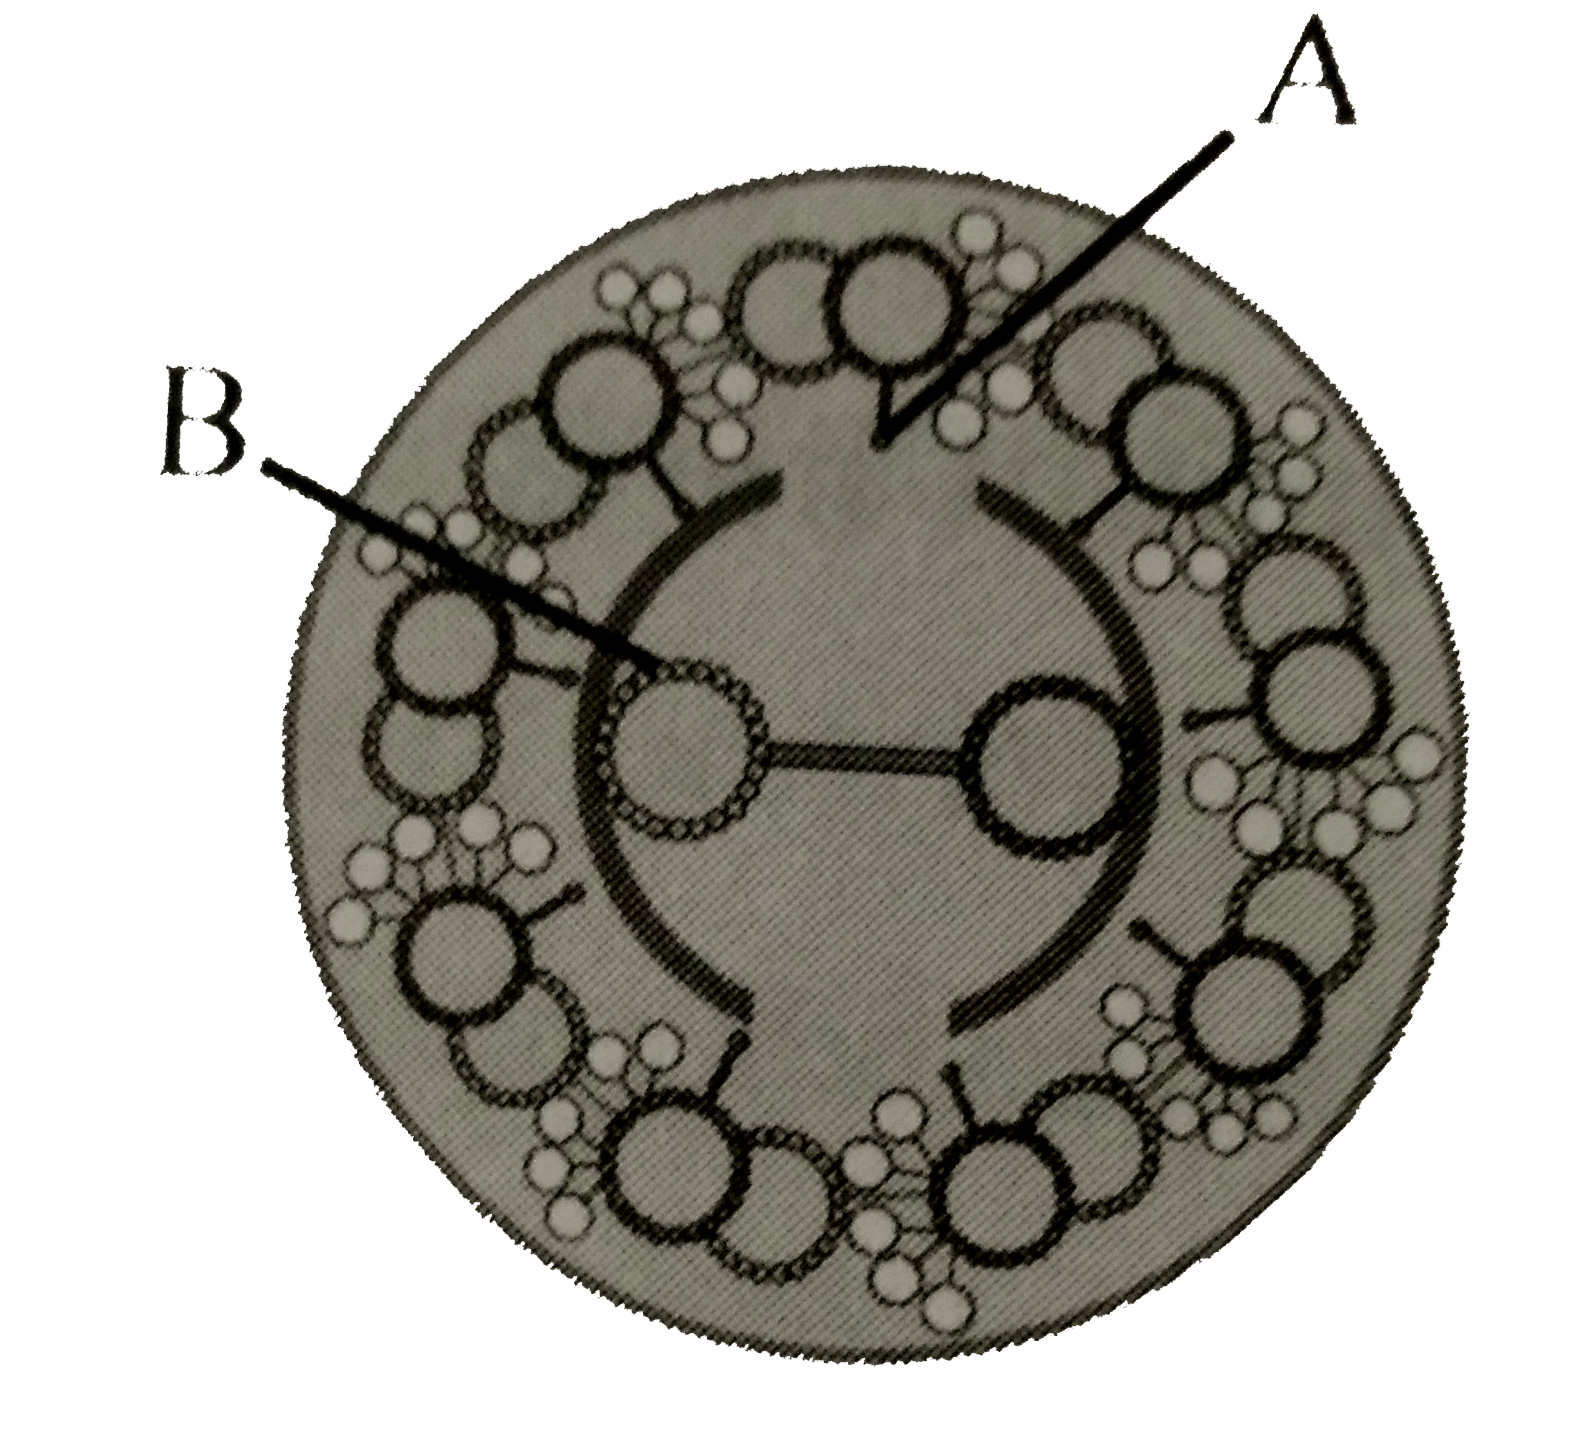
Select the correct option for (i),(ii) and (iii).View SolutionThe figure below shows the section of a cillia/flagella showing different parts labelled A and B select the correct labelled name ?
 View Solution
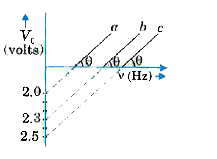
The following graph shows the variation of stopping potential with frequency for three different metals a, b and c . A light wave having wavelength 550 nm is falling on th metal surface a,b,c one by one. Which metal plate with generate photoelectric current?
 View Solution
