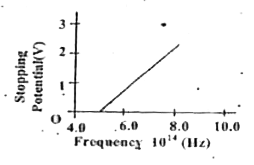
The surface of cesium is illuminated with monochromatic light of various wavelengths and the stopping potential for the wavelength are measured. The results of this experiment is plotted as shown in the figure Estimate the value of work function of the cesium and Planck's constant.
_E01_165_Q01.png)
The correct Answer is:2eV,6.53×10−34J−s
We, have eV0,hcλ−ϕ=hv−ϕ⇒V0=hve−ϕe
from graph, ϕe=2V⇒ϕ=2eV
Also slopes of the graph =20.49×1015=he
⇒h=2×1.6×10−190.49×1015=6.536×10⁻³⁴J/sec
Topper's Solved these Questions
- BOOK - ALLENCHAPTER - SIMPLE HARMONIC MOTIONEXERCISE - Exercise-04 [B]105videos
SIMPLE HARMONIC MOTION
- BOOK - ALLENCHAPTER - SIMPLE HARMONIC MOTIONEXERCISE - Exercise-05(B)46videos
SIMPLE HARMONIC MOTION
- BOOK - ALLENCHAPTER - SIMPLE HARMONIC MOTIONEXERCISE - Exercise - 352videos
SIMPLE HARMONIC MOTION
- BOOK - ALLENCHAPTER - RACEEXERCISE - Basic Maths (Wave Motion & Dopplers Effect) (Stationary waves & doppler effect, beats)25videos
RACE
- BOOK - ALLENCHAPTER - TEST PAPEREXERCISE - PHYSICS4videos
TEST PAPER
Similar Questions
When a metallic surface is illuminated with monochromatic light of wavelength X, the stopping potential is 5Vq. When the same surface is illuminated with light of wavelength 3X, the stopping potential is Then the work function of the metallic surface is
View SolutionWhen a metallic surface is illuminated with monochromatic light of wavelength λ, the stopping potential is 5V0 . When the same surface is illuminated with light of wavelength 3λ, the stopping potential is V0. If work function of the metallic surface is
View Solution
Knowledge Check
- Question 1 - Select One
When a metallic surface is illuminated with monochromatic light of wavelength λ, the stopping potential is 5V0. When the same surface is illuminated with the light of wavelength 3λ, the stopping potential is V0. Then, the work function of the metallic surface is
Ahc/6λBhc/5λChc/4λD2hc/4λ - Question 2 - Select One
When a metallic surface is illuminated with monochromatic light of wavelength λ, the stopping potential is 5V0. When the same surface is illuminated with light of wavelength 3λ, the stopping potential is V0. Then the work function of the metallic surface is:
Ahc6λBhc5λChc4λD2hc4λ - Question 3 - Select One
The stopping potential vs frequency plot for a substance is shown in the figure. The work function of the substance is
 A3.331 eVB4.02 eVC2.07 eVD3.02e V
When a metal is illuminated by light of wavelength λ , the stopping potential is V∘ and for wavelength 2λ, it is 3V∘.Then the threshold wavelength is ?
View SolutionWhen a metallic surface is illuminated with monochromatic light of wavelength λ ,the stopping potential is 5V0 .When the same surface is illuminated with light of wavelength 3λ ,the stopping potential is V0 .The work function of the metallic surface is hcnλ .Find n?
View SolutionWhen a metallic surface is illuminated with monochromatic light of wavelength λ, the stopping potential is 5V0. When the same surface is illuminated with light of wavelength 3λ, the stopping potential is V0. The work function of the metallic surface is hckλ. Find k.
View SolutionA certain metallic surface is illuminated with monochromatic light of wavelength λ. The stopping potential for photoelectric current for this light is 3V0. If the same surface is illuminated with light of wavelength 2λ, the stopping potential is V0∘ The threshold wavelength for this surface for photoelectric effect is yλ. Find y.
View SolutionA certain metallic surface is illuminated with monochromatic light of wavelength λ . The stopping potential for photoelectric current for this light is 3V0 . If the same surface is illuminated with light of wavelength 2λ , the stopping potential is V0 . The threshold wavelength for this surface for photoelectric effect is
View Solution
