The figure given below shows estimated values for carbon fixation in a terrestrial ecosystem. Diagram refer to tones X 109, fixed or available for fixation

Which result can be drawn from the figure
There is a net loss to the decomposers
There is a net loss to the atmosphere
The system is in balance
There is an net gain to the producers
The correct Answer is:C
Topper's Solved these Questions
Similar Questions
Knowledge Check
The diagram shows estimated values for carbon fixation in a terrestrial ecosystem. Figures refer to tonnes x 109 , fixed or available for fixation.
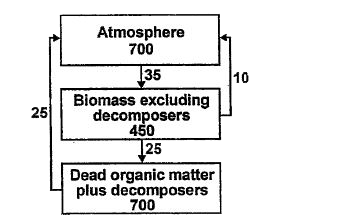
Which conclusion can be drawn from the diagram?AThere is a net gain to the producers.BThe system is in balance.CThere is a net loss to. the atmosphere.DThere is a net loss to the decomposers.The pH values of many common liquids are given in the table below.
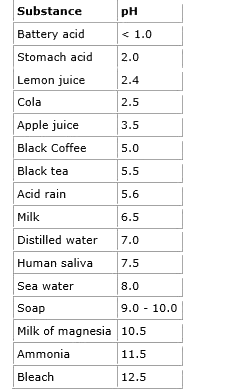
Study the table and answer the questions that follow.
Which of these is a valid conclusion that can be drawn from the table?AMany common food items are quite acidic in nature.BOur stomach contains a liquid which is a weak acid.CSea water is neither acidic nor basic - it is neutral.DAcid rain, in spite of its name, is basic in nature.The figure below shows pressure variation in two different sound waves in air with time at a given position. Both the figures are drawn to the same scale.
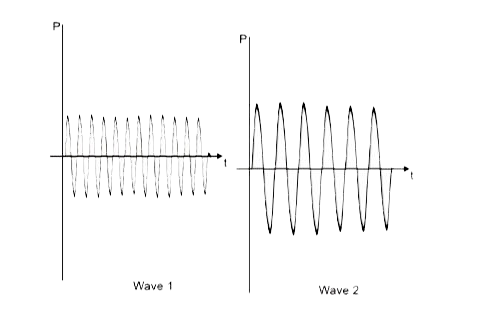
Which of the following statement is true ?AWave 1 has lower frequency and smaller amplitude compared to waveBWave 1 has higher frequency and greater amplitude compared to wave 2CWave 1 has shroter wavelength and greater amplitude compared to wave 2DWave 1 has shorter wavelength and smaller amplitude compared to wave 2
The figure given below shows the magnetic field between two magnets :
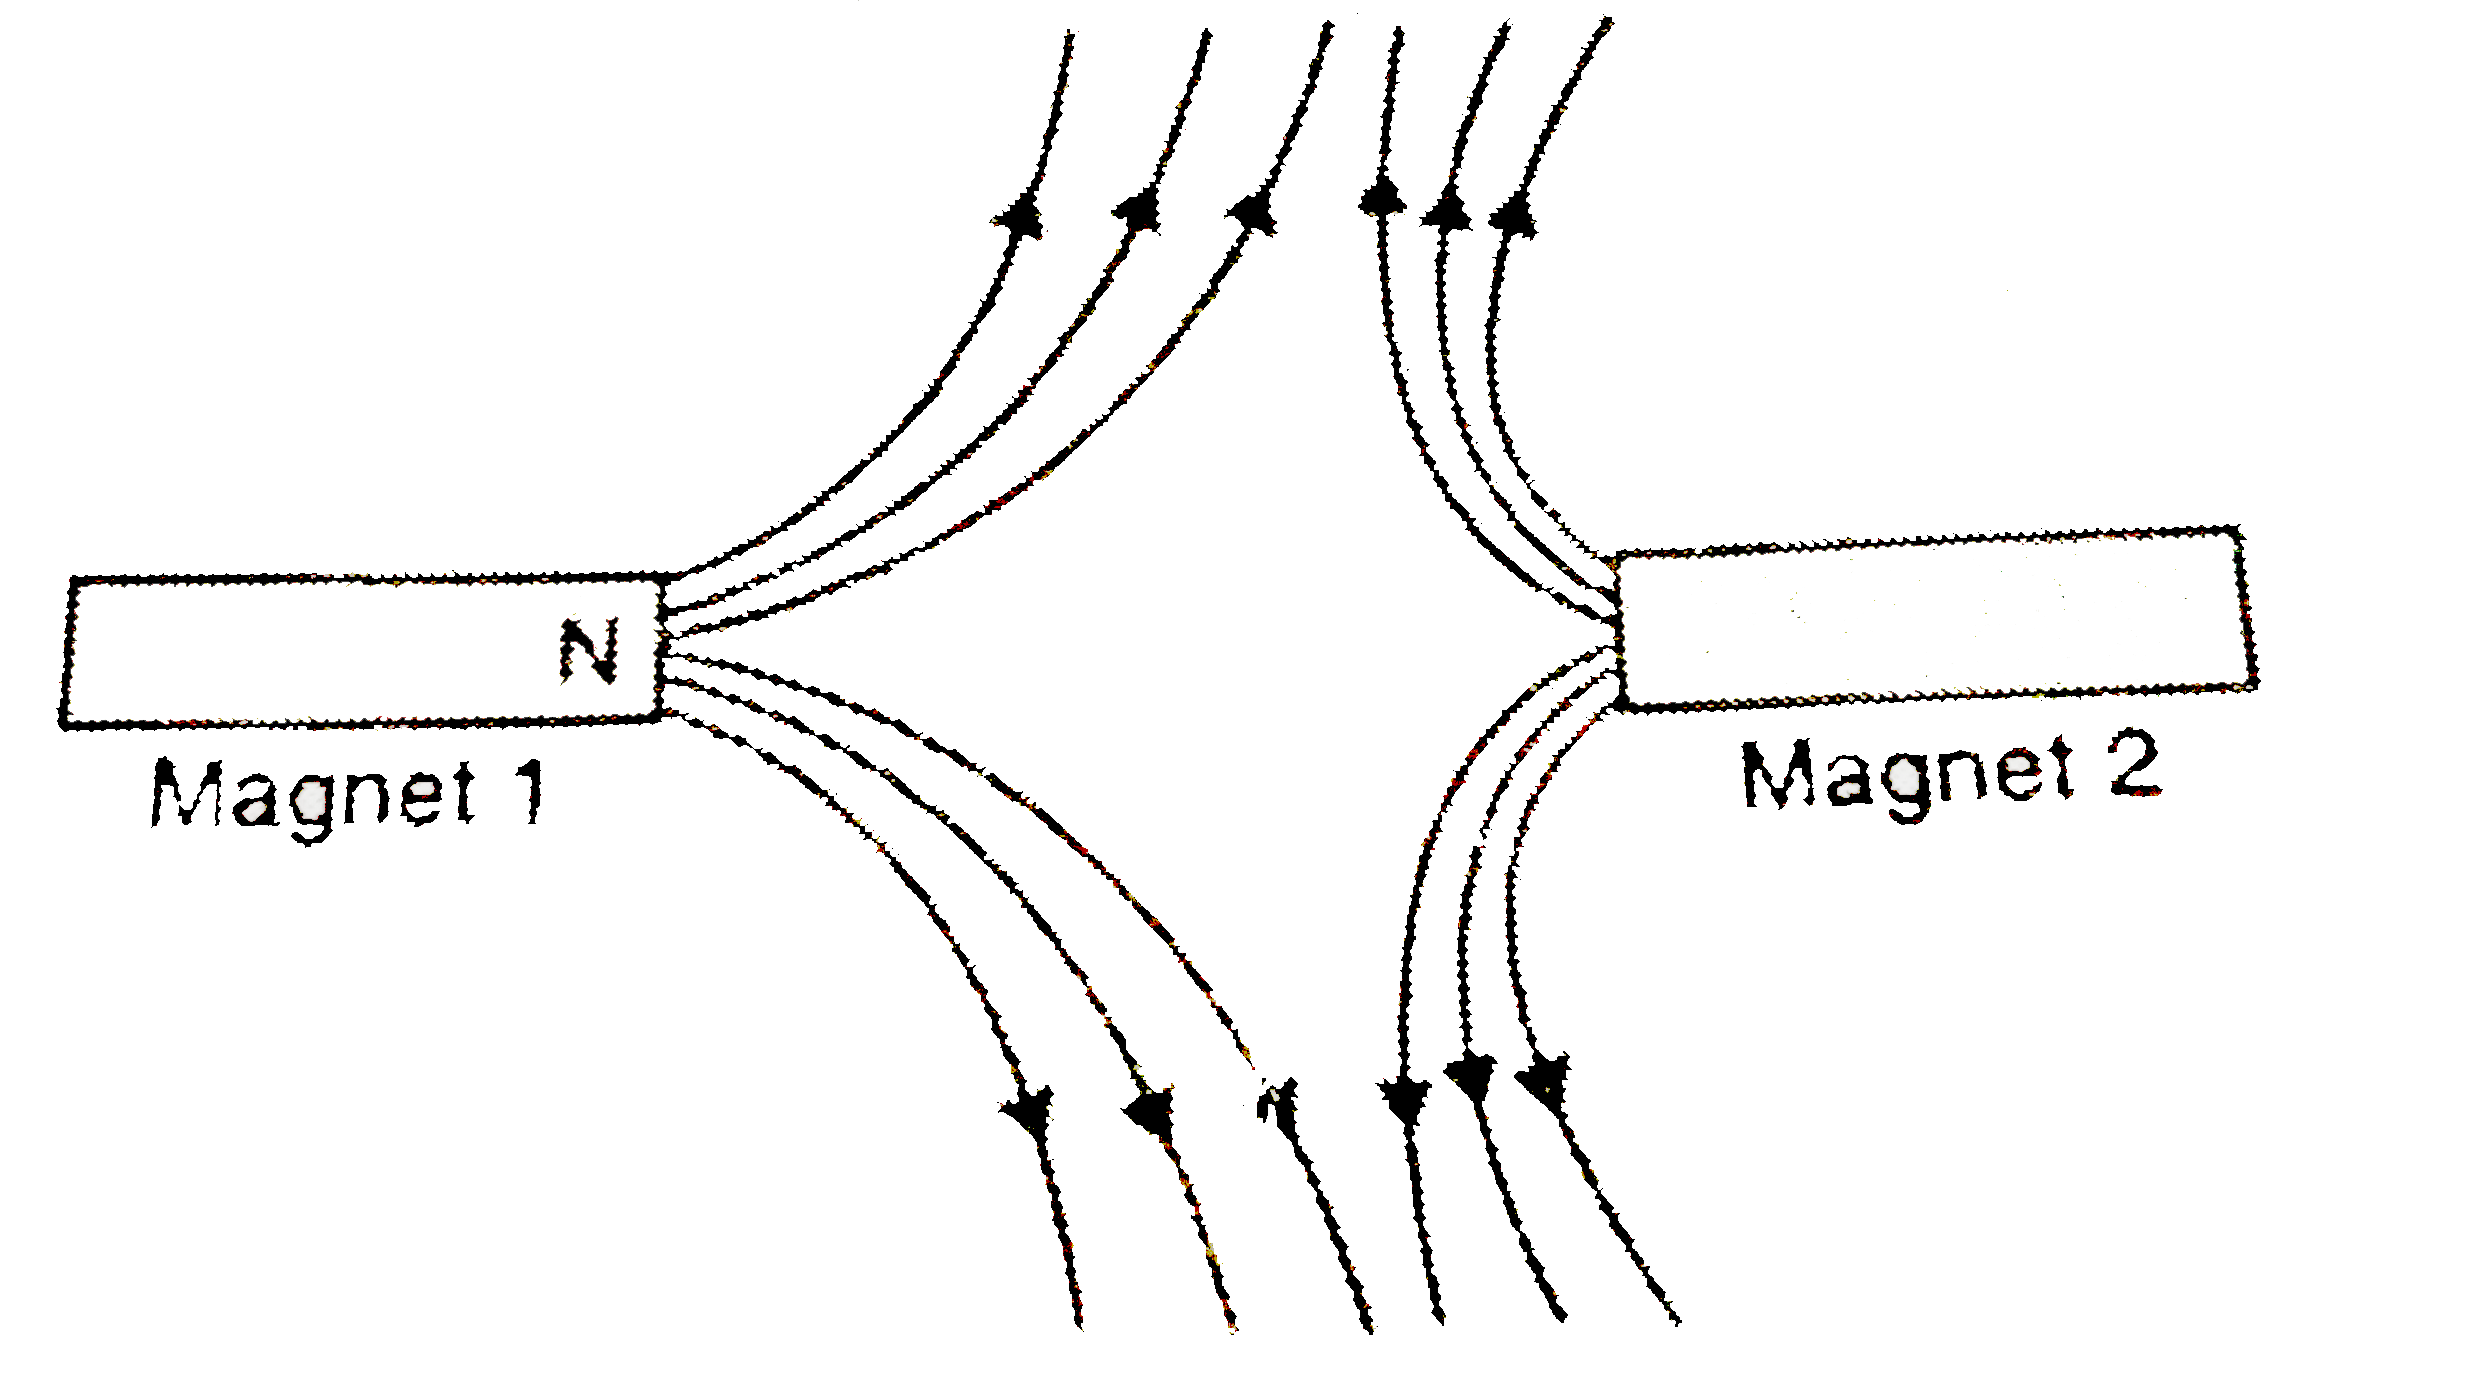
(i) Copy the diagram and label the other poles of the magnets.
(ii) Which is the weaker magnet ?
View SolutionAmong the four answer figures ,Which can be formed from the cut-pieces given below?
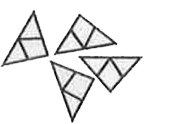
View SolutionFind the value of 'x' and 'y' from the figure given below
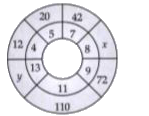
View SolutionAmong the four answer figures, which can be formed from the cut-pieces given below?
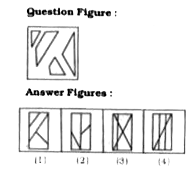
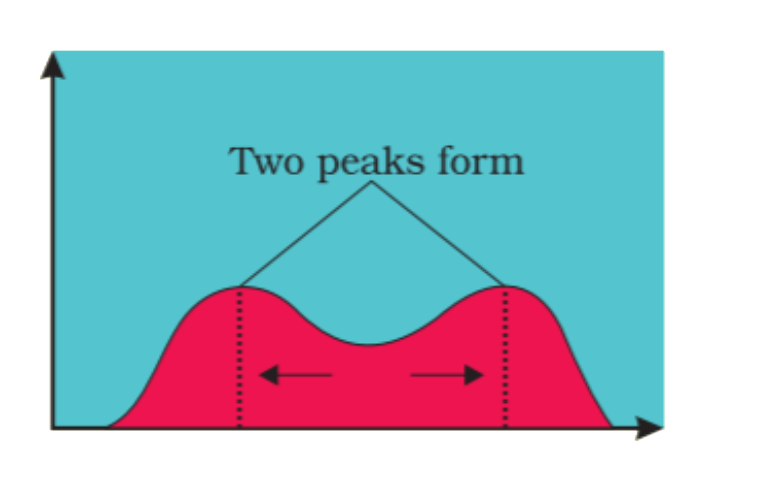
View SolutionIn the diagram, the x-axis denotes the number of individuals with a certain phenotype. The dotted lines denote the phenotypes favoured by natural selection. Which of the following inferences can be drawn from the given diagram?
View Solution

