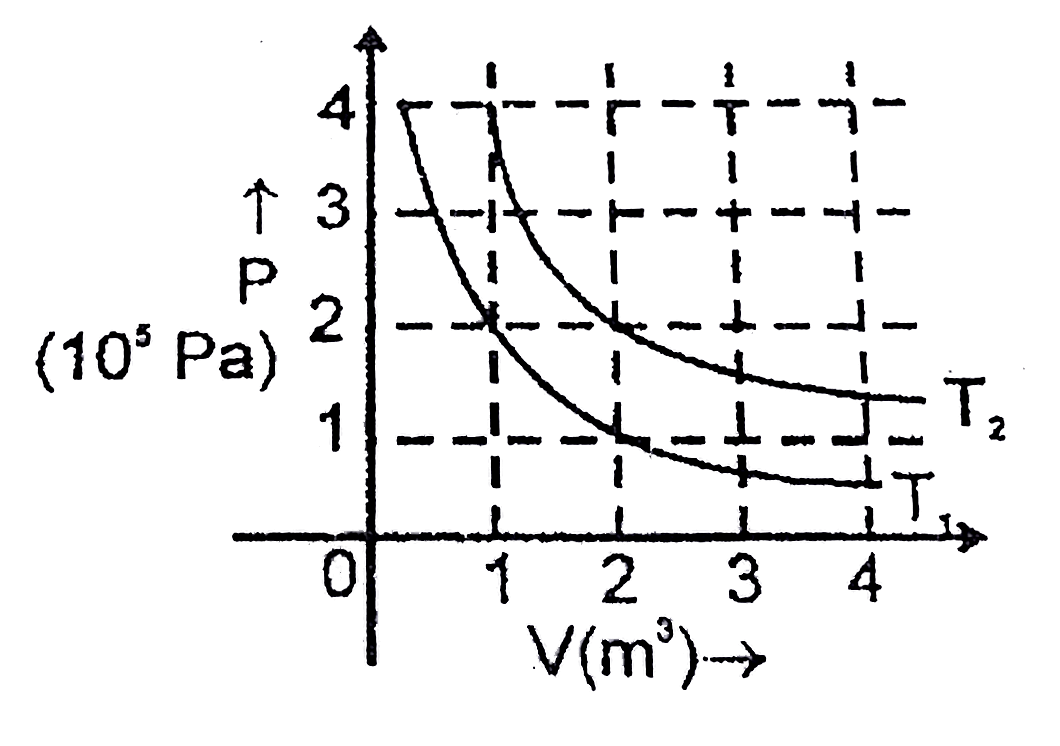
Following graph is constucted for the fixed amount of the gas
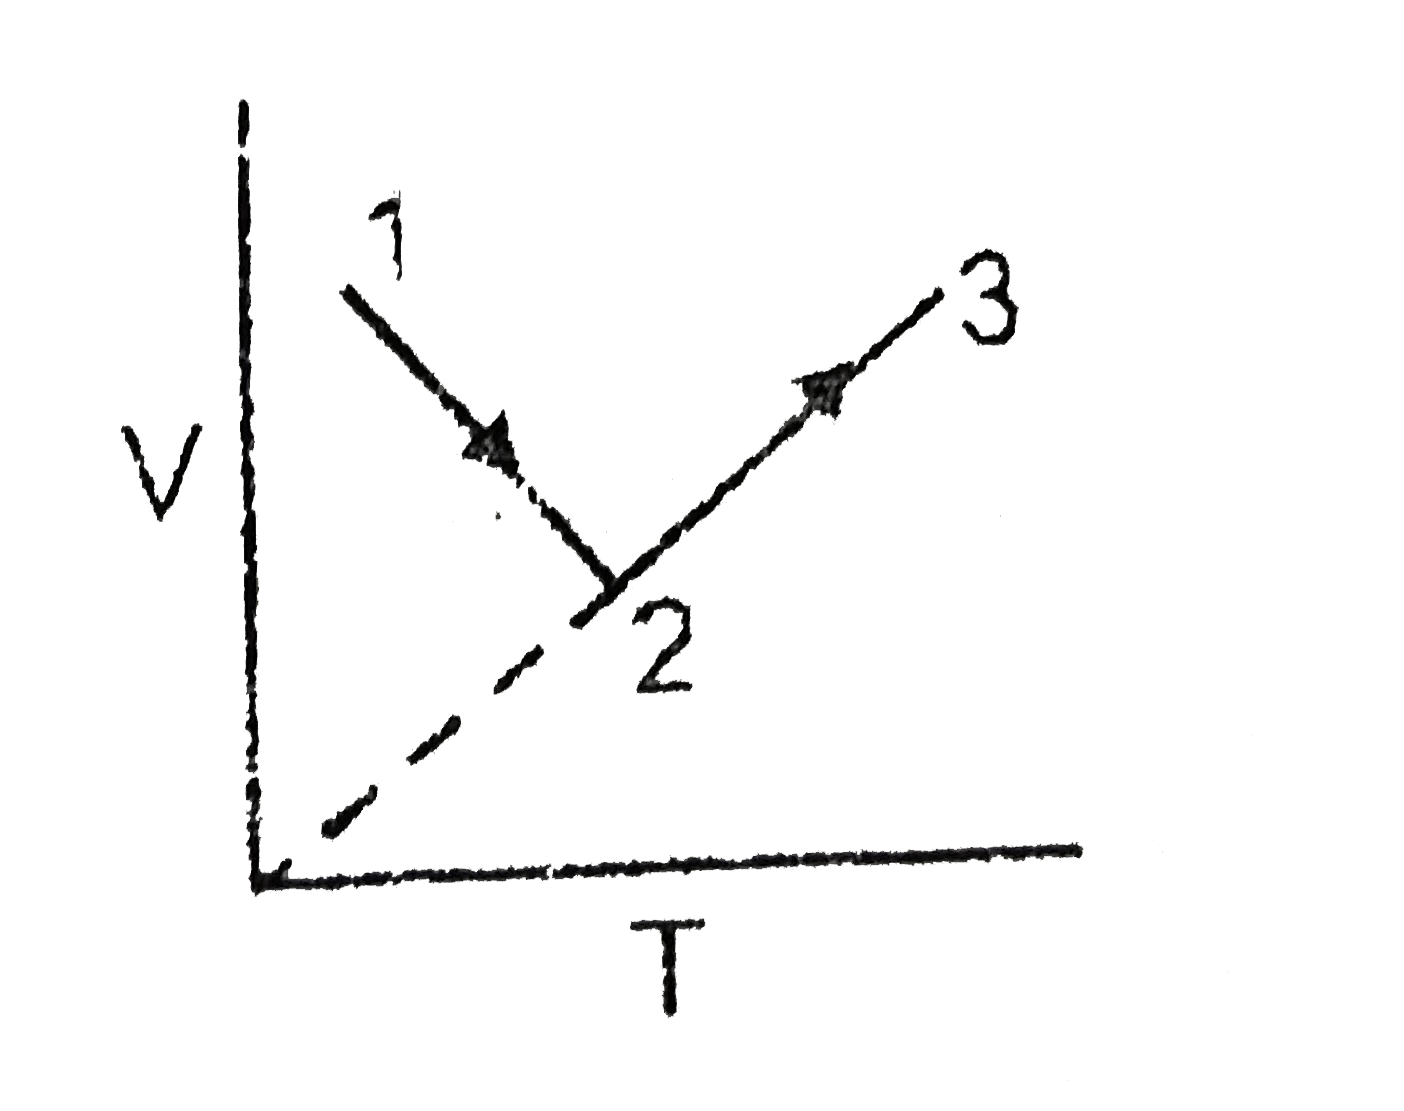
A
From 1-2 pressure will increase
B
From 2-3 pressure remains constant
C
Gas pressure at (3) is greater at state (1)
D
Form 1-2 pressure will decrease
Video Solution
Text Solution
The correct Answer is:A,B,C
V-T curve for a given mass of the gas is given
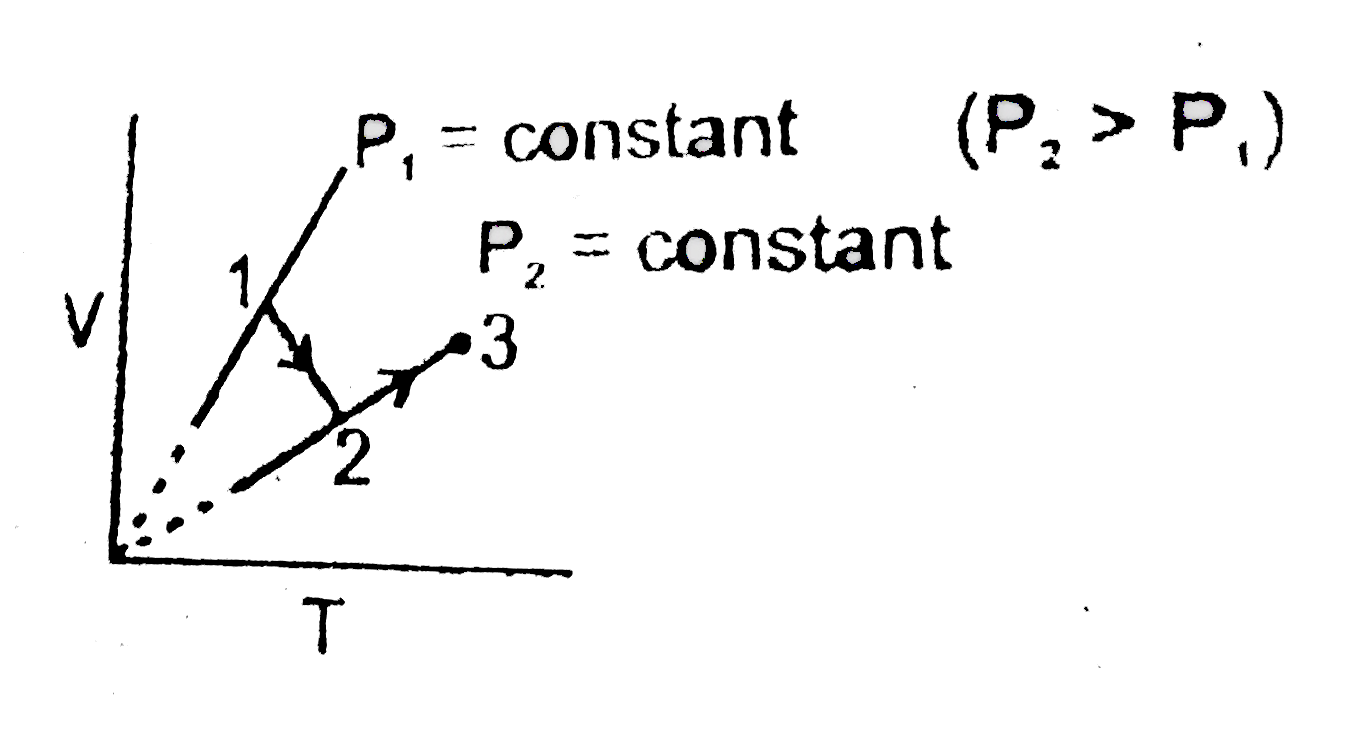
PV=nRT,V=(nRP)T
|
Topper's Solved these Questions
Similar Questions
Knowledge Check
When a sample of ideal gas is changed from an initial state to a final state, various curves can be plotted for the process like P-V curve, V-T curve,P-T curve etc.
For example, P-V curve for a fixed amount of an ideal gas at constant temperature is a rectangular hyperbola, V-T curve for a fixed amount of an ideal gas at constant volume is again a straight line. However, the shapes may vary if the constant parameters are also changed.
Now, answer the following questions :
Which of the following graphs is not possible for a fixed amount of ideal gas upon moving from initial state A to final state B :A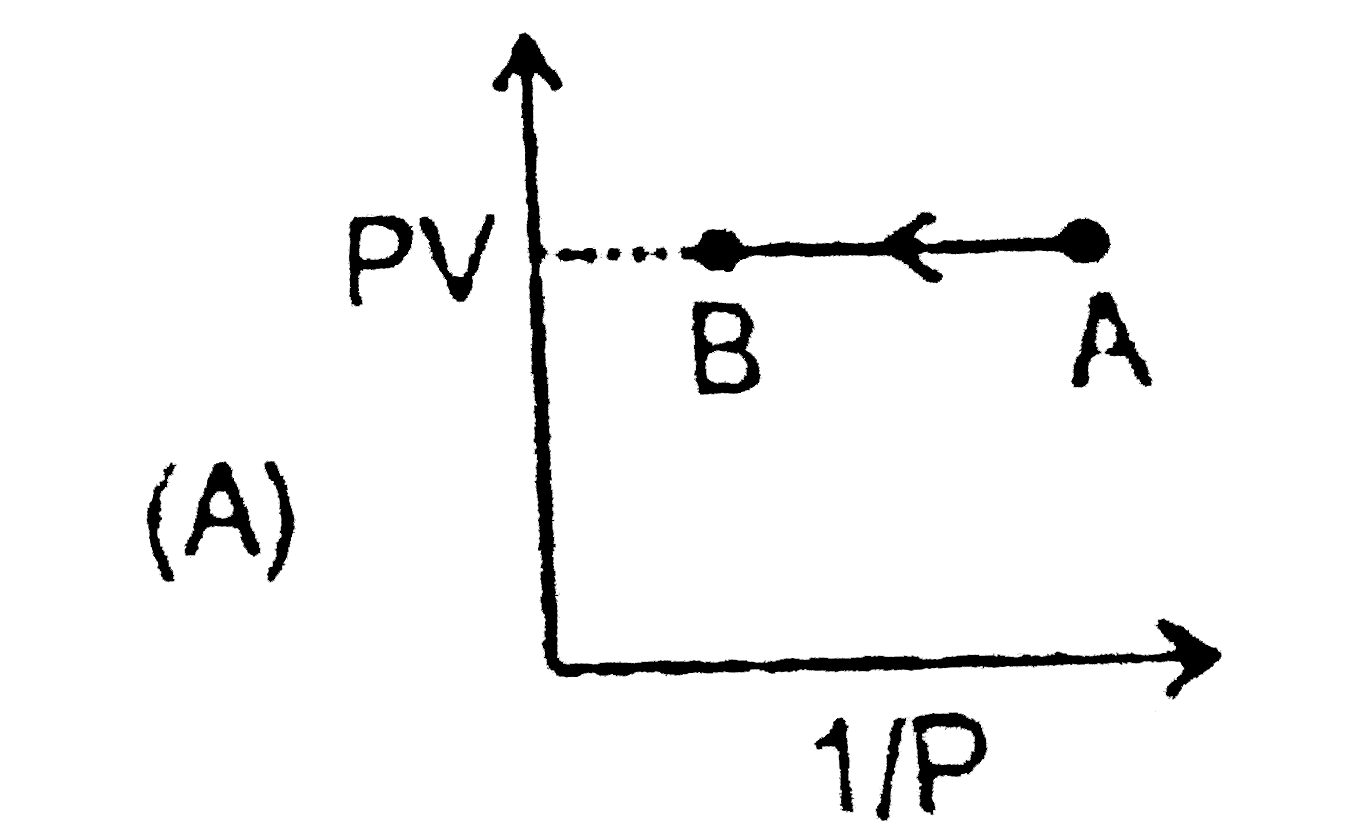 B
B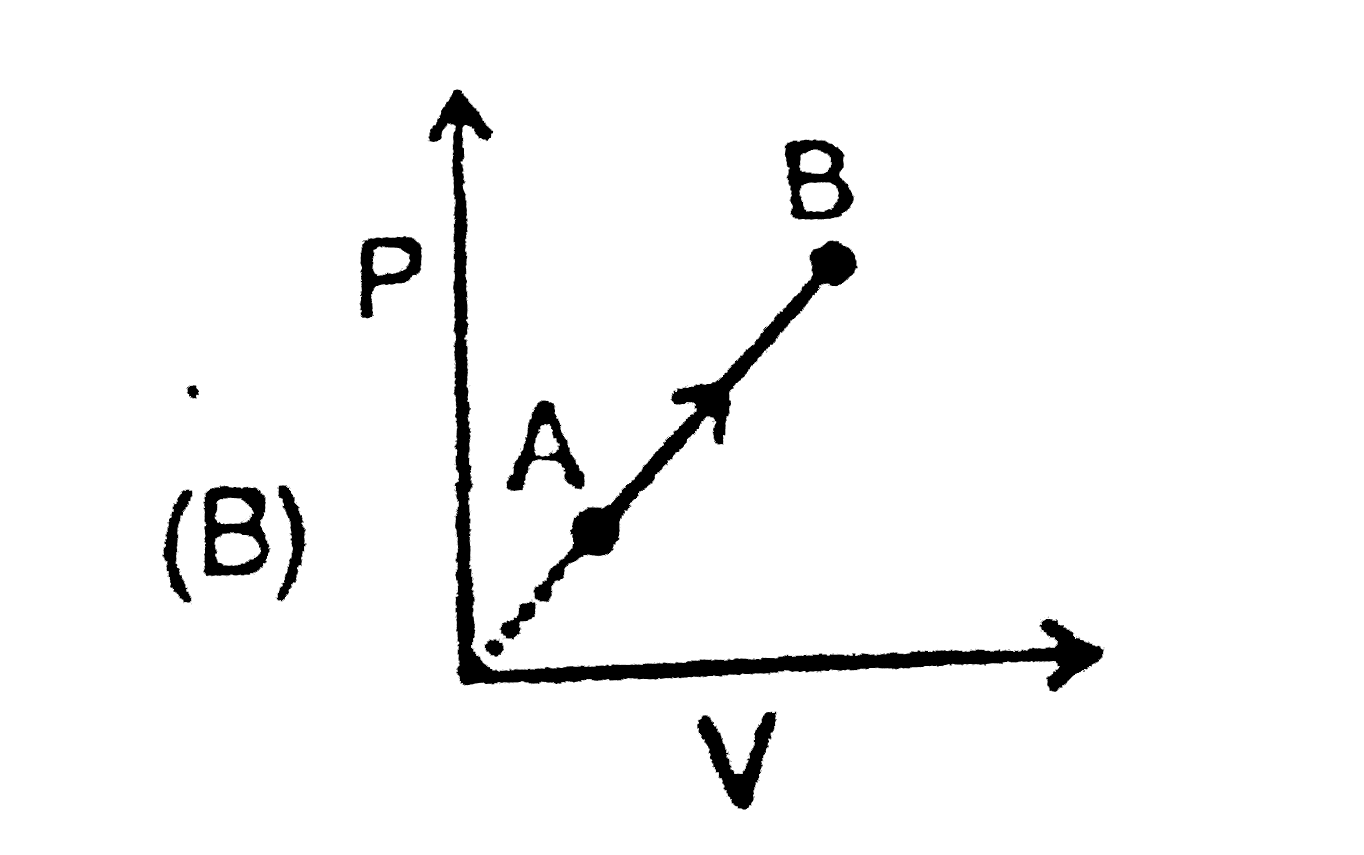 C
C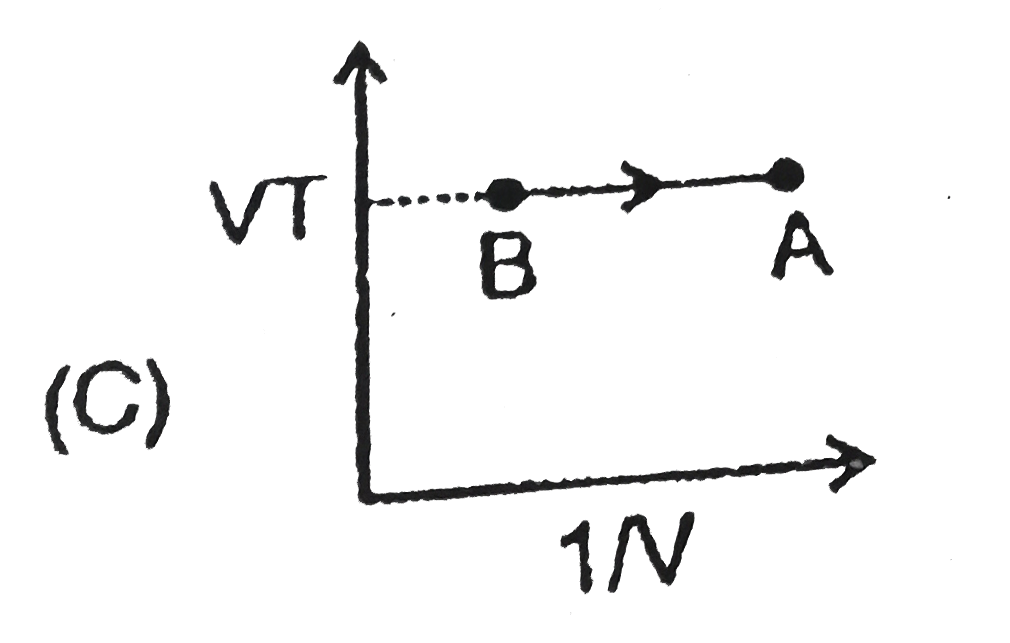 DNone of these
Which of the following graph is parabolic for fixed mass of an ideal gas at constant temperature in closed container ?
A1V2 us PBPV us PCPV us VDPV us log VWhich of the following curve is correct for a given amount of an ideal gas at constant pressure?
A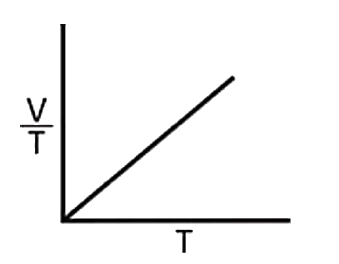 B
B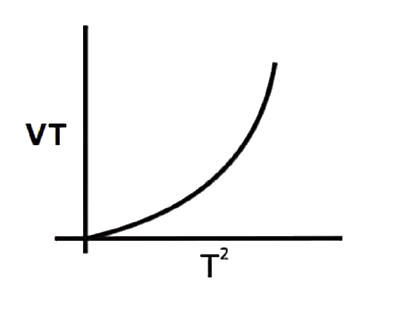 C
C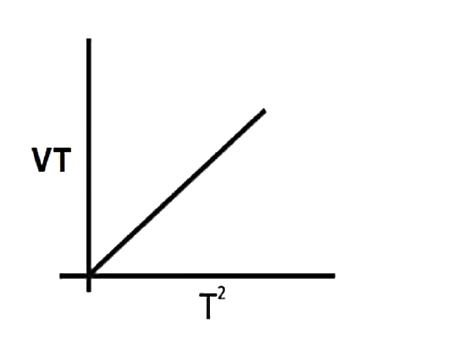 D
D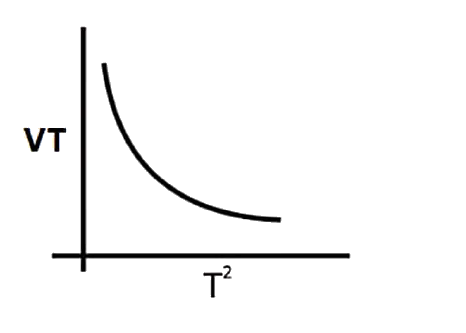
Which of the following curve is incorrect for given amount of an ideal gas at constant temperature ?
View SolutionWhich of the following is a correct plot of the volume of fixed amount of ideal gas as a function of temperature (at constant pressure)
View SolutionWhich of the following graph represents the variation of amount of chemisorption of a gas by a solid with temperature under constant pressure?
View SolutionWhich of the following graphs is not a straight line for an ideal gas ?
View SolutionWhich of the following graphs is consistent with ideal gas behaviour?
View Solution

