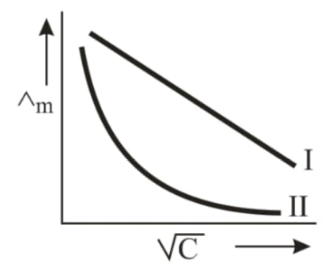
Above plot represents the variation of molar conductance against (where C = molar concentration of the electrolyte) . Select the correct option among following .
Both I and II are for strong electrolyte
Both I and II are for weak electrolyte
I is for strong electroyte and II for weak electrolyte
I is for weak electrolyte and II for strong electrolyte
The correct Answer is:C
Step by step video & image solution for Above plot represents the variation of molar conductance against sqrtC (where C = molar concentration of the electrolyte) . Select the correct option among following . by Chemistry experts to help you in doubts & scoring excellent marks in Class 12 exams.
Updated on:21/07/2023Topper's Solved these Questions
Similar Questions
Knowledge Check
Consider the statements S1 and S2:
S1: Conductivity always increases with decrease in the concentration of electrolyte.
S2: Molar conductivity always increases with decrease in the concentration of electrolyte.
The correct option among the following is:ABoth S1 and S2 are wrongBS1 is correct and S2 is wrongCS1 is wrong and S2 is correctDBoth S1 and S2 are correctConsider the statements S1 and S2:
S1: Conductivity always increases with decrease in the concentration of electrolyte.
S2: Molar conductivity always increases with decrease in the concentration of electrolyte.
The correct option among the following is:ABoth S1 and S2 are wrongBS1 is correct and S2 is wrongCS1 is wrong and S2 is correctDBoth S1 and S2 are correctConsider the statements S1 and S2.
S1: Conductivity always increase with decrease in the concentration of electrolyte
S2: Molar conductivity always increases with decrease in the concentration of clectrolyte. The correct option among the following is:ABoth S1 and S2 are wrongBS1 is correct and S2 is wrongCS1 is wrong and S2 is correctDBoth S1 and S2 are correct.
Which of the following plots represents correctly the variation of molar conductivity with dilution for a strong electrolyte?
View SolutionWhich of the following plots represents correctly the variation of conductivity with concentration?
View SolutionThe plot of molar conductance vs √C in strong electrolyte , is
View SolutionWhich of the following graph correctly represents the variation of molar conductance (Δm) with dilution for a strong electrolyte ?
View SolutionFor strong electrolytes, the plot or molar conductance versus √C is:
View Solution