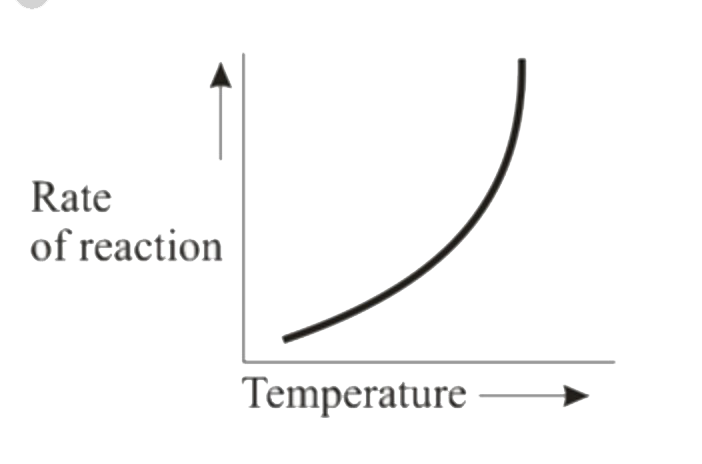
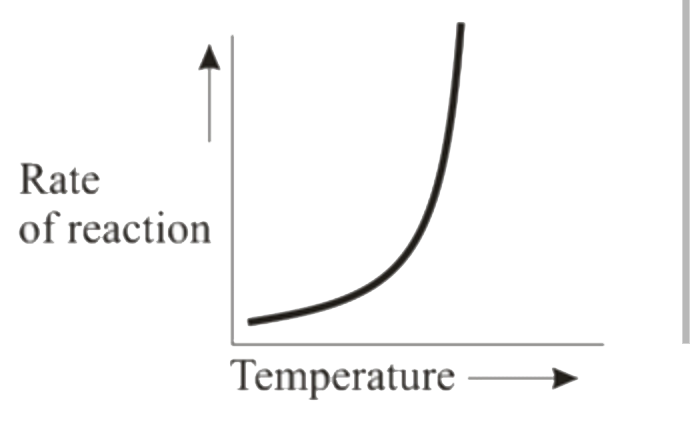
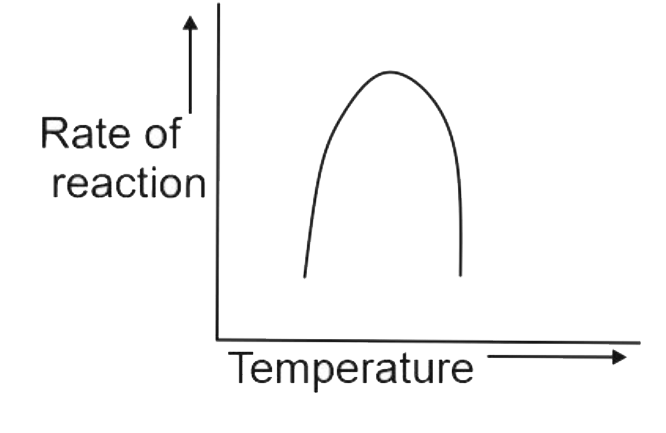
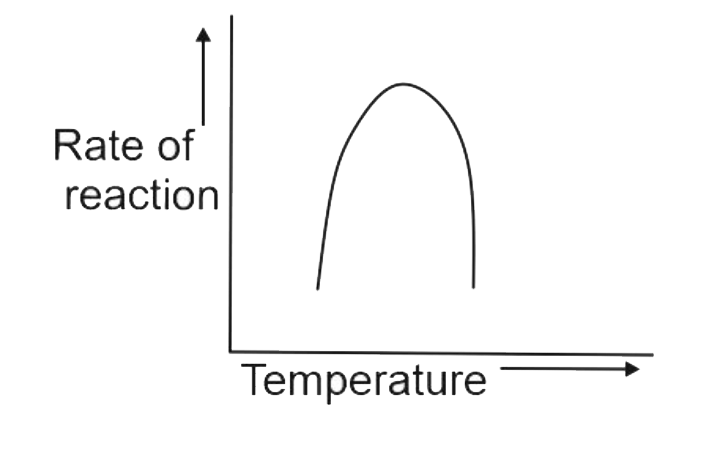
Which of the following graph is correct for the enzyme catalysis ?
The correct Answer is:C
To determine which graph correctly represents enzyme catalysis in relation to temperature, we can analyze the relationship between the rate of enzyme activity and temperature step by step.
1. Understanding Enzyme Activity: Enzymes are biological catalysts that speed up chemical reactions. Their activity is influenced by various factors, including temperature.
2. Effect of Temperature on Enzyme Activity:
- As temperature increases, the kinetic energy of molecules increases, leading to more frequent collisions between enzymes and substrates. This typically results in an increase in the rate of reaction.
- However, this increase in activity only continues up to a certain temperature.
3. Optimal Temperature:
- Each enzyme has an optimal temperature at which it functions most efficiently. For many enzymes, this optimal temperature is around 37-45 degrees Celsius.
4. Denaturation of Enzymes:
- Beyond the optimal temperature, enzymes begin to denature. Denaturation is a process where the enzyme's structure is altered, leading to a loss of function.
- As the temperature continues to rise past the optimal point (in this case, around 45 degrees Celsius), the rate of reaction will start to decrease.
5. Graph Interpretation:
- The correct graph should show an increase in the rate of reaction with temperature up to the optimal point, followed by a decrease in the rate as temperature continues to rise beyond that point.
6. Identifying the Correct Graph:
- Among the provided options, the graph that shows an initial increase in the rate of reaction with temperature, reaching a peak, and then declining after the optimal temperature is the correct representation of enzyme catalysis.
Conclusion:
Based on the analysis, the correct graph for enzyme catalysis in relation to temperature is Option 3, which illustrates the increase in reaction rate up to the optimal temperature followed by a decrease due to enzyme denaturation.
- As temperature increases, the kinetic energy of molecules increases, leading to more frequent collisions between enzymes and substrates. This typically results in an increase in the rate of reaction.
- However, this increase in activity only continues up to a certain temperature.
- Each enzyme has an optimal temperature at which it functions most efficiently. For many enzymes, this optimal temperature is around 37-45 degrees Celsius.
- Beyond the optimal temperature, enzymes begin to denature. Denaturation is a process where the enzyme's structure is altered, leading to a loss of function.
- As the temperature continues to rise past the optimal point (in this case, around 45 degrees Celsius), the rate of reaction will start to decrease.
- The correct graph should show an increase in the rate of reaction with temperature up to the optimal point, followed by a decrease in the rate as temperature continues to rise beyond that point.
- Among the provided options, the graph that shows an initial increase in the rate of reaction with temperature, reaching a peak, and then declining after the optimal temperature is the correct representation of enzyme catalysis.
Based on the analysis, the correct graph for enzyme catalysis in relation to temperature is Option 3, which illustrates the increase in reaction rate up to the optimal temperature followed by a decrease due to enzyme denaturation.
Topper's Solved these Questions
Similar Questions
Knowledge Check
Which of the following graphs are correct ?
A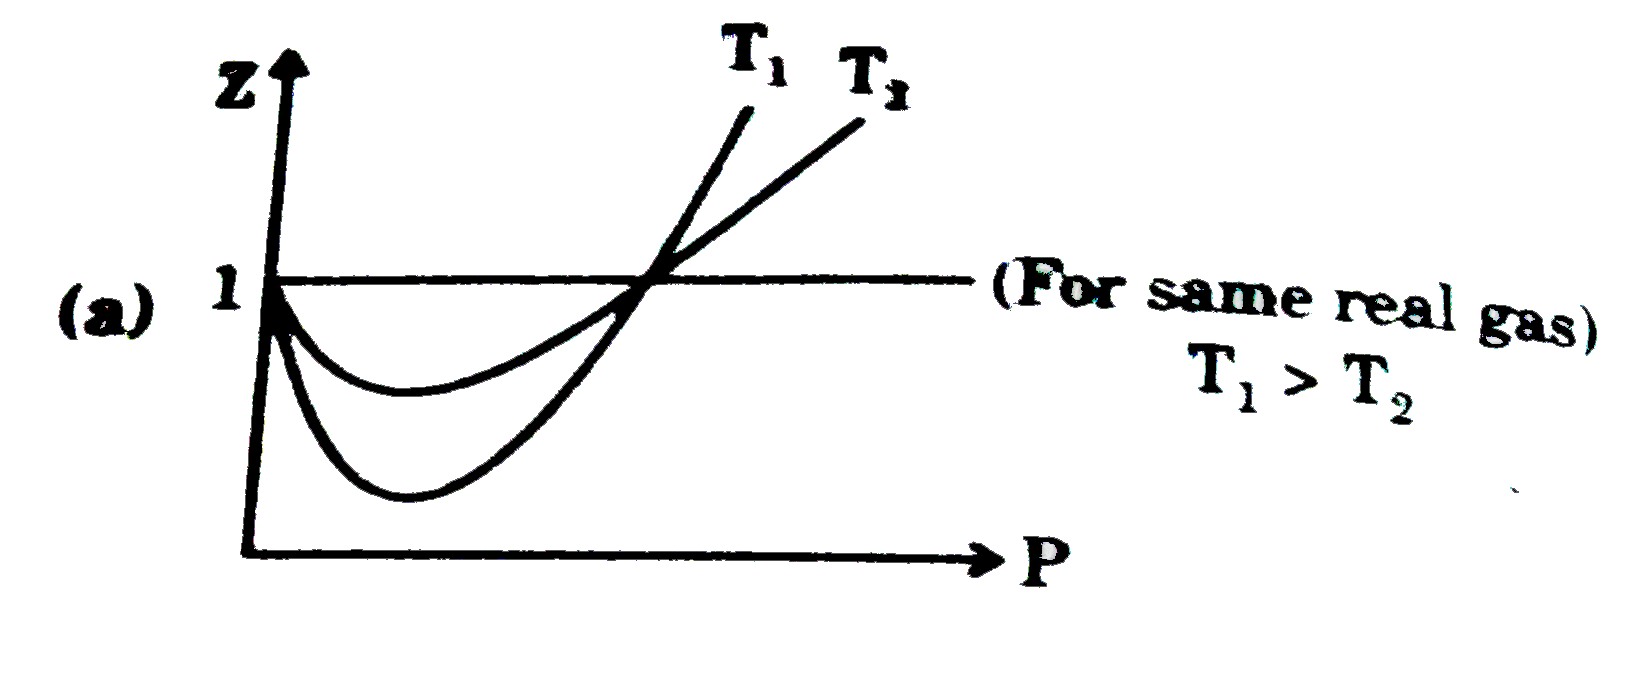 B
B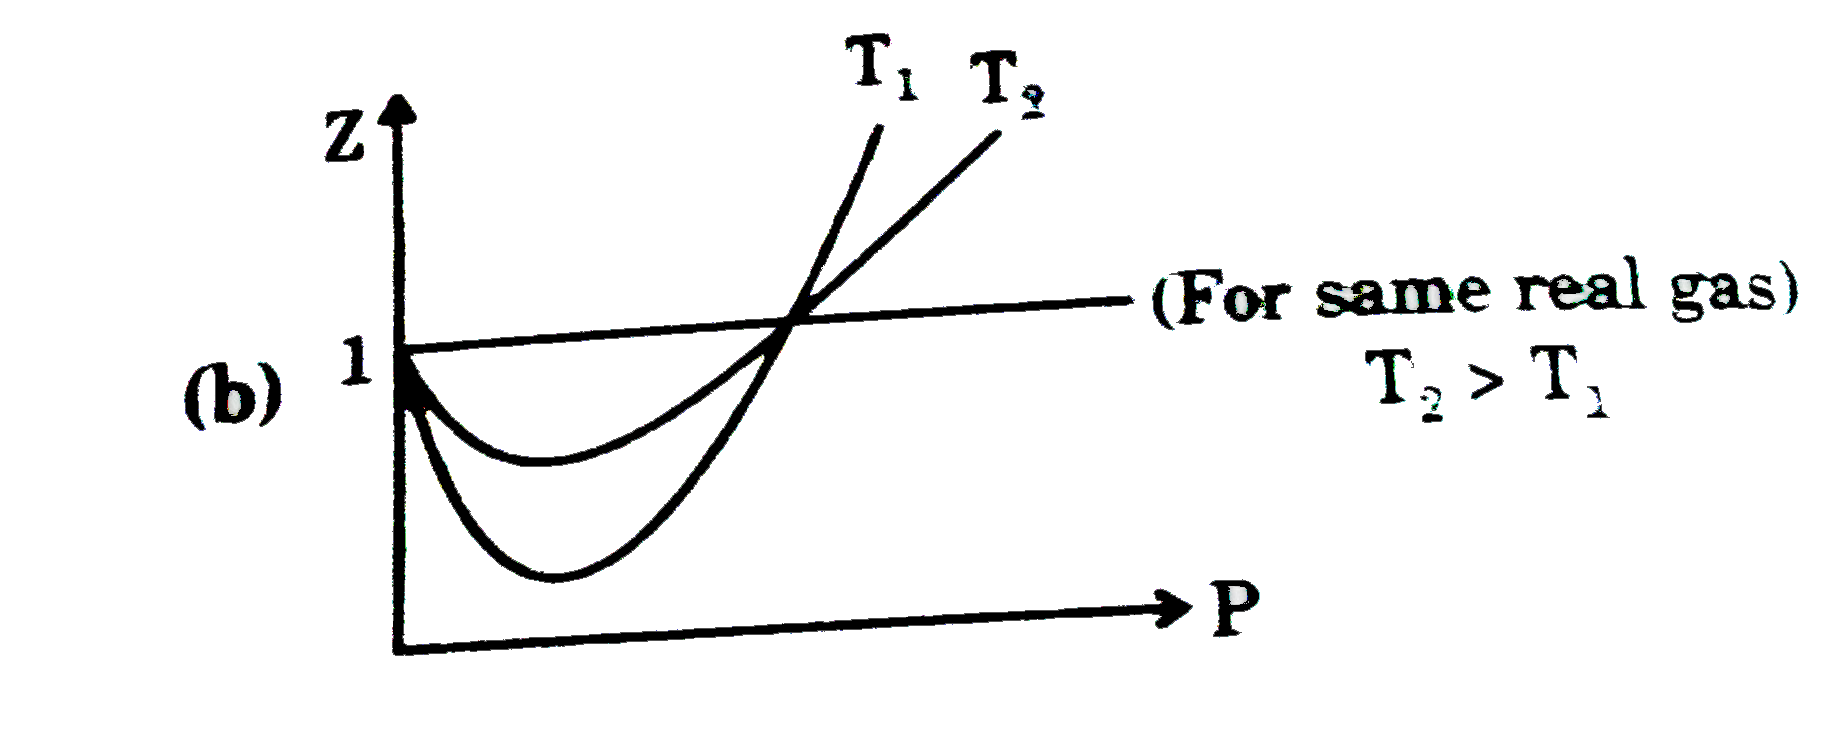 C
C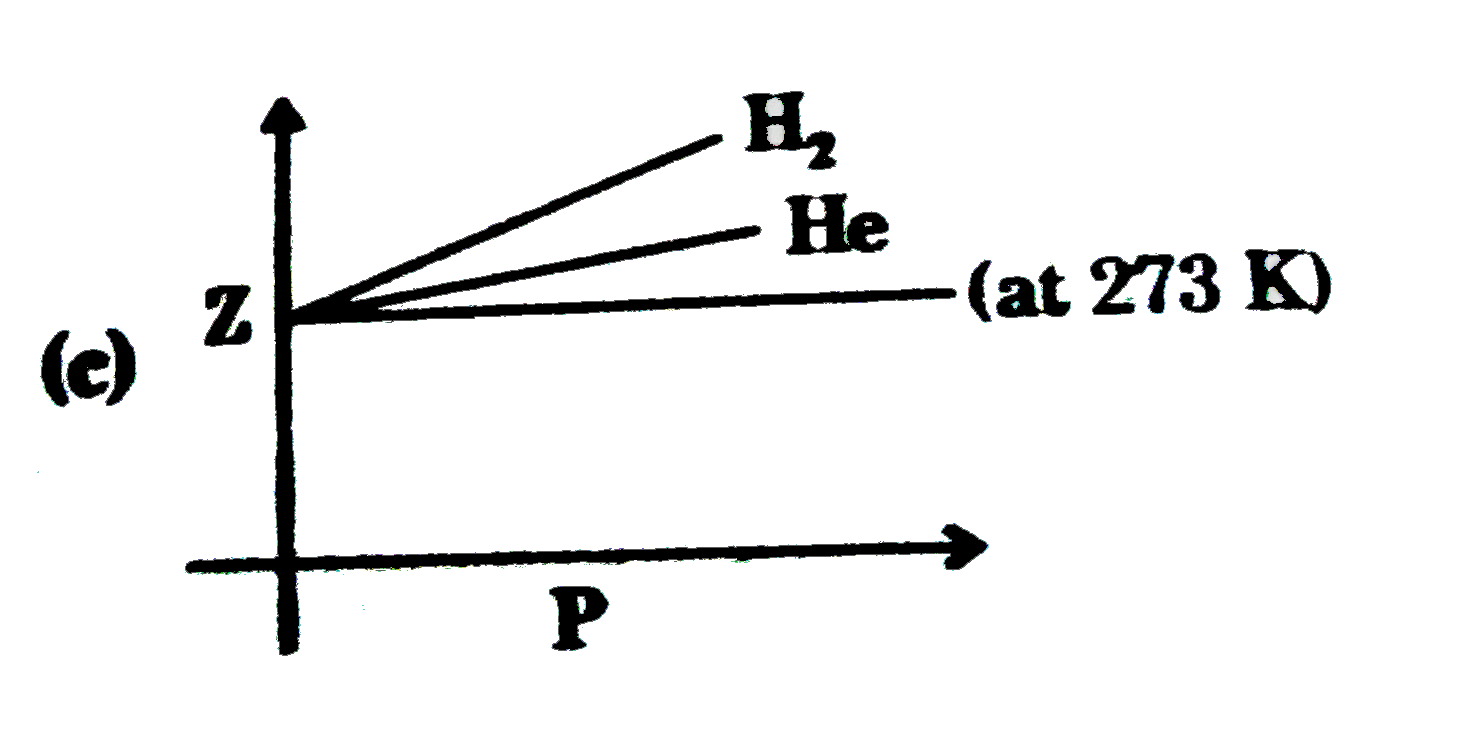 D
D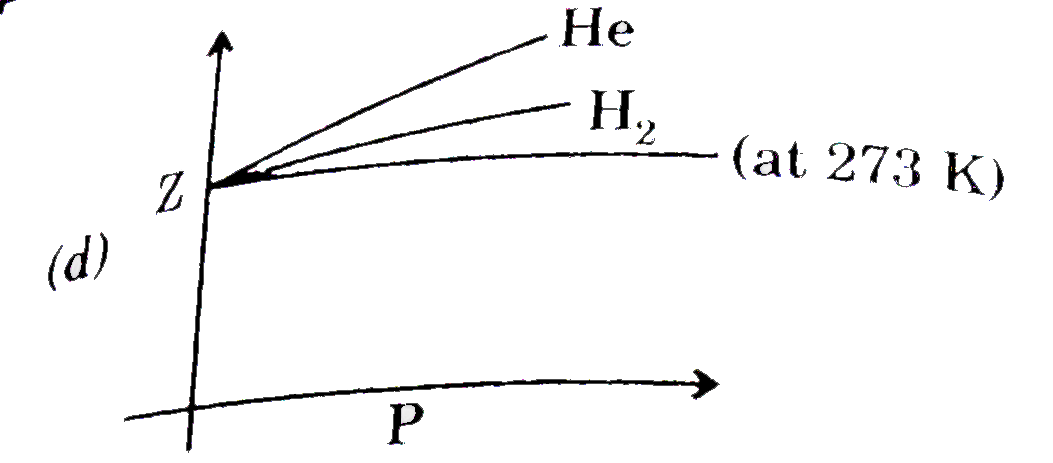
Which of the following graphs is/are correct.
A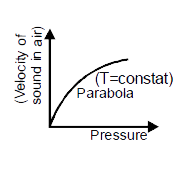 B
B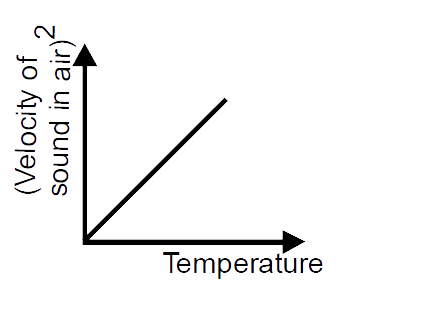 C
C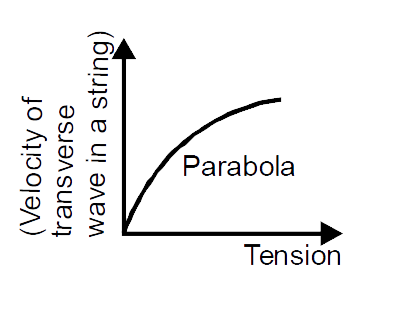 D
D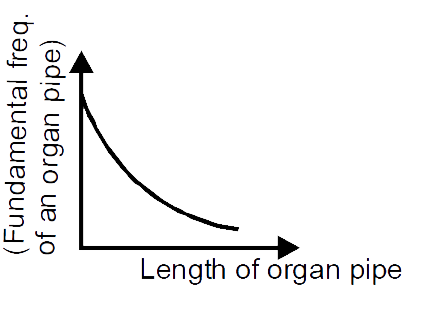
Which of the following is not correct for enzyme catalysis?
AThe enzyme activity is maximum at optimum pH which is between 5-7.BEach enzyme is specific for a given reaction.CThe favourable temperature range of enzyme activity is between 50−60∘C.DThe enzymatic activity is increased in presence of certain substances called co-enzymes
Which of the following is not correct for enzymes
View SolutionWhich of the following terms are correct about enzyme?
View SolutionWhich of the following terms are correct about enzyme?
View SolutionWhich one of the following statements is incorrect about enzyme catalysis ?
View SolutionWhich of the following combination is correct for the enzymes of lysosmes?
View Solution