For an exothermic reaction, following two steps are involved.
Step 1. A+B→I (slow)
Step 2. I→AB (fast)
Which of the following graphs correctly represent this reaction ?
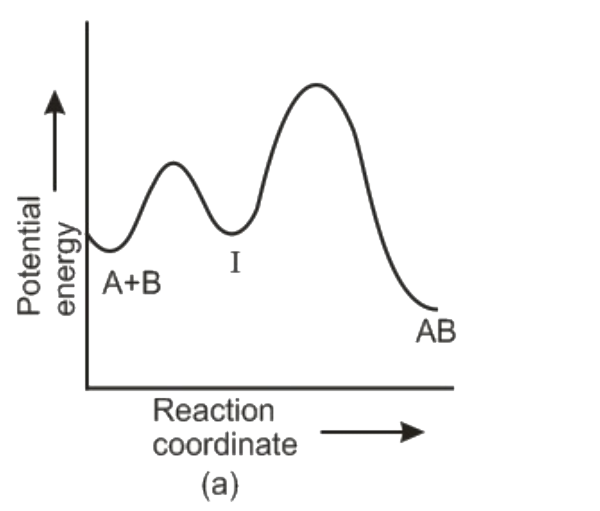
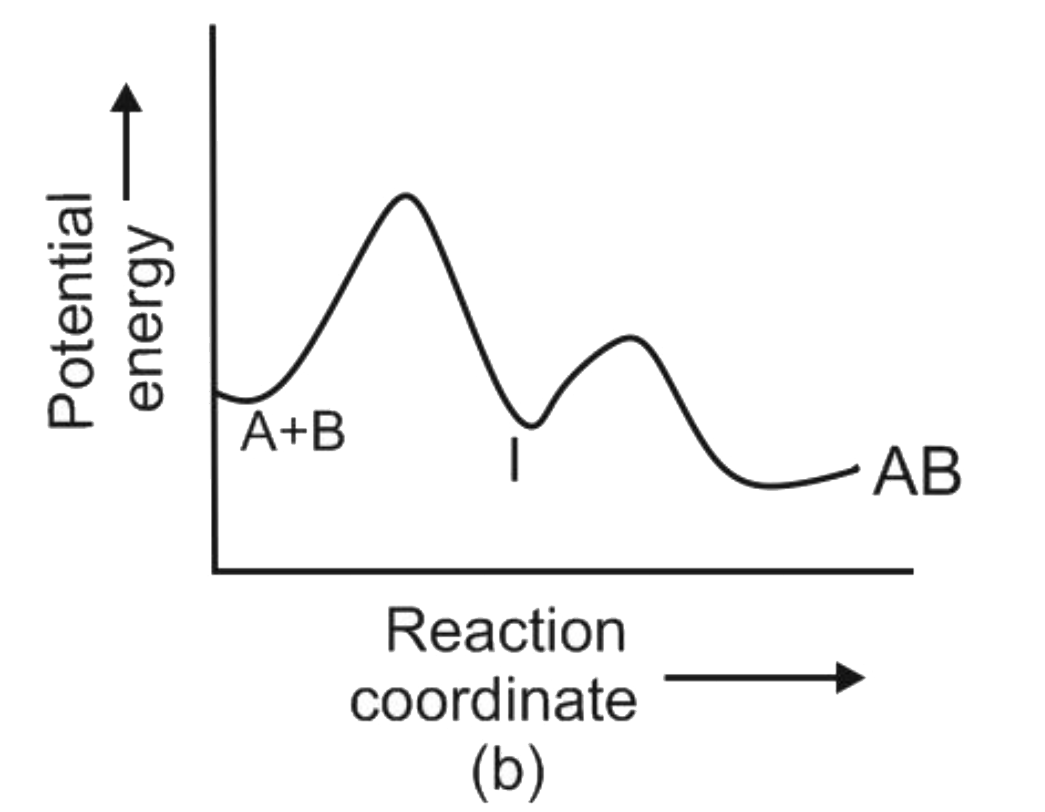
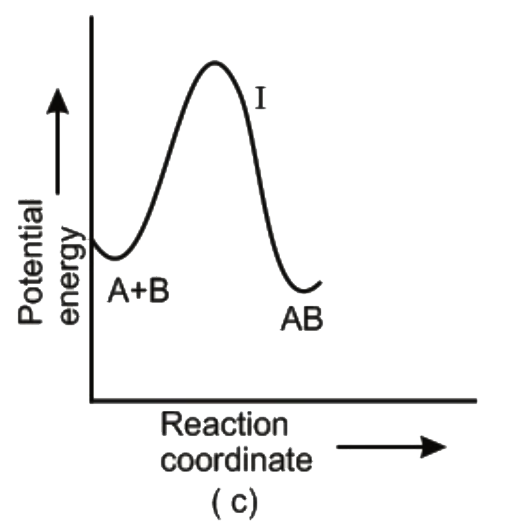
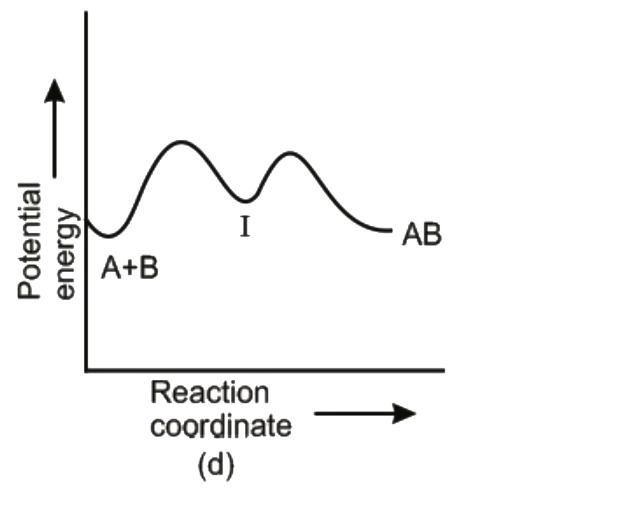
The correct Answer is:B
To solve the problem regarding the exothermic reaction with the given steps, we will analyze the reaction mechanism and how it reflects on a potential energy diagram.
Step 1: Understand the Reaction Steps
- The reaction consists of two steps:
- Step 1: A+B→I (slow)
- Step 2: I→AB (fast)
Step 2: Identify the Nature of the Reaction
- Since the reaction is exothermic, the overall energy of the products (AB) will be lower than that of the reactants (A + B).
Step 3: Analyze the Energy Profile
- In an energy profile diagram for a reaction:
- The y-axis represents potential energy.
- The x-axis represents the progress of the reaction.
- For an exothermic reaction, the energy of the products is lower than that of the reactants.
Step 4: Determine the Number of Maxima and Minima
- The number of maxima in the energy diagram corresponds to the number of steps in the reaction mechanism.
- In this case, there are two steps, so we expect two maxima (one for each step).
- Between these two maxima, there will be a valley representing the stable intermediate I.
Step 5: Activation Energy Consideration
- The activation energy for the slow step (Step 1) will be higher than for the fast step (Step 2).
- This means that the first peak (for Step 1) will be higher than the second peak (for Step 2).
Step 6: Conclusion
- The correct graph must show:
- Two peaks (maxima) corresponding to the two steps.
- The first peak higher than the second peak.
- The overall energy of the products lower than the reactants.
Final Answer
Based on the analysis, the correct graph that represents this exothermic reaction mechanism is Option 2.
- The reaction consists of two steps:
- Step 1: A+B→I (slow)
- Step 2: I→AB (fast)
- Since the reaction is exothermic, the overall energy of the products (AB) will be lower than that of the reactants (A + B).
- In an energy profile diagram for a reaction:
- The y-axis represents potential energy.
- The x-axis represents the progress of the reaction.
- For an exothermic reaction, the energy of the products is lower than that of the reactants.
- The number of maxima in the energy diagram corresponds to the number of steps in the reaction mechanism.
- In this case, there are two steps, so we expect two maxima (one for each step).
- Between these two maxima, there will be a valley representing the stable intermediate I.
- The activation energy for the slow step (Step 1) will be higher than for the fast step (Step 2).
- This means that the first peak (for Step 1) will be higher than the second peak (for Step 2).
- The correct graph must show:
- Two peaks (maxima) corresponding to the two steps.
- The first peak higher than the second peak.
- The overall energy of the products lower than the reactants.
Based on the analysis, the correct graph that represents this exothermic reaction mechanism is Option 2.
Topper's Solved these Questions
Similar Questions
Knowledge Check
Which of the following graph represents an exothermix reaction?
A B
B C
C D
D
Which of the following graphs represents exothermic reaction?
 Ai) onlyBii) onlyCiii) onlyDi) and ii)
Which of the following graph represents exothermic reaction ?
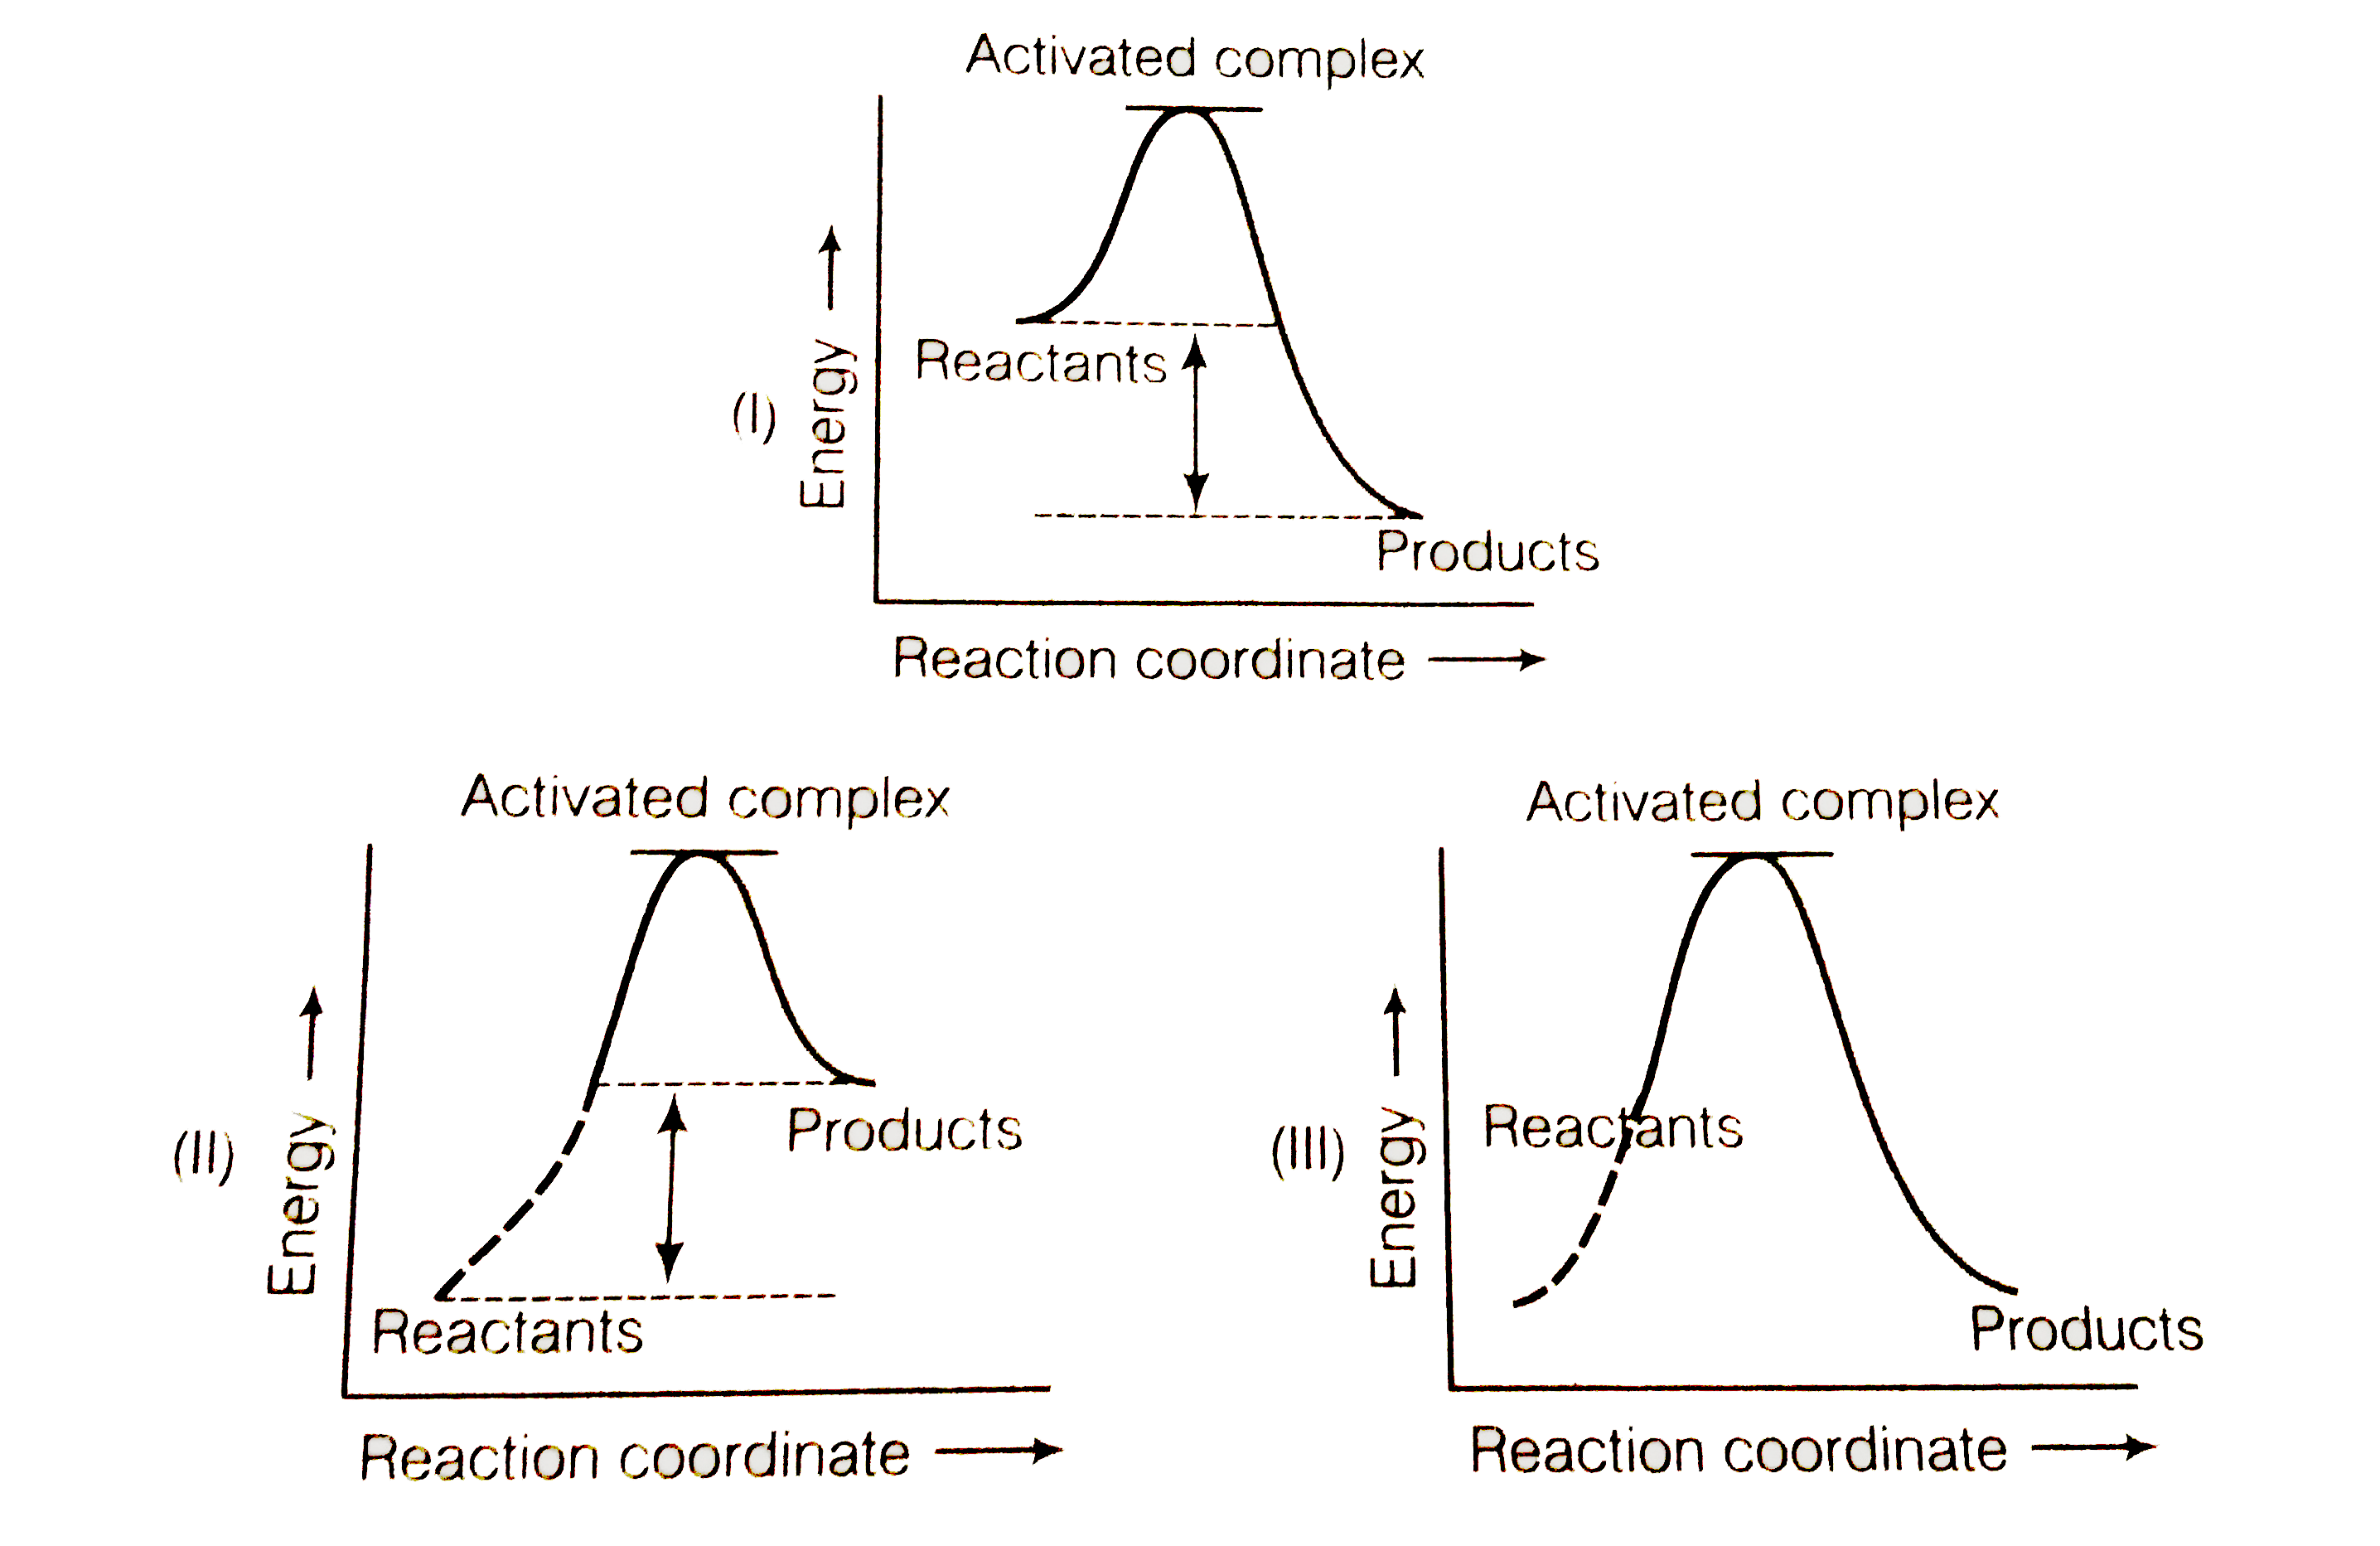 Aonly (i)BOnly (ii)COnly (iii)D(I) and (II)
Which of the following steps not involved in respiration :−
View SolutionWhich of the following are the steps involved in tissue culture?
View SolutionWhich of the following are the steps/reactions involved in the extraction of iron?
View SolutionWhich of the following represents the steps involved in developing GMOs ?
View SolutionWhich of the following steps is not involved in metallurgy of iron ?
View Solution