Which graph correctly correlates Ecell as a function of concentration for the cell (for different values of M nad M' Zn(s)+Cu2+(M)→Zn2+(M')+Cu(s),E∘cell=1.10V
X - axis : log10.[Zn2+][Cu2+], Y - axis : Ecell
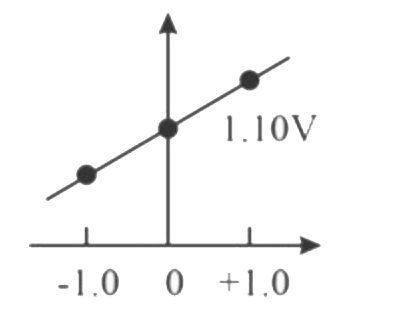
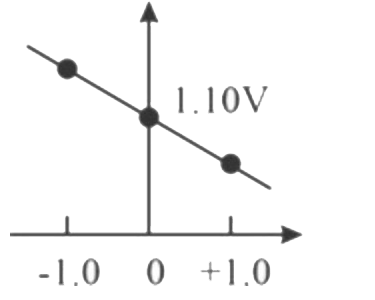
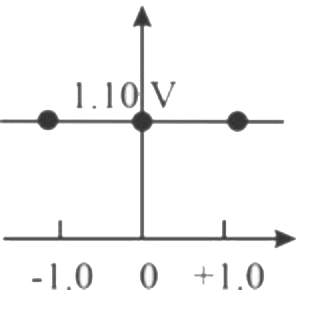
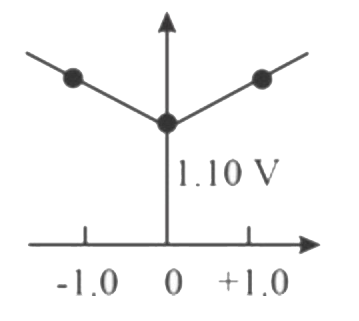
The correct Answer is:B
To solve the problem, we will follow these steps:
Step 1: Write the Cell Reaction
The cell reaction is given as:
Zn(s)+Cu2+(M)→Zn2+(M′)+Cu(s)
Step 2: Identify Oxidation and Reduction
In this reaction:
- Zinc (Zn) is oxidized to Zinc ions (Zn2+).
- Copper ions (Cu2+) are reduced to Copper (Cu).
Step 3: Determine the Number of Electrons Transferred
From the reaction, we can see that 2 electrons are involved in the process:
- Zn → Zn2++2e− (oxidation)
- Cu2++2e−→Cu (reduction)
Thus, n=2.
Step 4: Write the Nernst Equation
The Nernst equation for this cell reaction is:
Ecell=E∘cell−RTnFlnQ
Where Q is the reaction quotient given by Q=(Zn2+)(Cu2+).
Step 5: Substitute Values into the Nernst Equation
Given E∘cell=1.10V, we can rewrite the Nernst equation as:
Ecell=1.10−0.0591nlog((Zn2+)(Cu2+))
Substituting n=2:
Ecell=1.10−0.0591log((Zn2+)(Cu2+))
Step 6: Analyze the Graph
In the equation, we see that:
- The y-intercept (when log((Zn2+)(Cu2+))=0) is Ecell=1.10V.
- The slope is negative, indicating that as the log of the concentration ratio increases, Ecell decreases.
Step 7: Conclusion
Based on the analysis, the graph of Ecell versus log((Zn2+)(Cu2+)) will have:
- An intercept at 1.10V.
- A downward slope.
Thus, the correct option is the one that shows a negative slope starting from the intercept of 1.10V.
The cell reaction is given as:
Zn(s)+Cu2+(M)→Zn2+(M′)+Cu(s)
In this reaction:
- Zinc (Zn) is oxidized to Zinc ions (Zn2+).
- Copper ions (Cu2+) are reduced to Copper (Cu).
From the reaction, we can see that 2 electrons are involved in the process:
- Zn → Zn2++2e− (oxidation)
- Cu2++2e−→Cu (reduction)
The Nernst equation for this cell reaction is:
Ecell=E∘cell−RTnFlnQ
Where Q is the reaction quotient given by Q=(Zn2+)(Cu2+).
Given E∘cell=1.10V, we can rewrite the Nernst equation as:
Ecell=1.10−0.0591nlog((Zn2+)(Cu2+))
Substituting n=2:
Ecell=1.10−0.0591log((Zn2+)(Cu2+))
In the equation, we see that:
- The y-intercept (when log((Zn2+)(Cu2+))=0) is Ecell=1.10V.
- The slope is negative, indicating that as the log of the concentration ratio increases, Ecell decreases.
Based on the analysis, the graph of Ecell versus log((Zn2+)(Cu2+)) will have:
- An intercept at 1.10V.
- A downward slope.
Topper's Solved these Questions
Similar Questions
Knowledge Check
Which graph correctly correlates Ecell as a funcation of concentrations for the cell (for different values of M and M')?
Zn(s)+Cu2+(M)→Zn2+(M')+Cu(s),E∘cell=1.10V
X-axis : log10[Zn2+][Cu2+] Y-axis : EcellA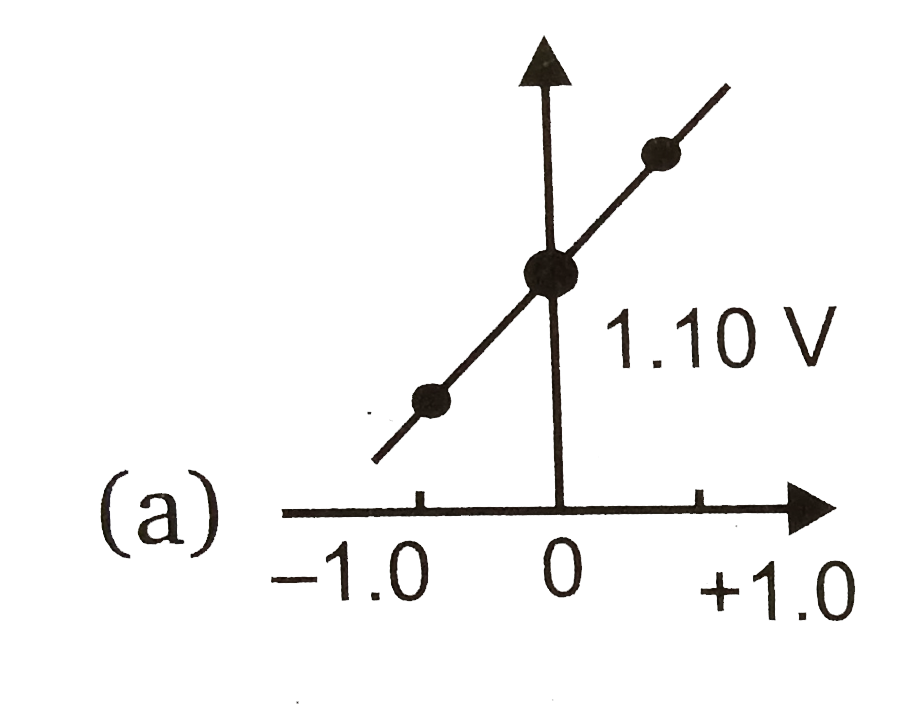 B
B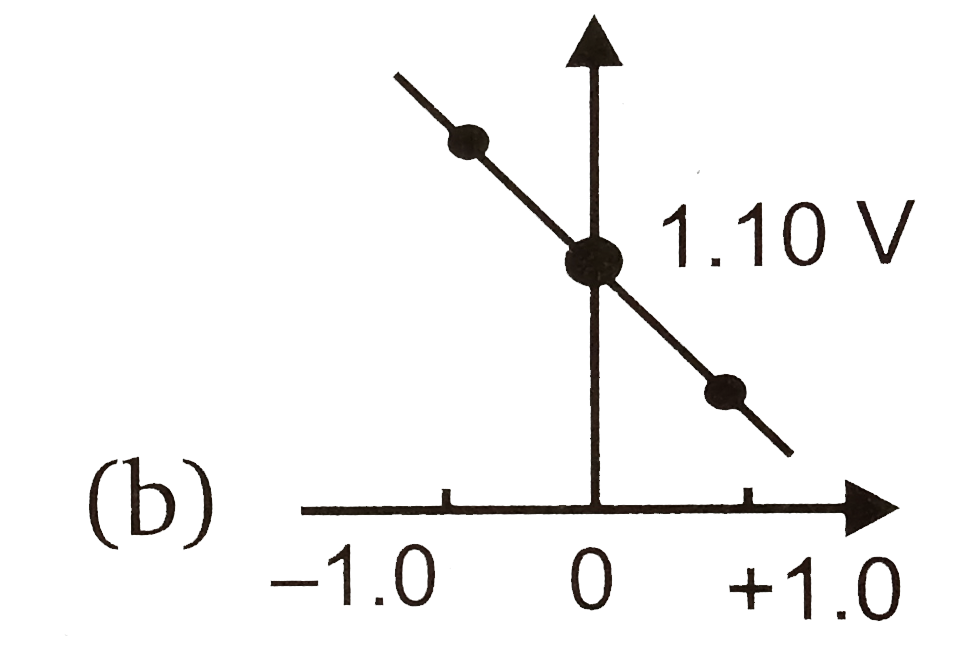 C
C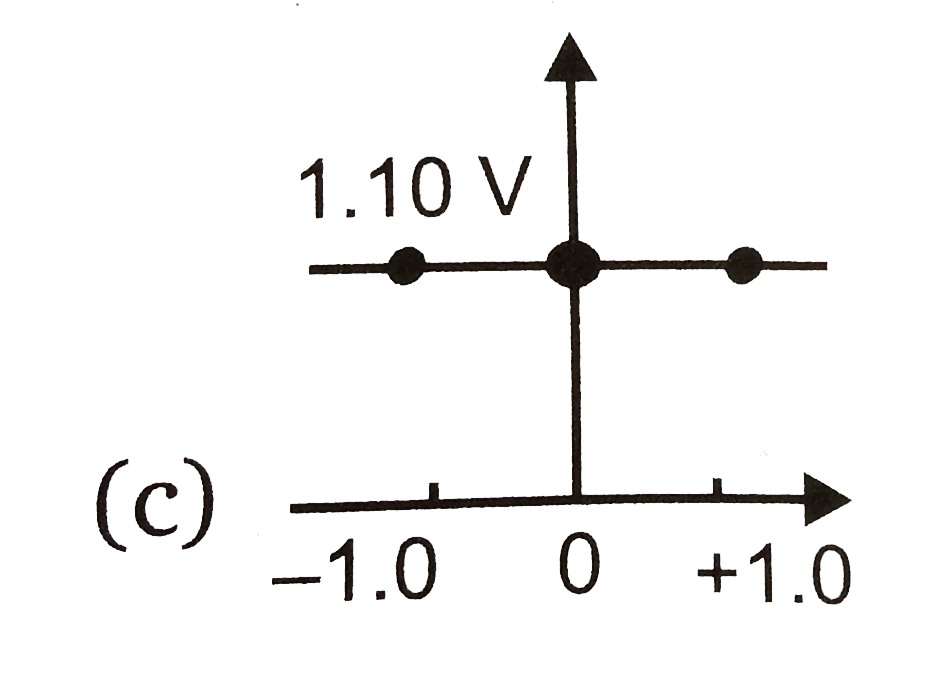 D
D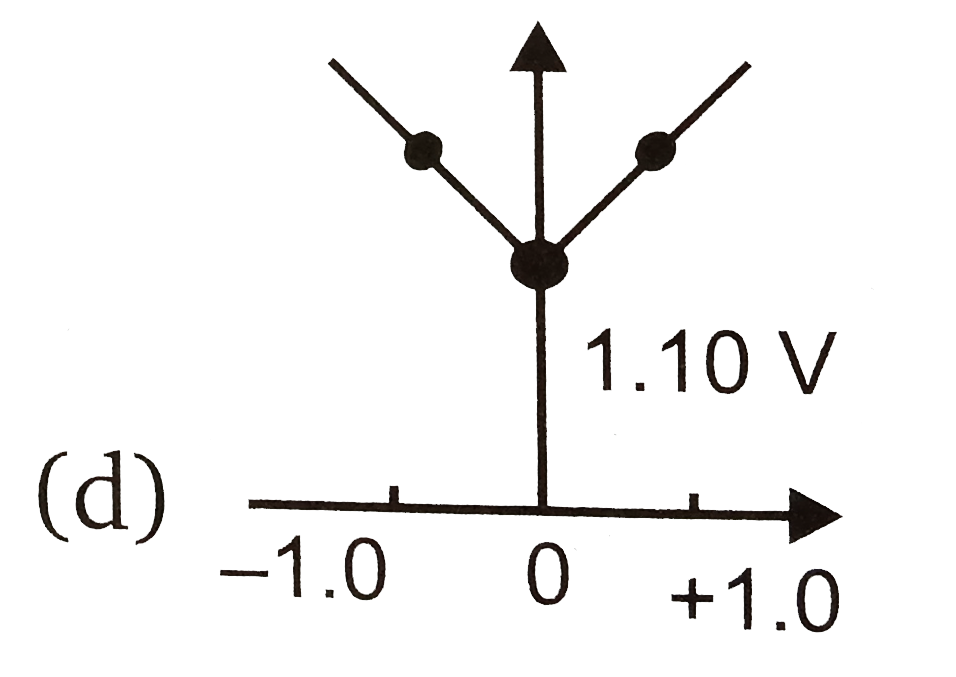
Which graph correctly correlates Ecell as a function of concentration for the cell
Zn(s)+2Ag+(aq)→Zn2+(aq)+2Ag(s),E∘cell=1.56V
y-axis: Ecell, X-axis: log10[Zn2+][Ag+]2A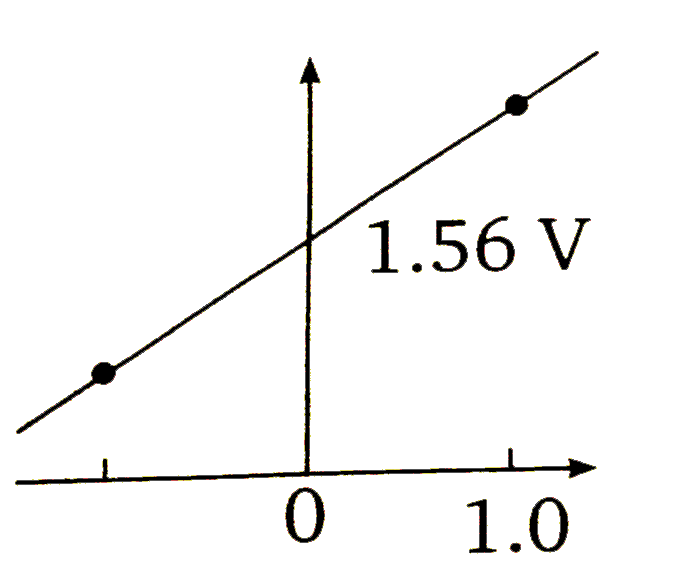 B
B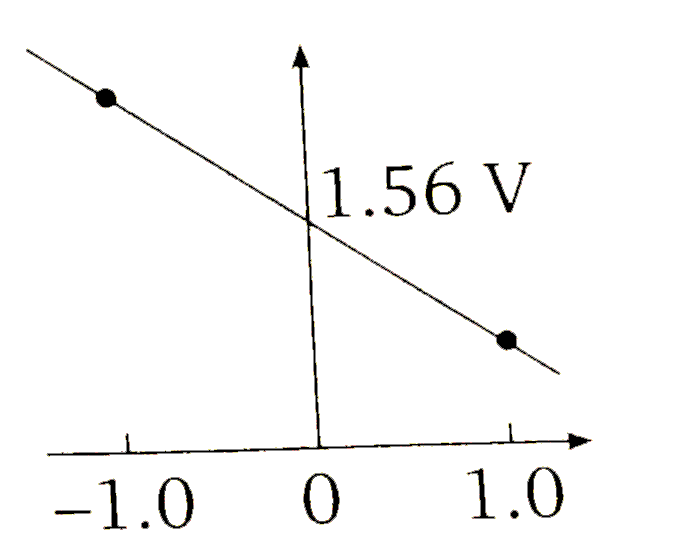 C
C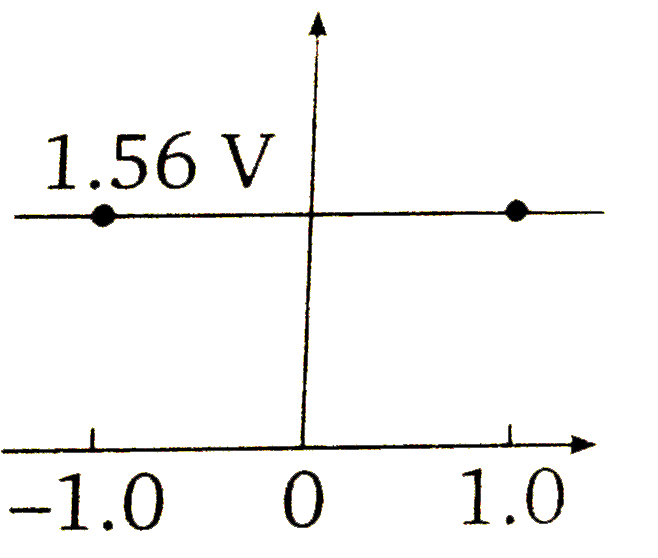 D
D
Calculate the equilibrium costant log (Kc) for the reaction
Zn(s)+Cu2+(aq)→Zn2+(aq)+Cu(s)
[Given E2cell=1.1V]A1.98×1037B2.98×1036C1.68×1037D2.68×1036
निम्न में से कौनसा आरेख सेल के लिए सांद्रता के फलन के रूप में E सेल को सही ढंग से निरूपित करता है? (M और M' के विभिन्न मानों के लिए)
Zn(s)+Cu2+(M)→Zn2+(M+)+Cu(s)
E∘cell=1.10V
X - अक्ष पर, log10([Zn2+])[Cu2+], Y-अक्ष पर: Ecell
View SolutionConsider the following cell reaction
Cu(s)+2Ag+(aq)→Cu2+(aq)+2Ag(s)
E∘cell=0.46V By boubling the concentration of Cu2+, Ecell is
View SolutionThe cell Zn∣∣Zn2+(1M)∣∣∣∣Cu2+(1M)∣∣Cu
E∘cell=1.10V was allowed to be copletely discharged at 298 K The relative concentration of Zn2+Cu2+ is
View SolutionConsider the following reaction,
Zn(s)+Cu2+(0.1M)→Zn2+(1M)+Cu(s) above reaction, taking place in a cell, E∘cell is 1.10V.Ecell for the cell will be (2.303RTF=0.0591)
View SolutionFor the redox reaction
Zn(s)+Cu2+(0.1M)→Zn2+(1M)+Cu(s)
taking place in a cell,E∘cell is 1.10 V. Ecell for the cell will be (2.303RTF=0.0591)
View Solution
