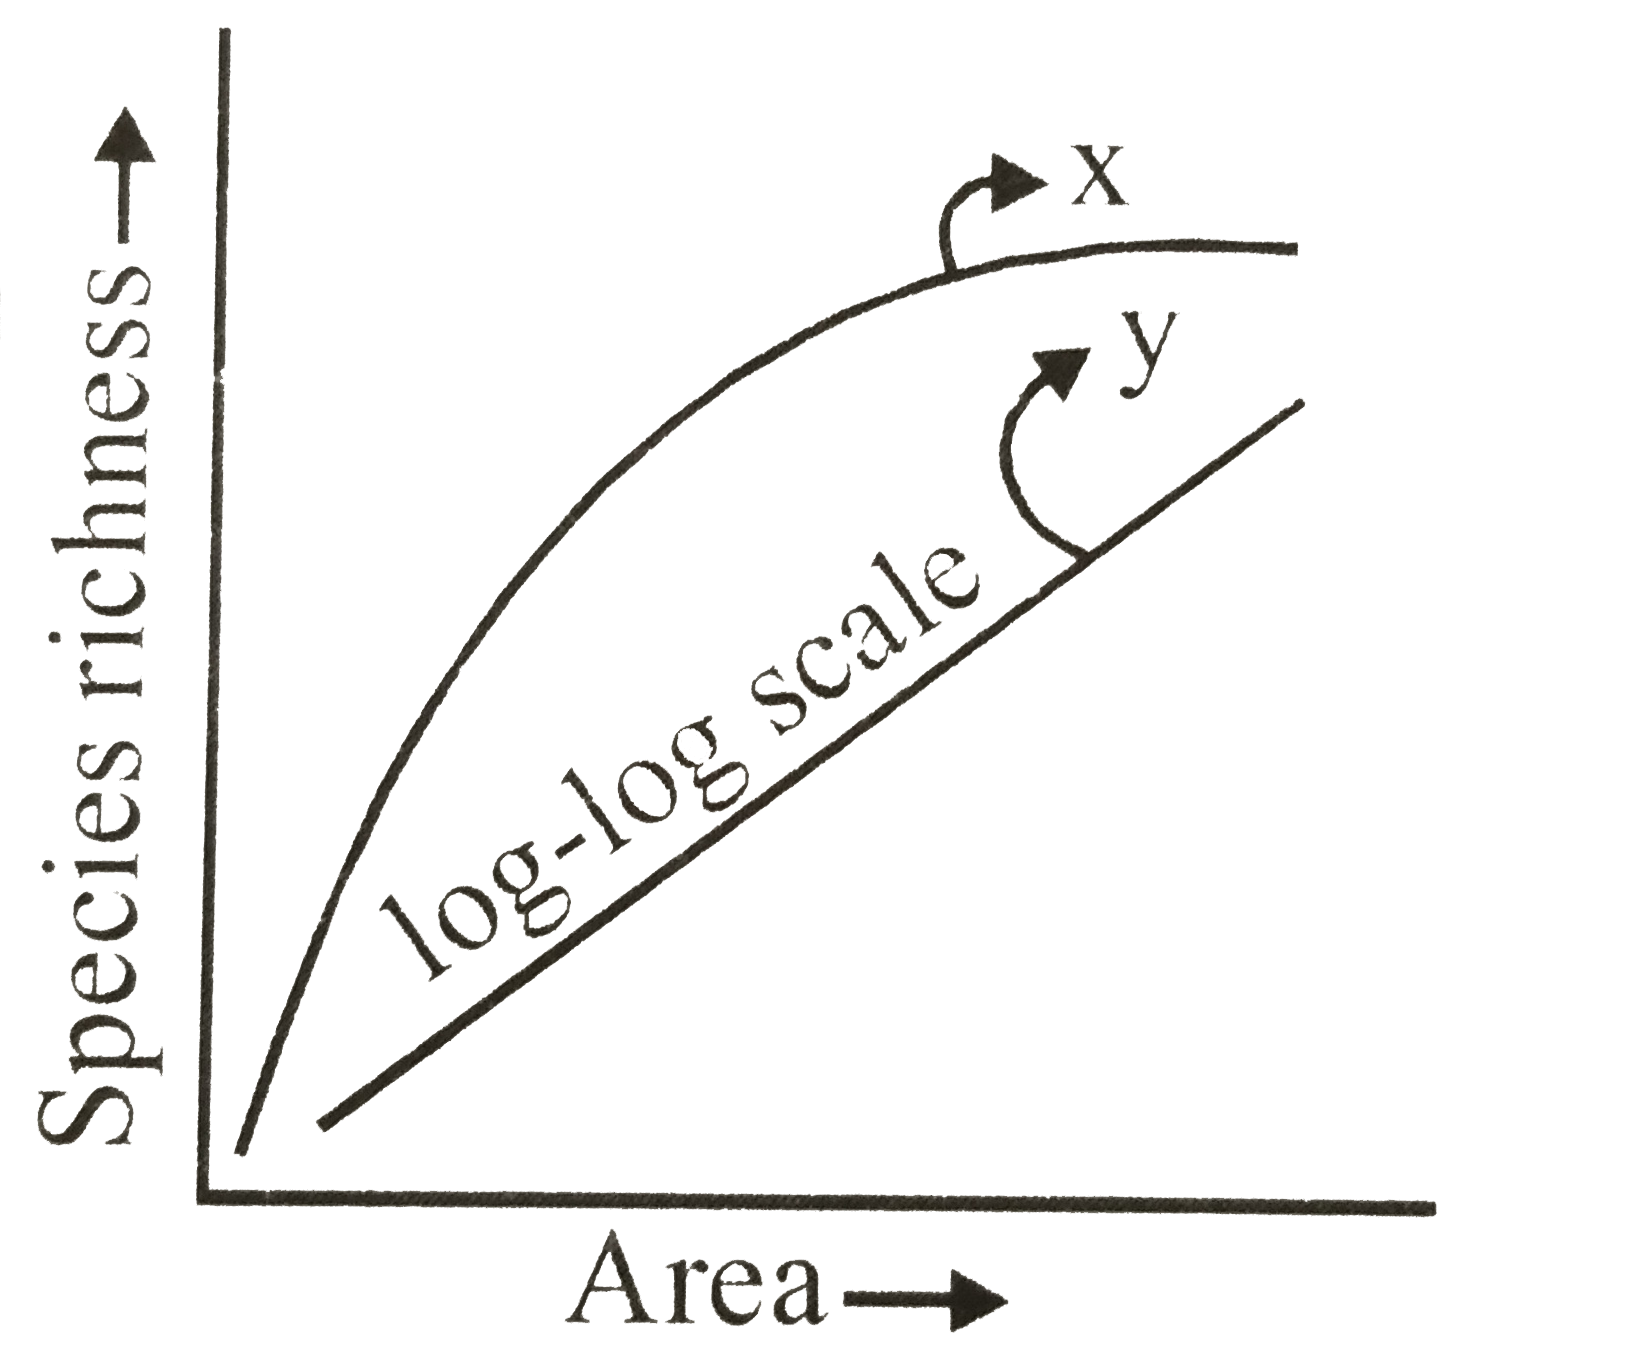
Which of these examples will have the steepest curve when log of species richness and log of area are plotted on a graph?
plants in Britain
birds in California
molluscs in New York State
mammals in the tropical forests of different continents
The correct Answer is:D
To determine which example will have the steepest curve when plotting the log of species richness against the log of area, we need to analyze the options provided based on the concept of species-area relationships.
1. Understanding Species Richness:
- Species richness refers to the number of different species present in a given area. It is an important measure of biodiversity.
2. Logarithmic Transformation:
- When we plot the log of species richness against the log of area, we are often looking for a linear relationship, where the slope of the line indicates how steep the curve is.
3. Analyzing the Options:
- Option 1: Plants in Britain:
- While there is diversity, the overall species richness may not be as high compared to tropical regions.
- Option 2: Birds in California:
- California has a variety of habitats, but again, it may not match the biodiversity found in tropical regions.
- Option 3: Mollusks in New York State:
- Mollusks may have a specific habitat range and may not exhibit high species richness across a broad area.
- Option 4: Mammals in the tropical forest of different continents:
- Tropical forests are known for their high biodiversity and species richness. Mammals in these regions often show a significant increase in species richness with area.
4. Conclusion:
- Based on the analysis, the example that will have the steepest curve when plotting the log of species richness against the log of area is Option 4: Mammals in the tropical forest of different continents. This is due to the high biodiversity typically found in tropical forests.
- Species richness refers to the number of different species present in a given area. It is an important measure of biodiversity.
- When we plot the log of species richness against the log of area, we are often looking for a linear relationship, where the slope of the line indicates how steep the curve is.
- Option 1: Plants in Britain:
- While there is diversity, the overall species richness may not be as high compared to tropical regions.
- Option 2: Birds in California:
- California has a variety of habitats, but again, it may not match the biodiversity found in tropical regions.
- Option 3: Mollusks in New York State:
- Mollusks may have a specific habitat range and may not exhibit high species richness across a broad area.
- Option 4: Mammals in the tropical forest of different continents:
- Tropical forests are known for their high biodiversity and species richness. Mammals in these regions often show a significant increase in species richness with area.
- Based on the analysis, the example that will have the steepest curve when plotting the log of species richness against the log of area is Option 4: Mammals in the tropical forest of different continents. This is due to the high biodiversity typically found in tropical forests.
Topper's Solved these Questions
Similar Questions
Sketch the curve y=log|x|
View Solution
Study the above graph and answer the following questions -
(i) Identify x and y
(ii) The relation between species richness and area can be denoted as generally
(iii) The value of z lies in range of
(iv) On a log scale the relation between species richness and area is
View Solution
Knowledge Check
A graph of species richness vs area on log-log axes is
AlinearBsigmoidalCoscillatoryDparabolicIn mollusks of New York state, which of these experiences gives you a value between 0.1 to 0.2?
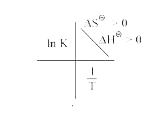
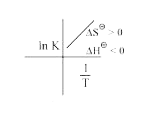
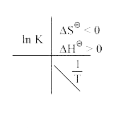
( S = log of species richness, A = log of Area, C = log of Y- intercept in the species richness area curve)AS−CABS−ACCC−ASDA−SCWhich of the plots of ln K vs (1T) is/are correct?
A B
B C
C D
D
Draw the plot log V vs log T.
View SolutionThe curve x=logy+e and y=log(1x)
View SolutionIn the above question, the curve between log I and log R will be :
View SolutionWhich of the following curves between log K and 1T is correct?
View SolutionThe area bounded by the curve y=2 log x, x-axis, y-axis and y = log 5 is equal to
View Solution
