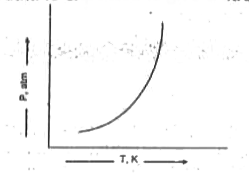
The vapoure pressure of most substances increases with temperature as depicted by this curve. Which way of plotting these data is expected to give a straight line ?

1/P versus T
P versus 1/T
In P vesus
In P vesus 1/T
The correct Answer is:D
Topper's Solved these Questions
- LIQUID SOLUTION BOOK - FIITJEECHAPTER - LIQUID SOLUTION EXERCISE - ASSIGNMENT PROBLEMS (OBJECTIVE) level-II
30 Videos
- LIQUID SOLUTION BOOK - FIITJEECHAPTER - LIQUID SOLUTION EXERCISE - COMPREHENSION-I
3 Videos
- LIQUID SOLUTION BOOK - FIITJEECHAPTER - LIQUID SOLUTION EXERCISE - ASSIGNMENT PROBLEMS (SUBJECTIVE) level-II
15 Videos
- IONIC EQUILIBRIUM BOOK - FIITJEECHAPTER - IONIC EQUILIBRIUM EXERCISE - SINGLE INTEGER ANSWER QUESTIONS
4 Videos
- NUCLEIC ACID AND VITAMIN BOOK - FIITJEECHAPTER - NUCLEIC ACID AND VITAMIN EXERCISE - ASSIGNMENT PROBLEMS (OBJECTIVE)
15 Videos
Similar Questions
Knowledge Check
The vapour pressure of a liquid varies with temperature as log P=−AT+I. The plot of
Alog P against T will be a straight lineBlog P against 1/T will be straight lineClog P against I will be a parabolaDNone of theseThe vapour pressure of a liquid varies with temperature as log P=−AT+I. The plot of
Alog P against T will be a straight lineBlog P against 1/T will be a straight lineClog P against I will be a parabolaDnone of these.Freundlich adsorption isotherm gives a straight line on plotting :
Axm vs PBlogxm vs PClogxm vs log PDxm vs 1P
A: Vapour pressure of the liquid increases with increase in temperature.
R : At elevated temperture increases .
View SolutionFreundlich adsorption isotherm gives a straight line on plotting :
View SolutionAssertion Increasing temperature of a volatile liquid increases its vapour pressure.
Reason Increase in temperature increases the average kinetic energy of molecules in the vapour phase hence they collide to the surface of liquid with greater force.
View SolutionAdsorption is a surface phenomenon and it differs feom adsorption which occurs throughout the body of the substance which absorbs. In physisorption, the attractive forces are mainly van der Waals' forces while in chemisorption actual bonding occurs between the particles of adsorbent and adsorbente. Generally, easily liquefying gases are adsorbed more easily on the surface of a solid as compared to teh gases whihc are liquefied with difficult. Adsorption increases with the increases in pressure and decreases as the temperature is increases.
Freunlich adsorption isotherm gives a straight line on plotting :
View SolutionThe melting points of most of the solid substances increases with an increase of pressure acting on them However, ice melts at a temperature lower than its usual melting point, when the pressure increases. This is Because :
View Solution
