for a diatomic ideal gas in a closed system , which of the following plots does not correctly describe the relation between various thermodynamic quantities ?
To solve the question regarding which plot does not correctly describe the relationship between various thermodynamic quantities for a diatomic ideal gas in a closed system, we can follow these steps:
Step 1: Understand the Thermodynamic Quantities
- Heat Capacity at Constant Pressure (Cp): This is the amount of heat required to raise the temperature of a system by one degree Celsius at constant pressure.
- Heat Capacity at Constant Volume (Cv): This is the amount of heat required to raise the temperature of a system by one degree Celsius at constant volume.
Step 2: Analyze the Given Plots
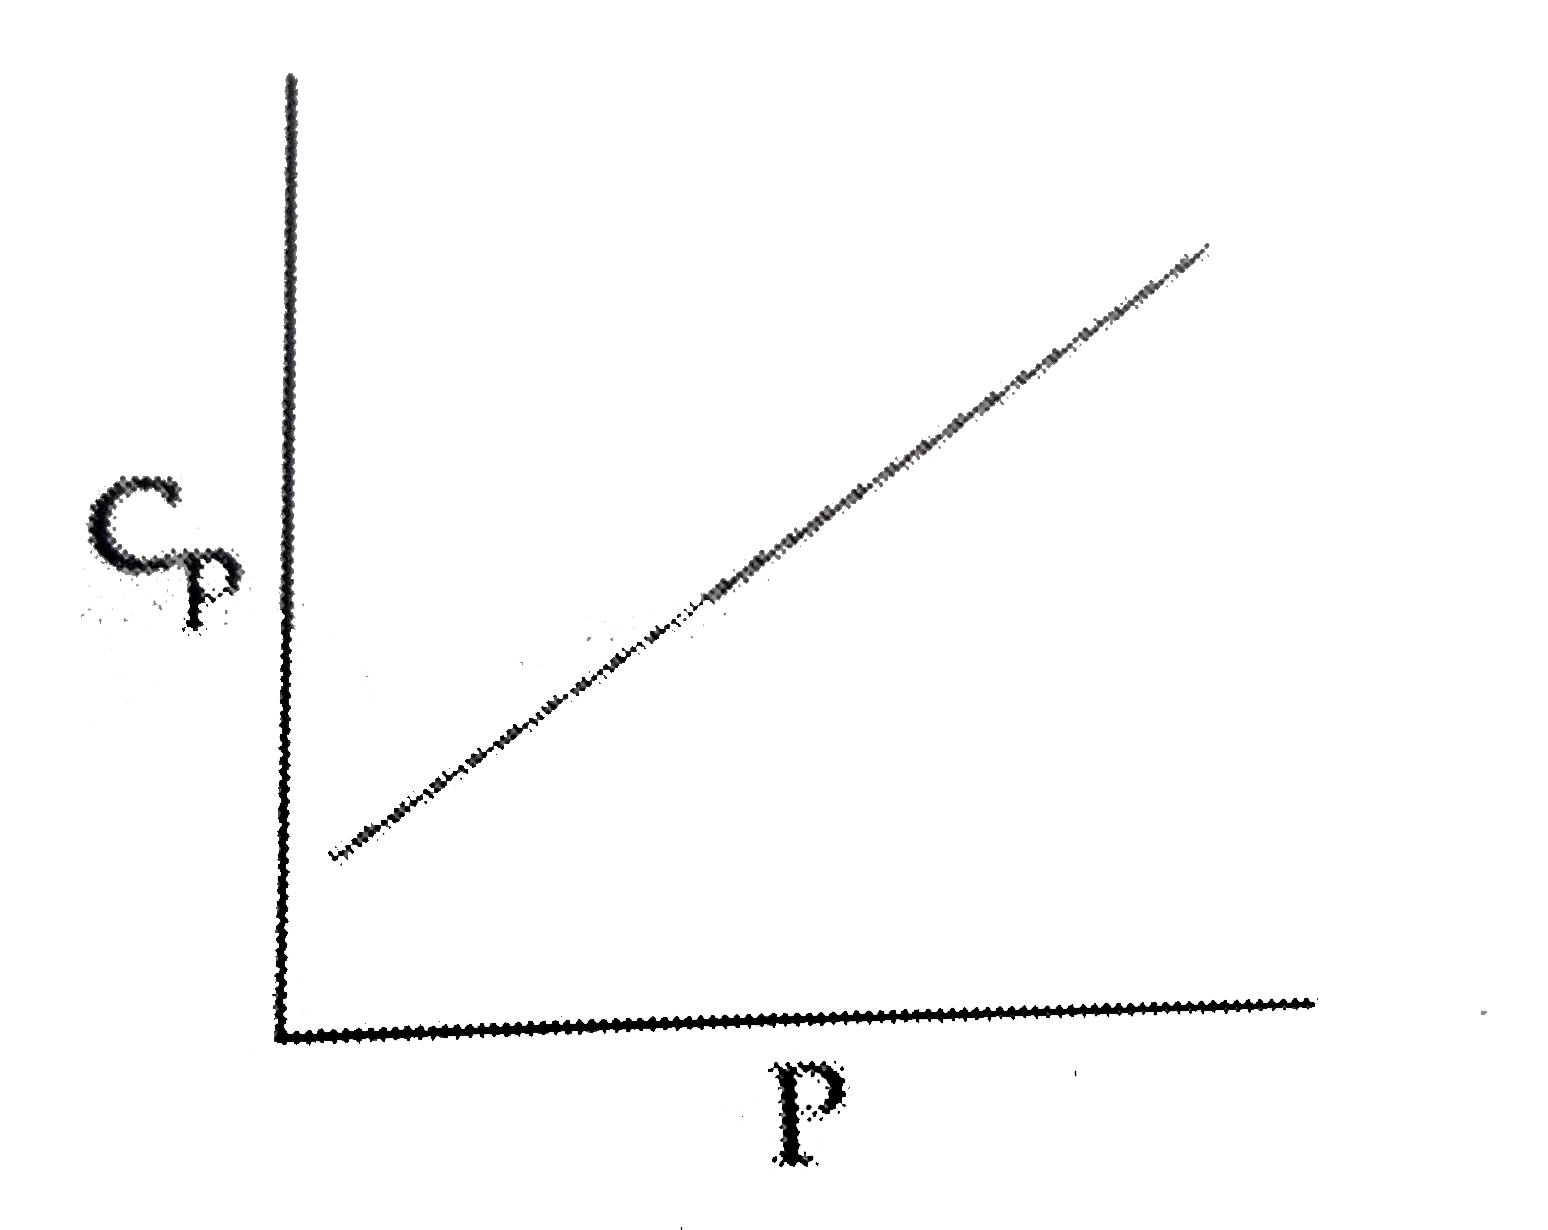
1. Cp vs. Pressure (p):
- For an ideal gas, the heat capacity at constant pressure (Cp) does not change with pressure. Therefore, a plot showing Cp increasing with pressure is incorrect.
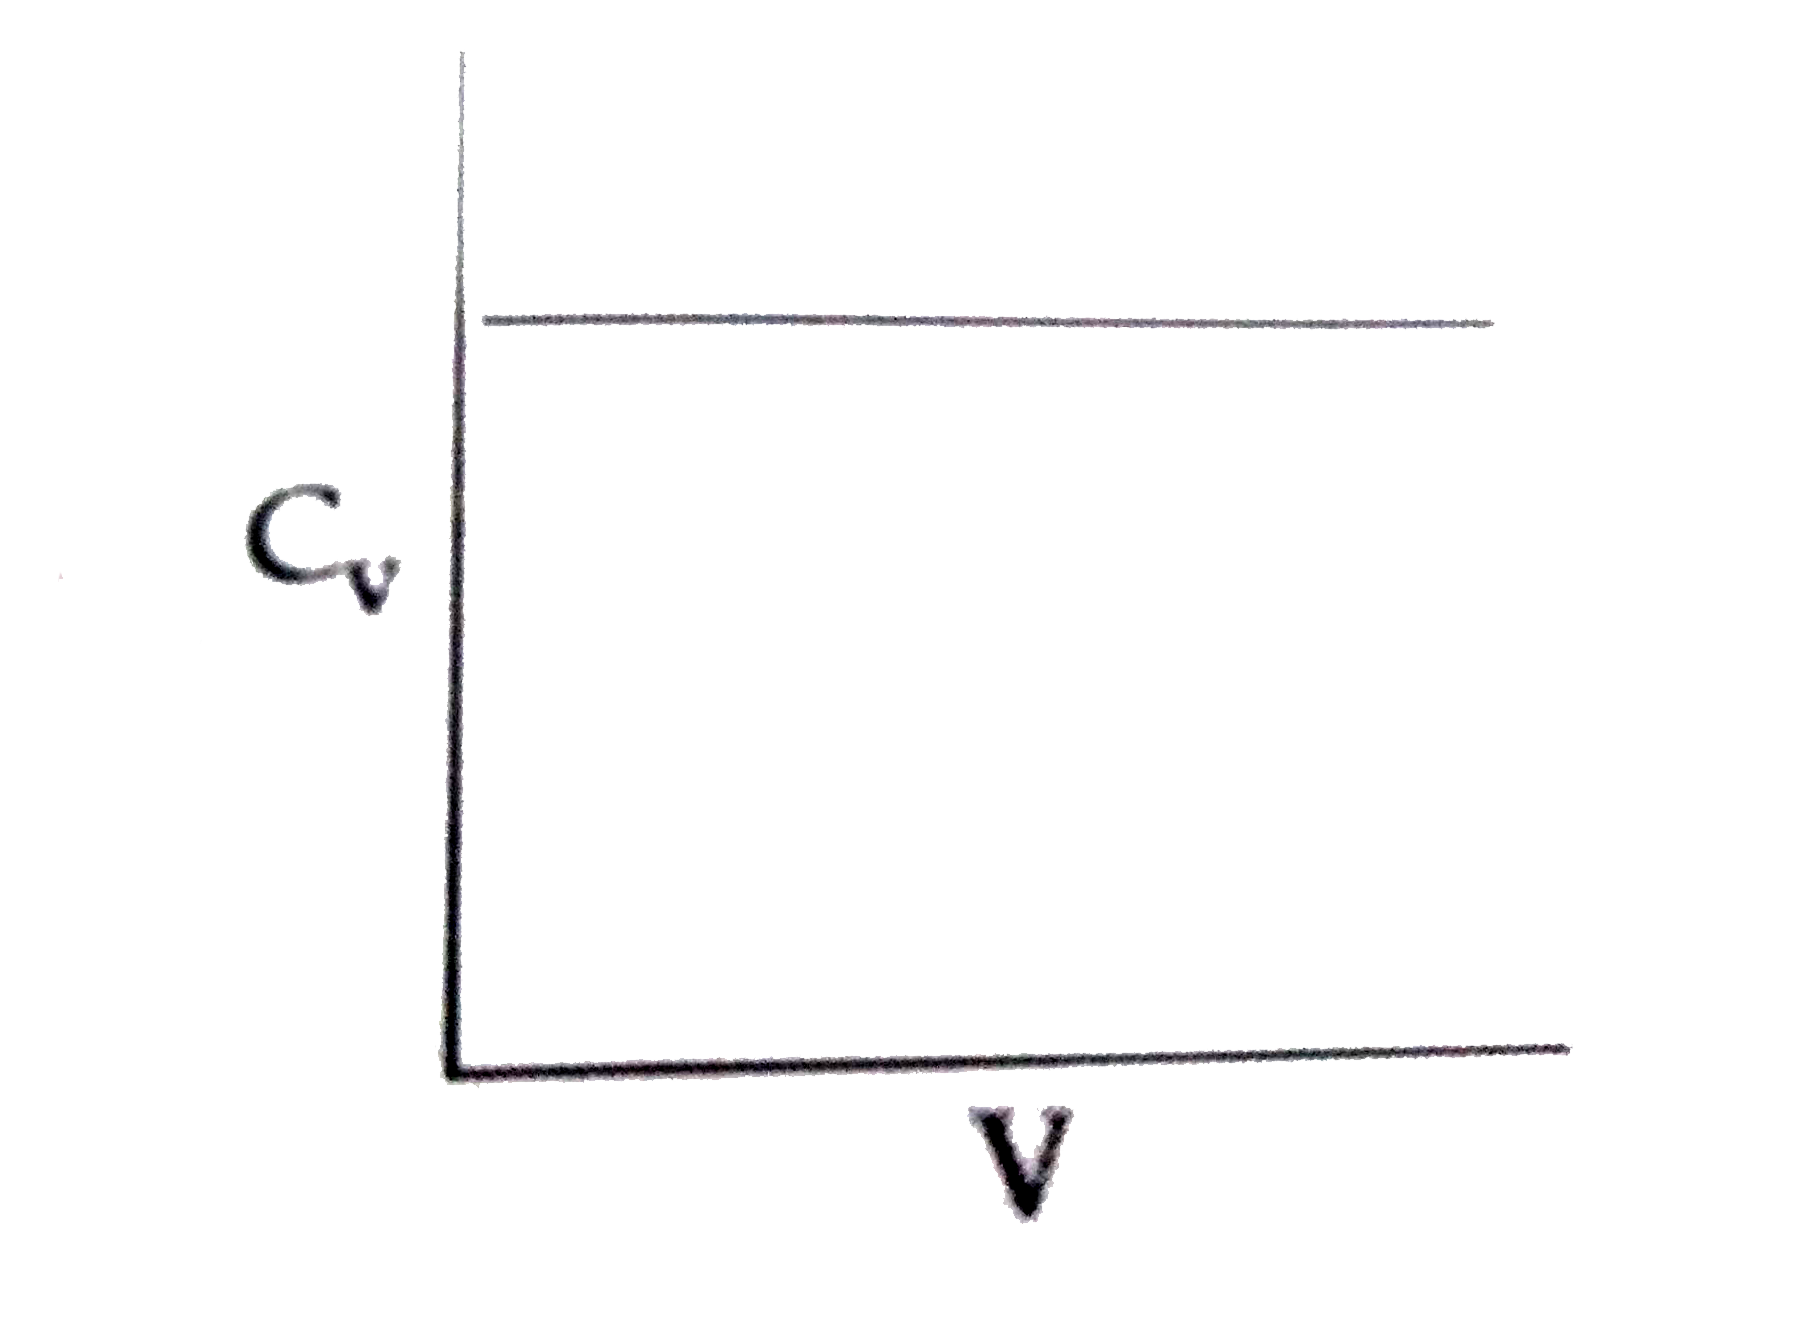
2. Cv vs. Volume (V):
- The heat capacity at constant volume (Cv) remains constant regardless of changes in volume for an ideal gas. Thus, a plot showing Cv changing with volume is also incorrect.
3. Cv vs. Time:
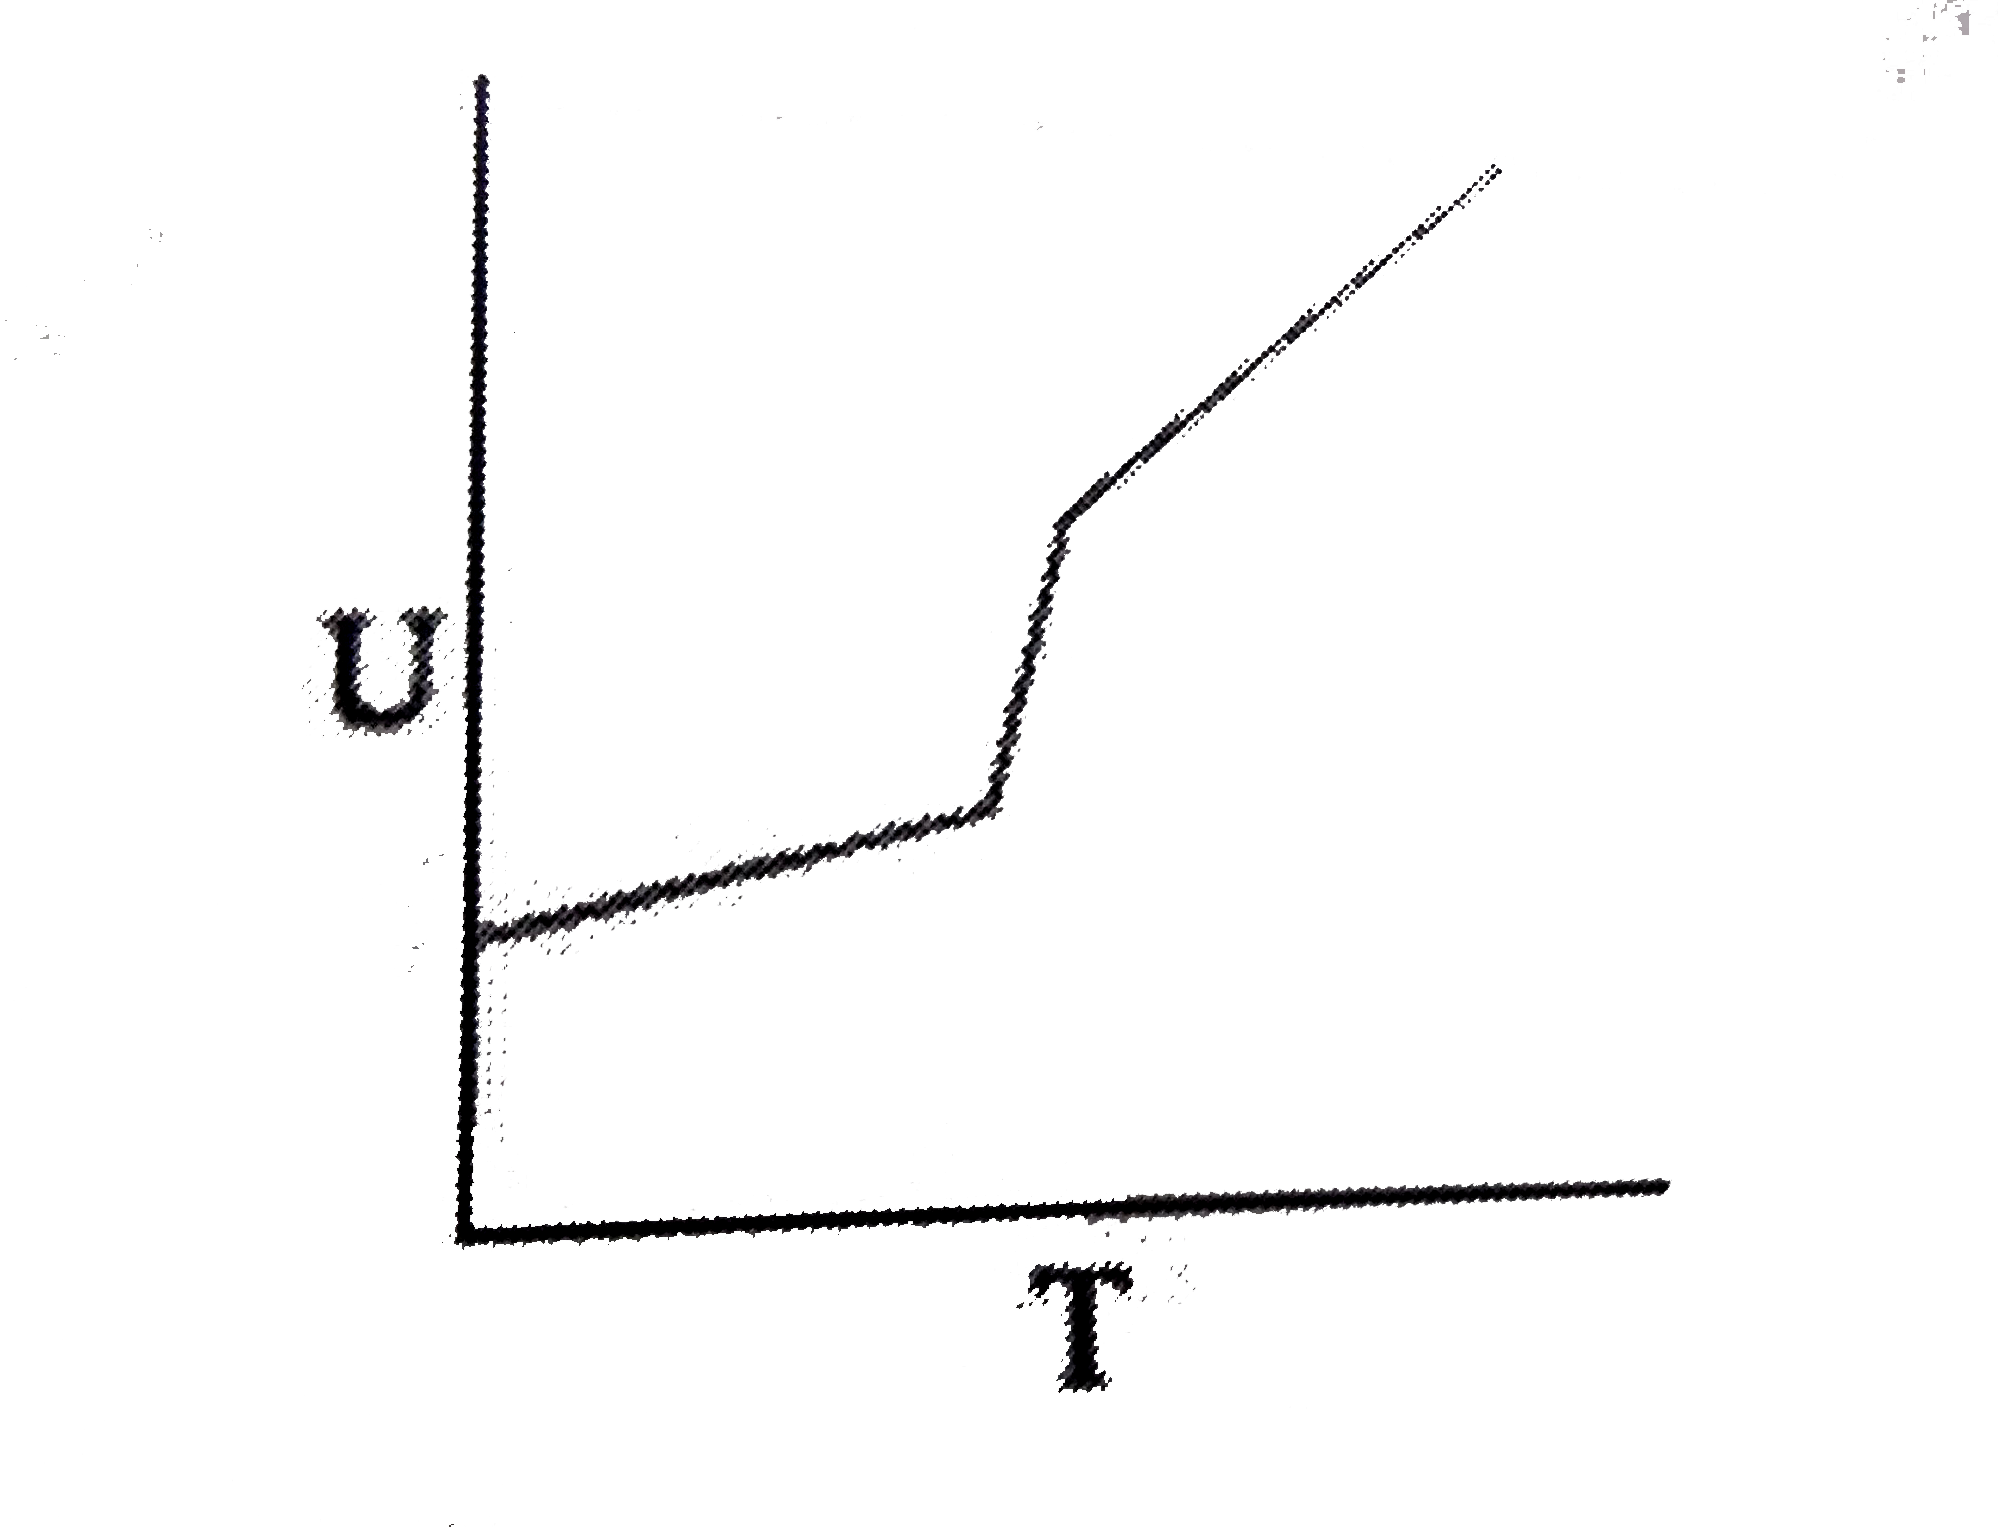
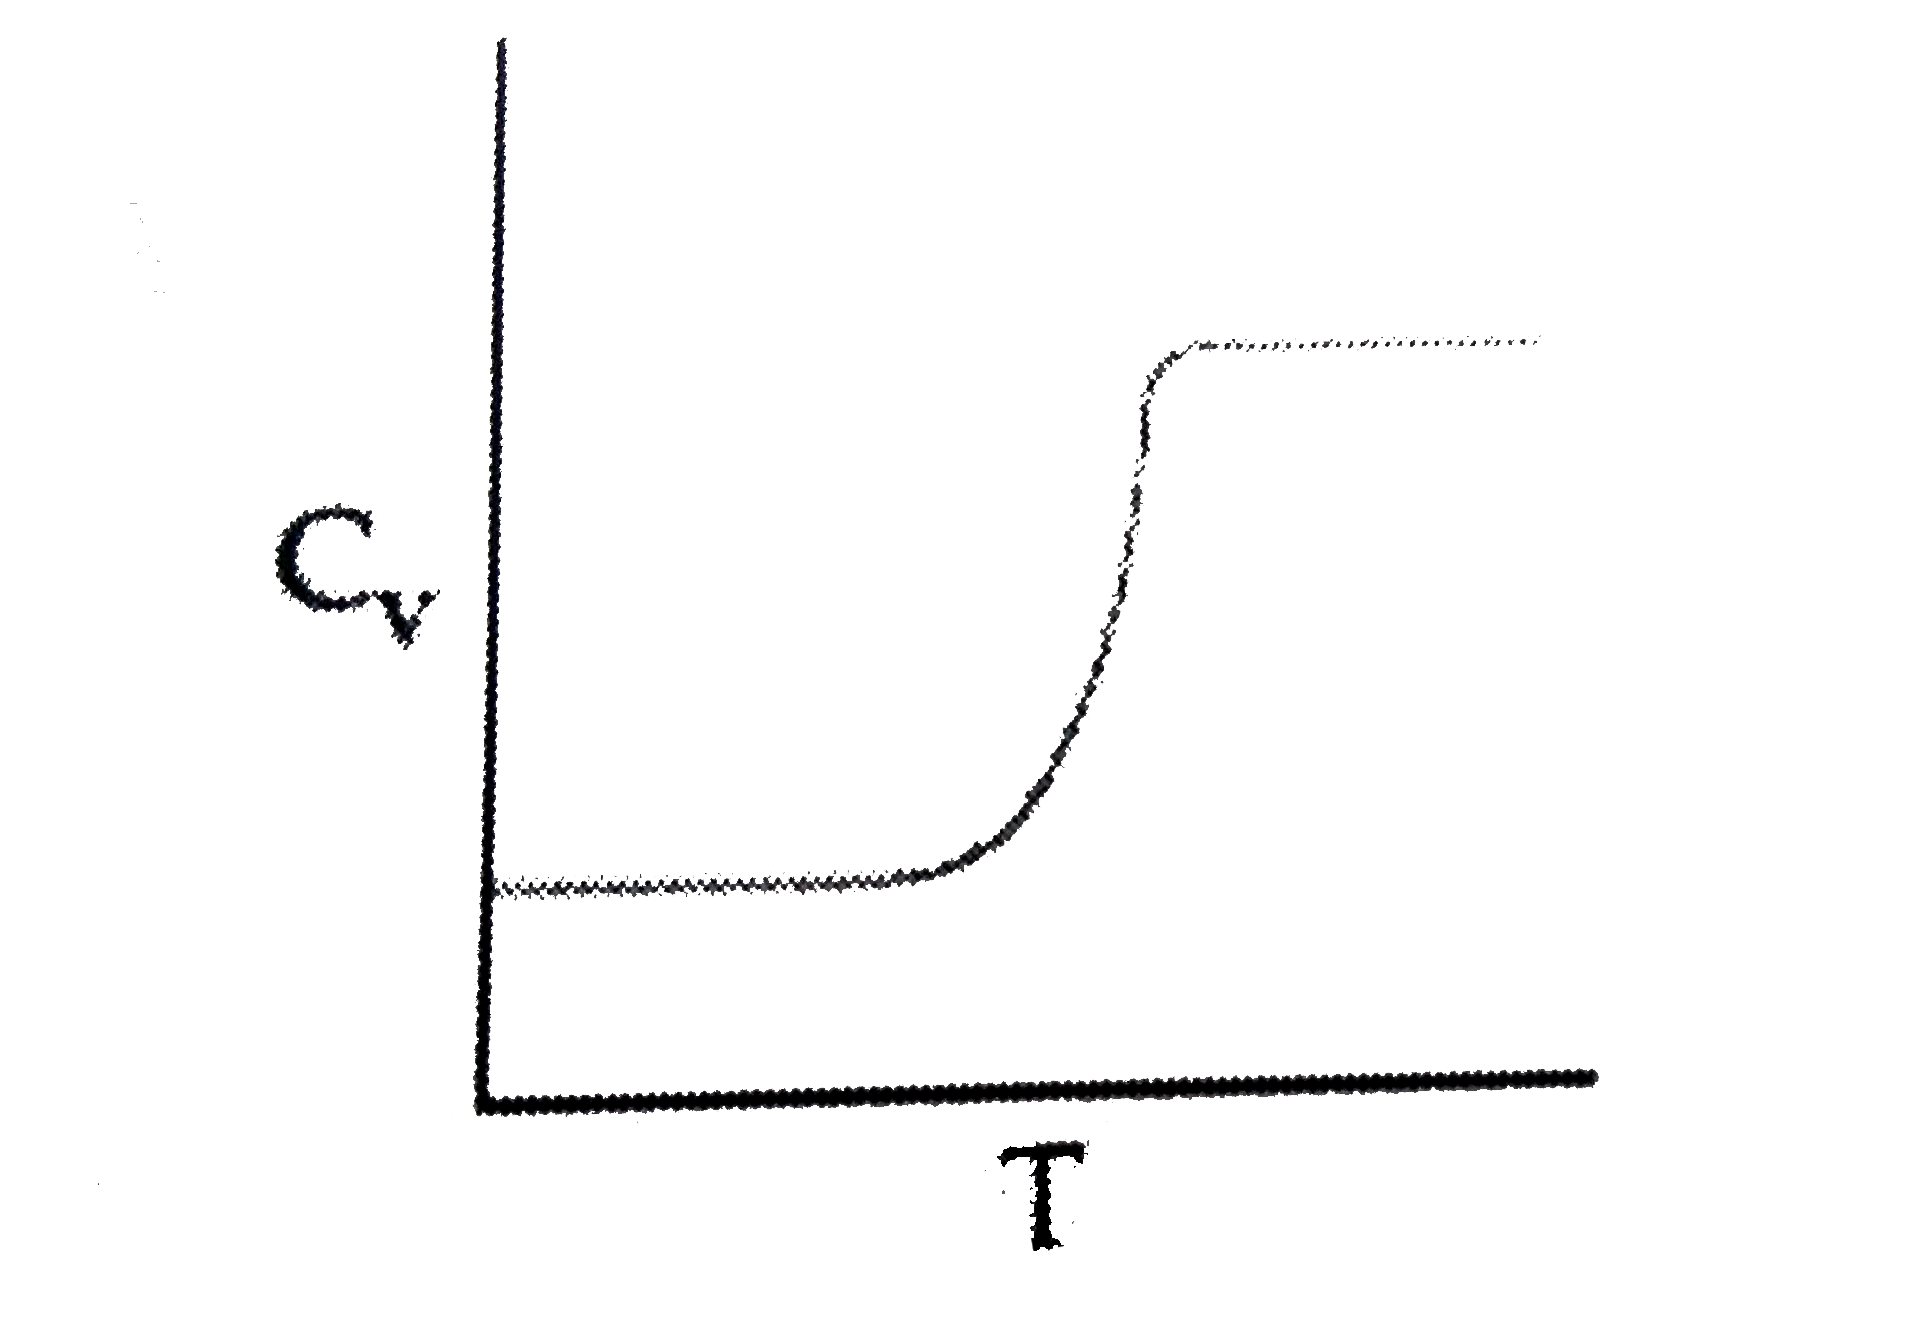
- The heat capacity at constant volume (Cv) can change with temperature, which is related to time if the system is undergoing a process. Therefore, a plot of Cv vs. time can be correct if it reflects changes in temperature.
Step 3: Identify the Incorrect Plot
- The plot that shows Cp vs. Pressure as a straight line increasing is the one that does not correctly describe the relationship, as Cp should remain constant with pressure for a diatomic ideal gas.
Conclusion
The plot that does not correctly describe the relationship between various thermodynamic quantities is the one showing Cp vs. Pressure.
- Heat Capacity at Constant Pressure (Cp): This is the amount of heat required to raise the temperature of a system by one degree Celsius at constant pressure.
- Heat Capacity at Constant Volume (Cv): This is the amount of heat required to raise the temperature of a system by one degree Celsius at constant volume.
1. Cp vs. Pressure (p):
- For an ideal gas, the heat capacity at constant pressure (Cp) does not change with pressure. Therefore, a plot showing Cp increasing with pressure is incorrect.
2. Cv vs. Volume (V):
- The heat capacity at constant volume (Cv) remains constant regardless of changes in volume for an ideal gas. Thus, a plot showing Cv changing with volume is also incorrect.
- The heat capacity at constant volume (Cv) can change with temperature, which is related to time if the system is undergoing a process. Therefore, a plot of Cv vs. time can be correct if it reflects changes in temperature.
- The plot that shows Cp vs. Pressure as a straight line increasing is the one that does not correctly describe the relationship, as Cp should remain constant with pressure for a diatomic ideal gas.
The plot that does not correctly describe the relationship between various thermodynamic quantities is the one showing Cp vs. Pressure.
Similar Questions
Knowledge Check
Which of the following plots is/are correctly labelled ?
A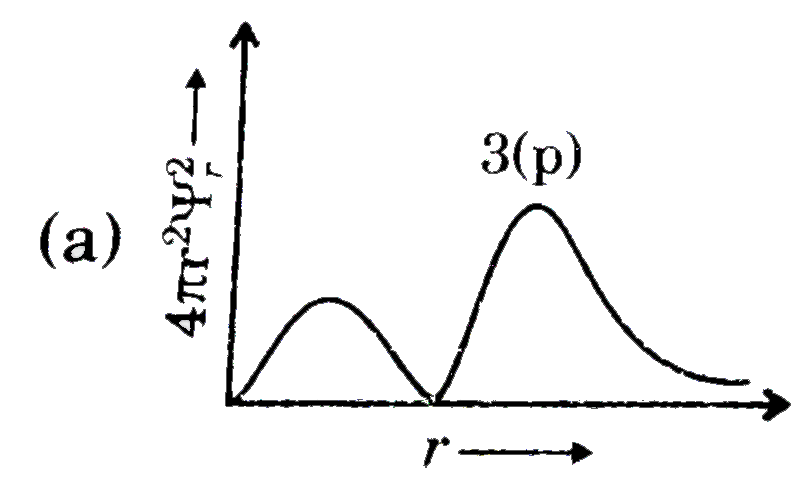 B
B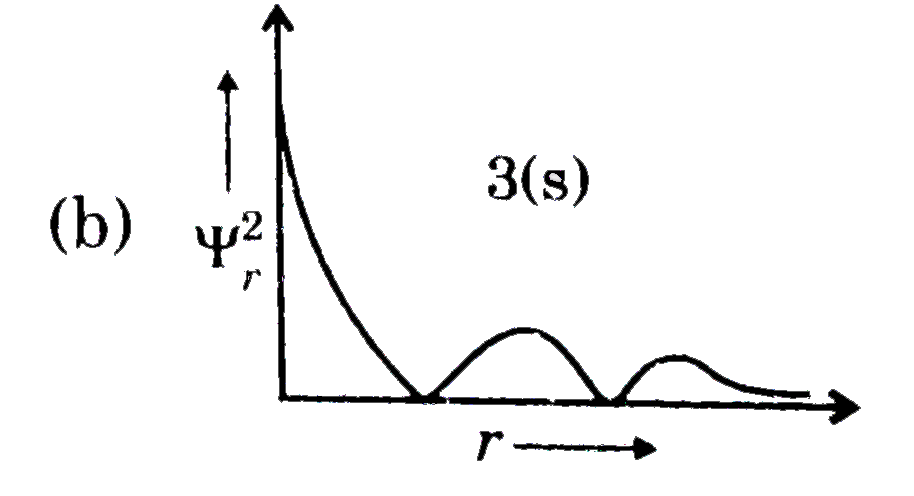 C
C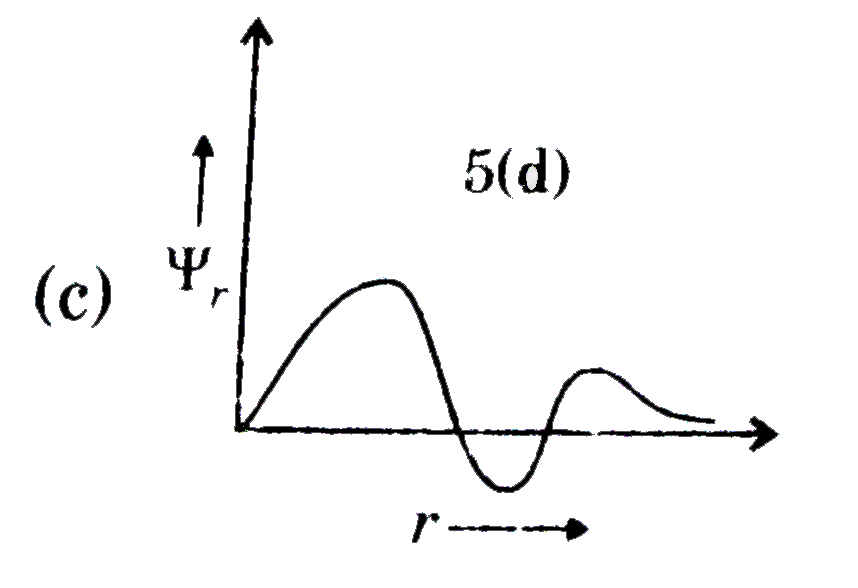 D
D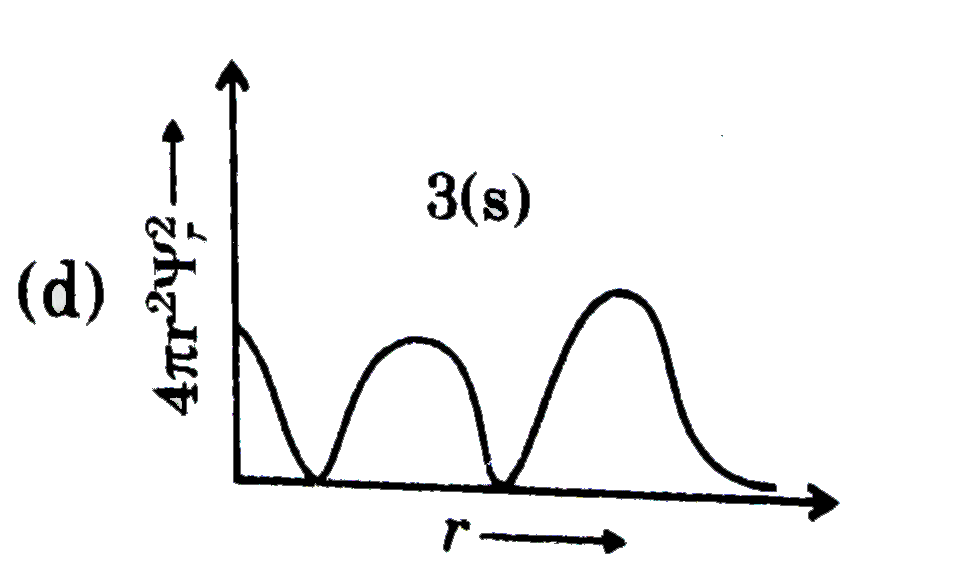
Which of the following plots are correct for an ideal gas ?
A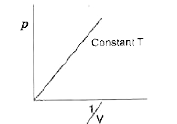 B
B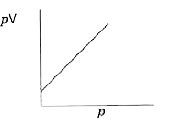 C
C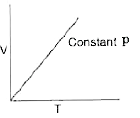 D
D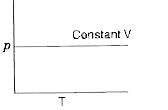
Which of the following is diatomic gas?
AAmmoniaBWaterCCarbon monoxideDPhosphine
Which one of the following equations does not correctly respresents the first law of thermodynamics for the given process?
View SolutionWhich one of the following equations does not correctly respresents the first law of thermodynamics for the given process?
View SolutionWhich of the following does not represent ideal gas equation?
View SolutionWhich one of the following equations does not correctly respresents the first law of thermodynamics for the given process?
View SolutionWhich of the following does not form stable diatomic molecule ?
View Solution
