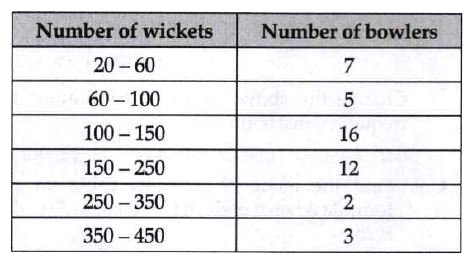
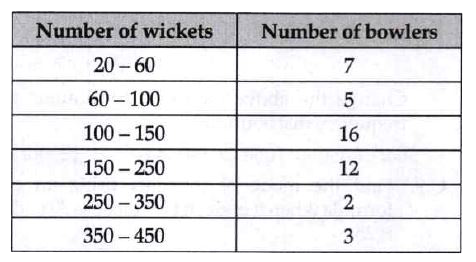
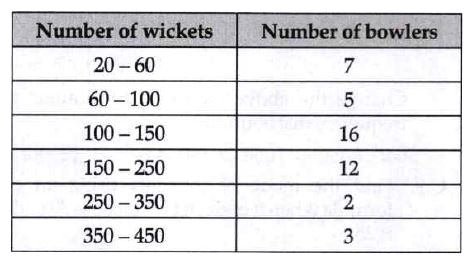
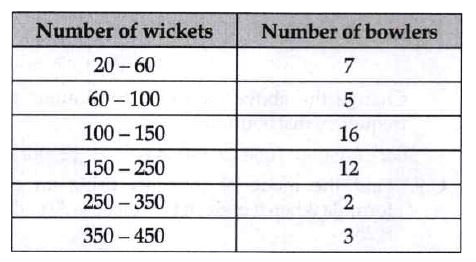
The distribution below shows the number of wickets taken by bowlers in one-day cricket matches. Find the mean number of wickets by choosing a suitable method. What does the mean signify?
To find the mean number of wickets taken by bowlers in one-day cricket matches using the step deviation method, we will follow these steps:
Step 1: Organize the Data
We have the following intervals and the corresponding number of bowlers:
- 20-60: 7 bowlers
- 60-100: 5 bowlers
- 100-150: 16 bowlers
- 150-250: 12 bowlers
- 250-350: 2 bowlers
- 350-450: 3 bowlers
Step 2: Calculate the Midpoint (xi) for Each Interval
The midpoint for each interval can be calculated as:
xi=Upper Limit+Lower Limit2
Calculating midpoints:
- For 20-60: x1=20+602=40
- For 60-100: x2=60+1002=80
- For 100-150: x3=100+1502=125
- For 150-250: x4=150+2502=200
- For 250-350: x5=250+3502=300
- For 350-450: x6=350+4502=400
Step 3: Choose an Assumed Mean (a)
We choose an assumed mean a=200 (which is one of the midpoints).
Step 4: Calculate the Deviation (di) for Each Midpoint
The deviation di is calculated as:
di=xi−a
Calculating deviations:
- d1=40−200=−160
- d2=80−200=−120
- d3=125−200=−75
- d4=200−200=0
- d5=300−200=100
- d6=400−200=200
Step 5: Calculate the Step Size (h)
The step size h is the difference between the upper and lower limits of the intervals. Here, we can take h=40 (from the interval 20-60).
Step 6: Calculate the ui Values
The ui values are calculated as:
ui=dih
Calculating ui:
- u1=−16040=−4
- u2=−12040=−3
- u3=−7540=−1.875
- u4=040=0
- u5=10040=2.5
- u6=20040=5
Step 7: Calculate the Product of fi and ui
Now, we multiply the number of bowlers (fi) by the corresponding ui:
- For 20-60: 7×−4=−28
- For 60-100: 5×−3=−15
- For 100-150: 16×−1.875=−30
- For 150-250: 12×0=0
- For 250-350: 2×2.5=5
- For 350-450: 3×5=15
Step 8: Calculate Summation of fi and Summation of fi * ui
Now we calculate:
- Σfi=7+5+16+12+2+3=45
- Σfiui=−28−15−30+0+5+15=−53
Step 9: Calculate the Mean
The mean is given by the formula:
Mean=a+ΣfiuiΣfi×h
Substituting the values:
Mean=200+−5345×40
Mean=200−212045
Mean=200−47.11
Mean≈152.89
Conclusion
The mean number of wickets taken by a bowler is approximately 152.89. This mean signifies the average number of wickets taken by bowlers in the given data set.
---
We have the following intervals and the corresponding number of bowlers:
- 20-60: 7 bowlers
- 60-100: 5 bowlers
- 100-150: 16 bowlers
- 150-250: 12 bowlers
- 250-350: 2 bowlers
- 350-450: 3 bowlers
The midpoint for each interval can be calculated as:
xi=Upper Limit+Lower Limit2
- For 20-60: x1=20+602=40
- For 60-100: x2=60+1002=80
- For 100-150: x3=100+1502=125
- For 150-250: x4=150+2502=200
- For 250-350: x5=250+3502=300
- For 350-450: x6=350+4502=400
We choose an assumed mean a=200 (which is one of the midpoints).
The deviation di is calculated as:
di=xi−a
- d1=40−200=−160
- d2=80−200=−120
- d3=125−200=−75
- d4=200−200=0
- d5=300−200=100
- d6=400−200=200
The step size h is the difference between the upper and lower limits of the intervals. Here, we can take h=40 (from the interval 20-60).
The ui values are calculated as:
ui=dih
- u1=−16040=−4
- u2=−12040=−3
- u3=−7540=−1.875
- u4=040=0
- u5=10040=2.5
- u6=20040=5
Now, we multiply the number of bowlers (fi) by the corresponding ui:
- For 20-60: 7×−4=−28
- For 60-100: 5×−3=−15
- For 100-150: 16×−1.875=−30
- For 150-250: 12×0=0
- For 250-350: 2×2.5=5
- For 350-450: 3×5=15
Now we calculate:
- Σfi=7+5+16+12+2+3=45
- Σfiui=−28−15−30+0+5+15=−53
The mean is given by the formula:
Mean=a+ΣfiuiΣfi×h
Mean=200+−5345×40
Mean=200−212045
Mean=200−47.11
Mean≈152.89
The mean number of wickets taken by a bowler is approximately 152.89. This mean signifies the average number of wickets taken by bowlers in the given data set.
Topper's Solved these Questions
- BOOK - NCERTCHAPTER - STATISTICSEXERCISE - EXERCISE 14.43videos
STATISTICS
- BOOK - NCERTCHAPTER - STATISTICSEXERCISE - EXERCISE 14.26videos
STATISTICS
- BOOK - NCERTCHAPTER - STATISTICSEXERCISE - EXERCISE 14.19videos
STATISTICS
- BOOK - NCERTCHAPTER - SOME APPLICATIONS OF TRIGONOMETRYEXERCISE - SOLVED EXAMPLES7videos
SOME APPLICATIONS OF TRIGONOMETRY
- BOOK - NCERTCHAPTER - SURFACE AREAS AND VOLUMESEXERCISE - EXERCISE 13.28videos
SURFACE AREAS AND VOLUMES
Similar Questions
Knowledge Check
- Question 1 - Select One
The data below shows the number of students in class A having secured different marks.
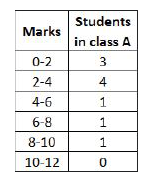
What is the mean marks of class A?A2B3.8C2.8D1.6
The distribution given below shows the number of wickets taken by bowlers in one-day cricket matches . Find the mean and the median of the number of wickets taken
 View Solution
The distribution below show the number of wickets taken by bowlers in one-day cricket matches.
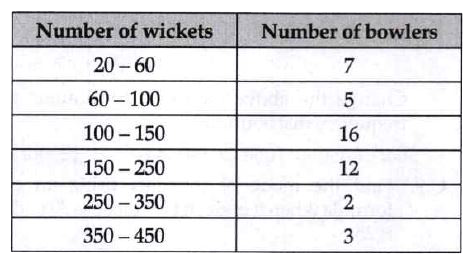
How many bowlers take less than 150 wickets?View Solutionthe distribution given below shows the number of wickets taken by bowlers in one-day cricket matches. find the mean and the median of the number of wickets taken
View SolutionThe distribution below show the number of wickets taken by bowlers in one-day cricket matches.
How many bowlers take more than or equal to 150 wickets ?View SolutionThe distribution below show the number of wickets taken by bowlers in one-day cricket matches.
How many bowlers take more than or equal to 20 and less than 350 wickets?View SolutionThe given distribution shows the number of runs scored by some top batsmen of the world in one-day international cricket matches.Find the mode of the data.
View SolutionThe wickets taken by a bowler in 10 cricket matches are as follows:2 6 4 5 0 2 1 3 2 3Find the mode of the data.
View Solution


