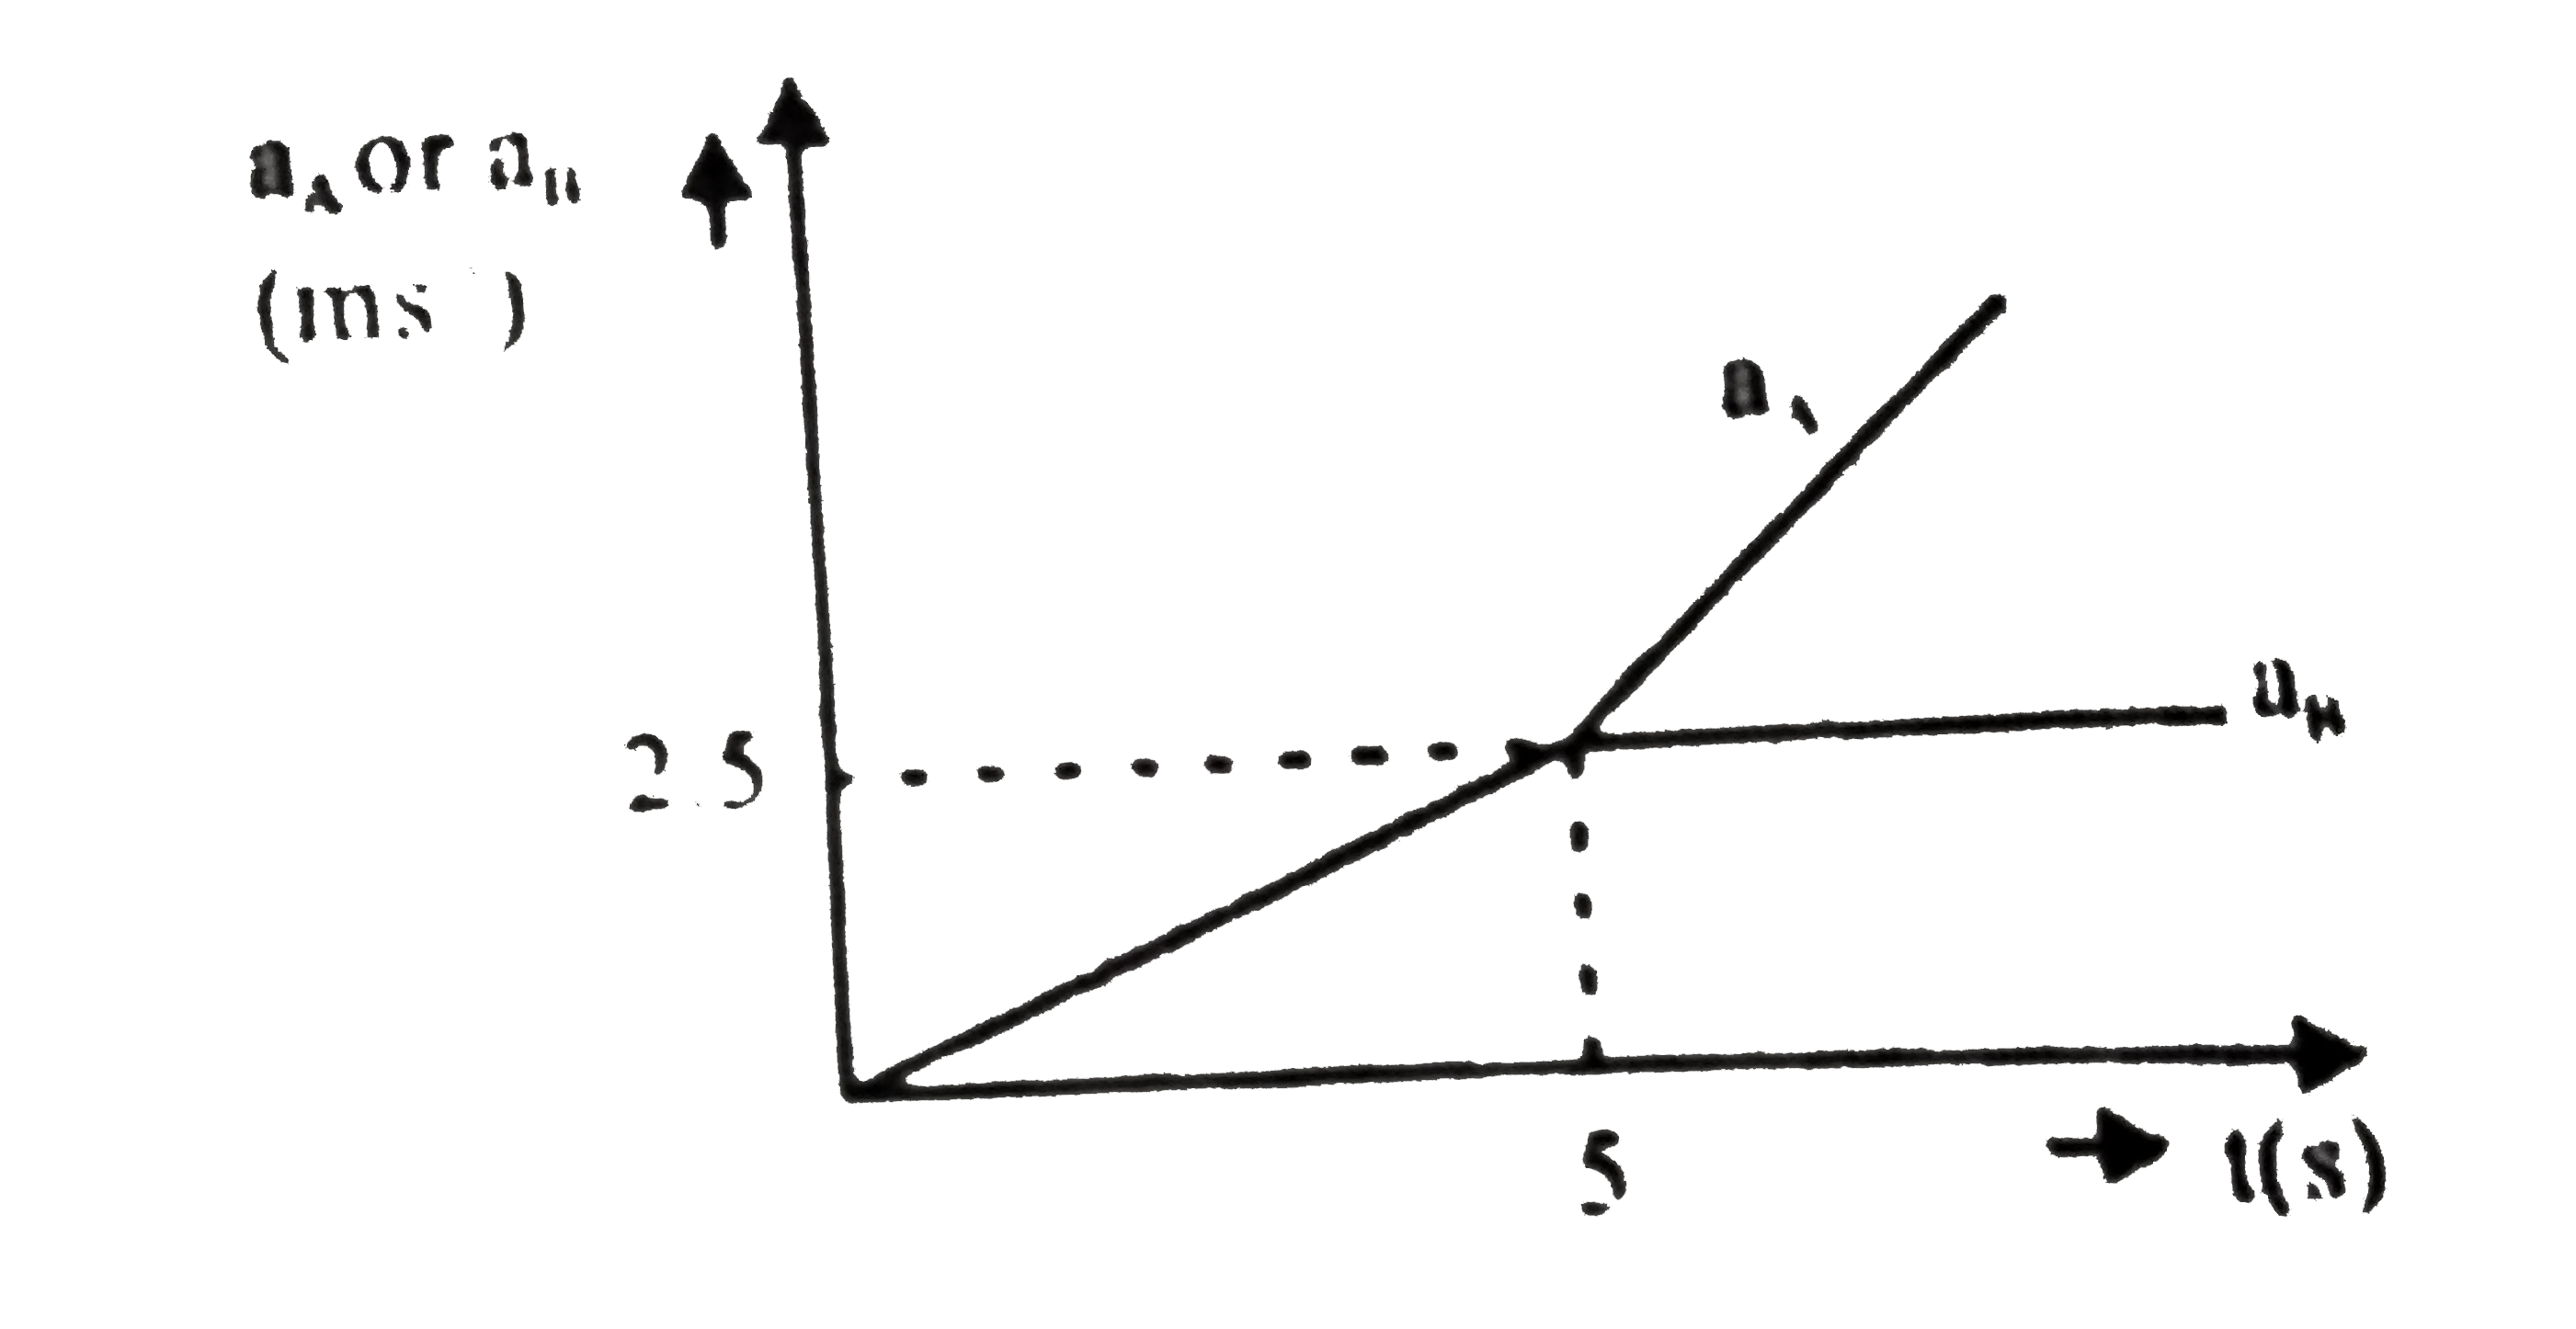
For shown situation draw a graph showing accelerations of A and B on y-axis and time of x-axis. (g=10ms−2)

limiting friction between A & B, f1=μmAg=(12)(2)(10)=10N
Block B moves due to friction only. So maximum acceleration of B,
amax=fLmB=1042.5ms−2
So both the blocks move together till the common acceleration becomes 2.5ms−2 after that acceleations of B will become constant while that of A will go on increasing. Slipping will starts between A & B at 2.5ns−2
⇒2.5=FmA+mB=3t6⇒t=5s
Hence for t≤5s,aA=aB=FmA+mB=3t6=t2
and for t>5saB=2.5ms−2,aA=F−f1mA=3t−102=32t−5
Topper's Solved these Questions
- BOOK - ALLENCHAPTER - NEWTON'S LAWS OF MOTION & FRICTIONEXERCISE - EXERCISE (S-1)26videos
NEWTON'S LAWS OF MOTION & FRICTION
- BOOK - ALLENCHAPTER - NEWTON'S LAWS OF MOTION & FRICTIONEXERCISE - EXERCISE (S-2)9videos
NEWTON'S LAWS OF MOTION & FRICTION
- BOOK - ALLENCHAPTER - MOTION IN A PALNEEXERCISE - SOLVED EXAMPLE28videos
MOTION IN A PALNE
- BOOK - ALLENCHAPTER - NEWTONS LAWS OF MOTIONEXERCISE - EXERCISE-III28videos
NEWTONS LAWS OF MOTION
Similar Questions
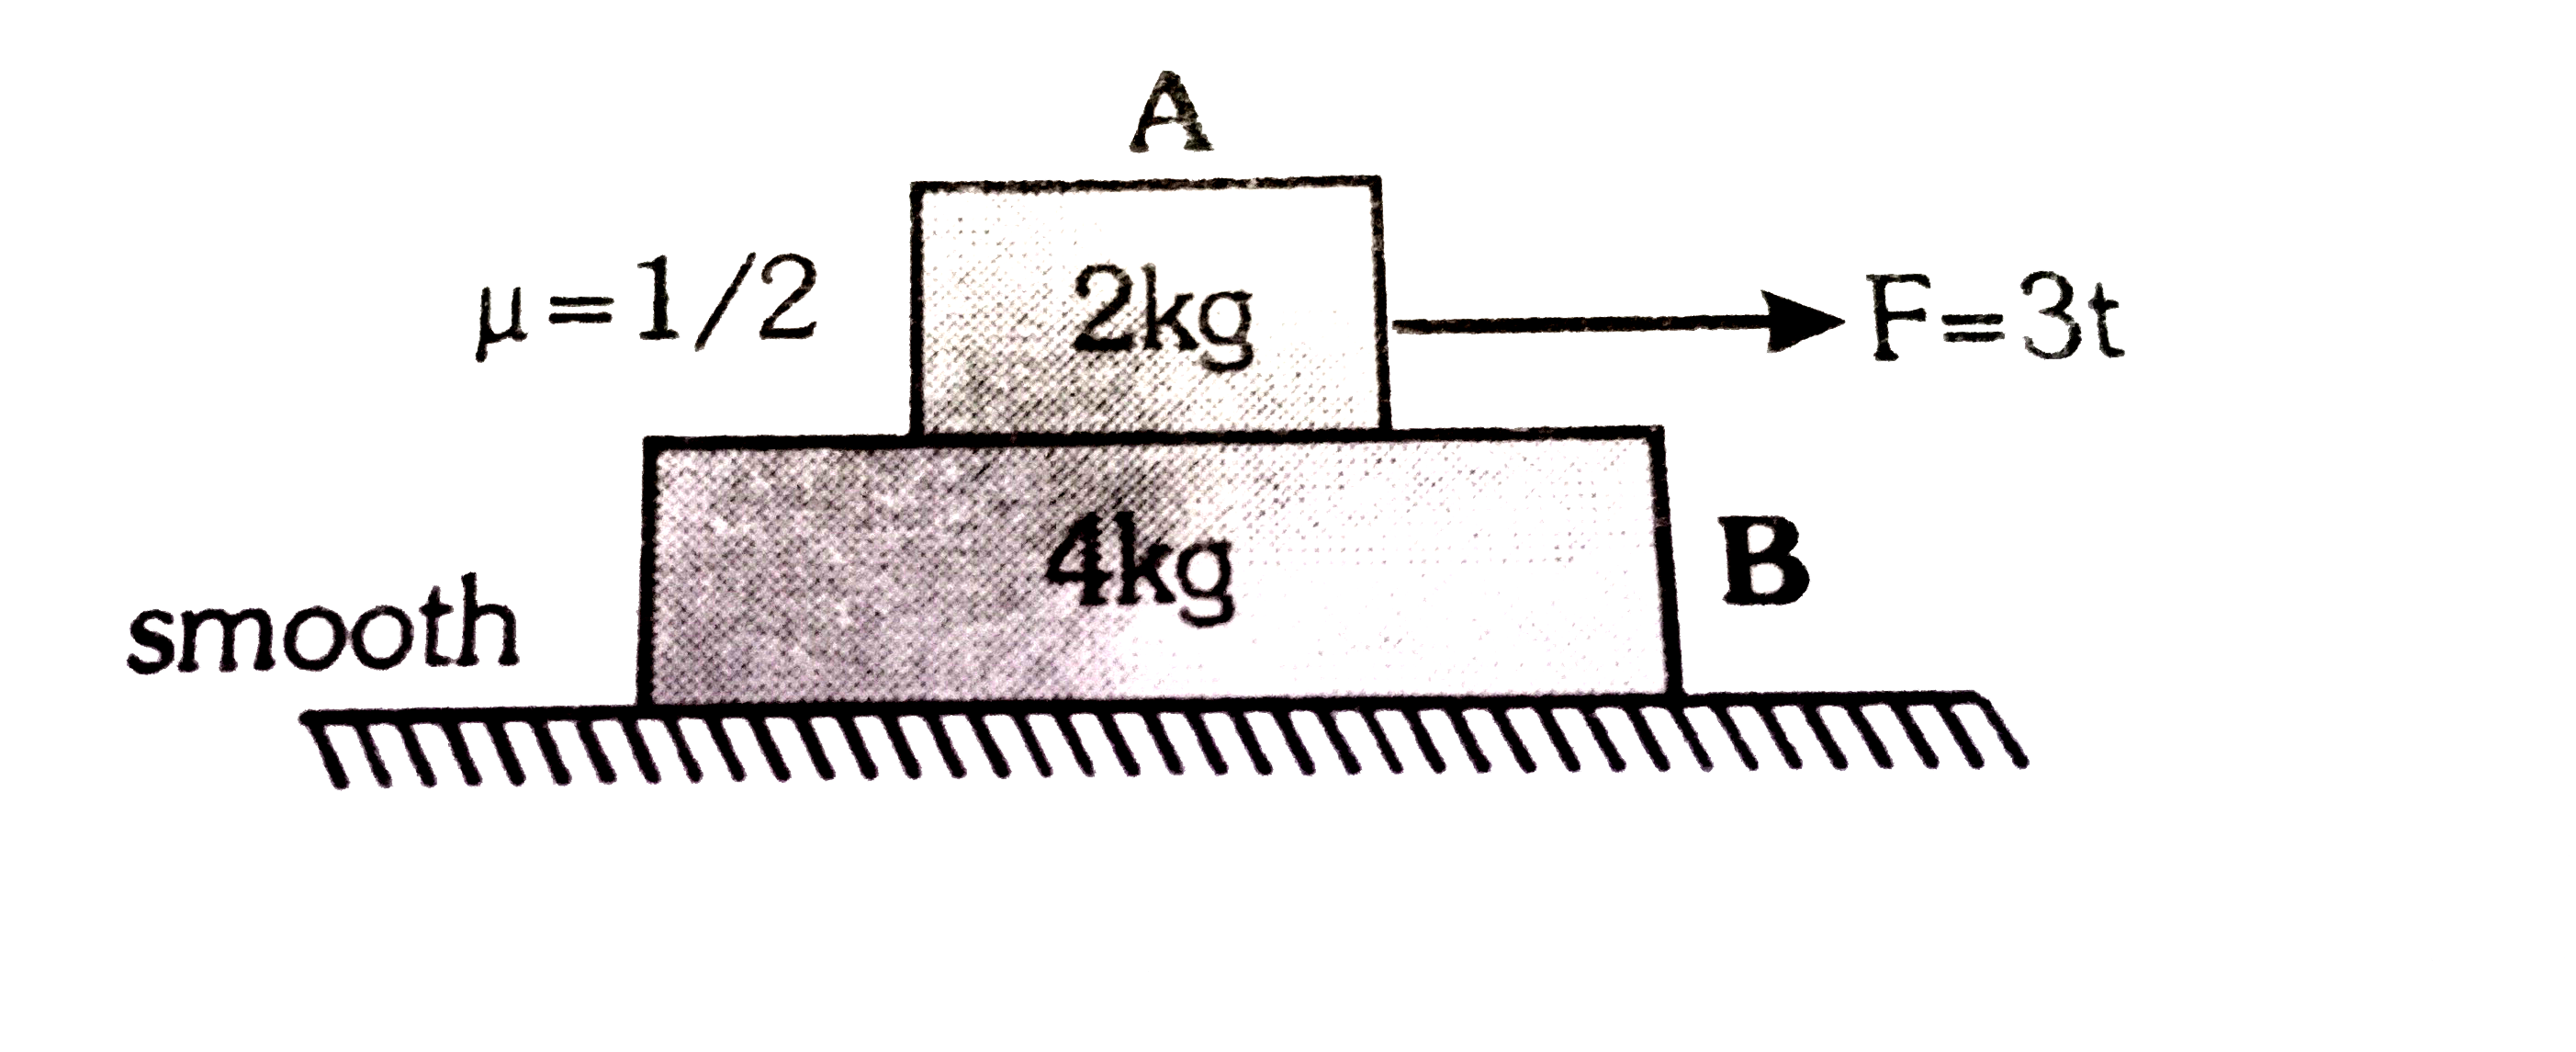
For shown situation draw a graph showing acceleration of A and B on y-axis and time on x-axis (g=10ms−2)
 View Solution
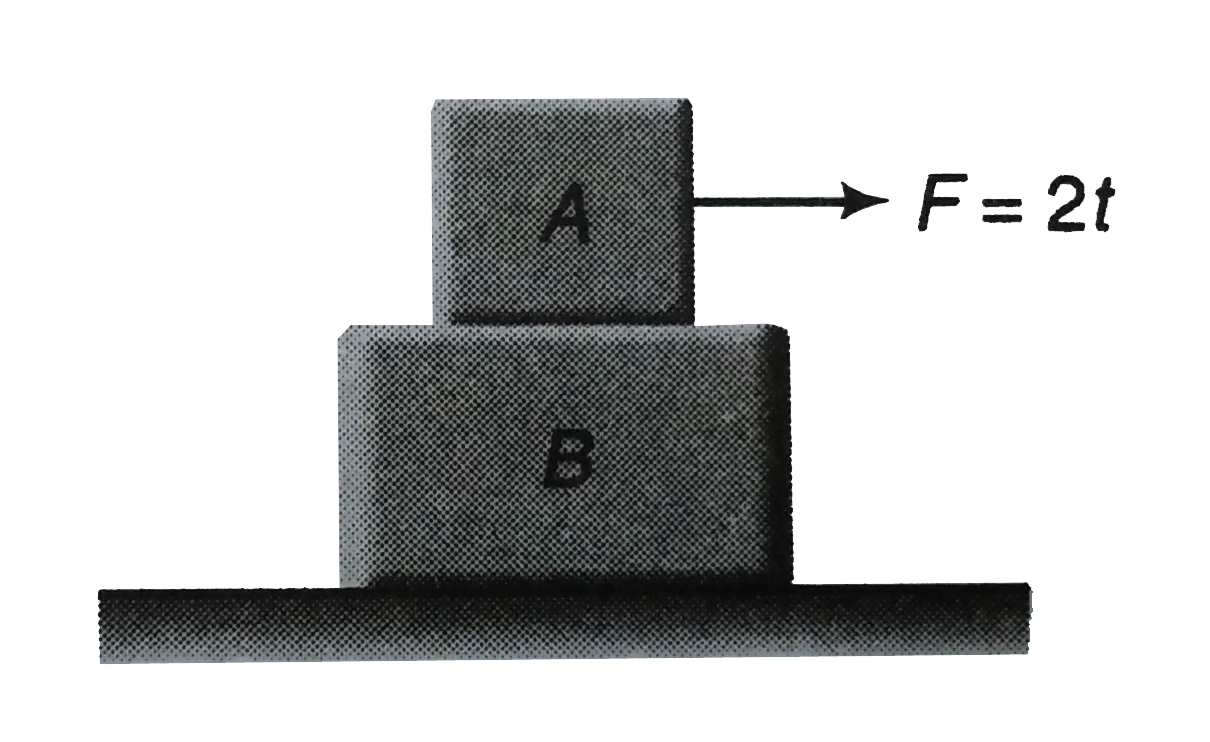
Two blocks A and B of masses 2kg and 4kg are placed one over the other as shown in figure. Atime varying horizontal force F=2t is applied on the upper block as shown in figure. Here t is in second and F is in newton. Drow a graph showing acceleration of A and B on y-axis and time on x-axis.Coefficient of friction between A and B is μ=12 and the horizontal surface over which B is placed smooth. (g=10m/s2)
 View Solution
Knowledge Check
- Question 1 - Select One
If the particle in linear S.H.M. starts from the extreme left position, then its equation of motion is given by
A B
B C
C D
D
- Question 2 - Select One
For a zero order reaction a graph of conc. (along Y axis) and time (along X-axis) is linear with
Aa +ve slope and a non - zero Y- interceptBa −ve slope with a non - zero Y-interceptCa +ve slope with a zero Y - interptDa −ve slopw with a zero Y-intercept - Question 3 - Select One
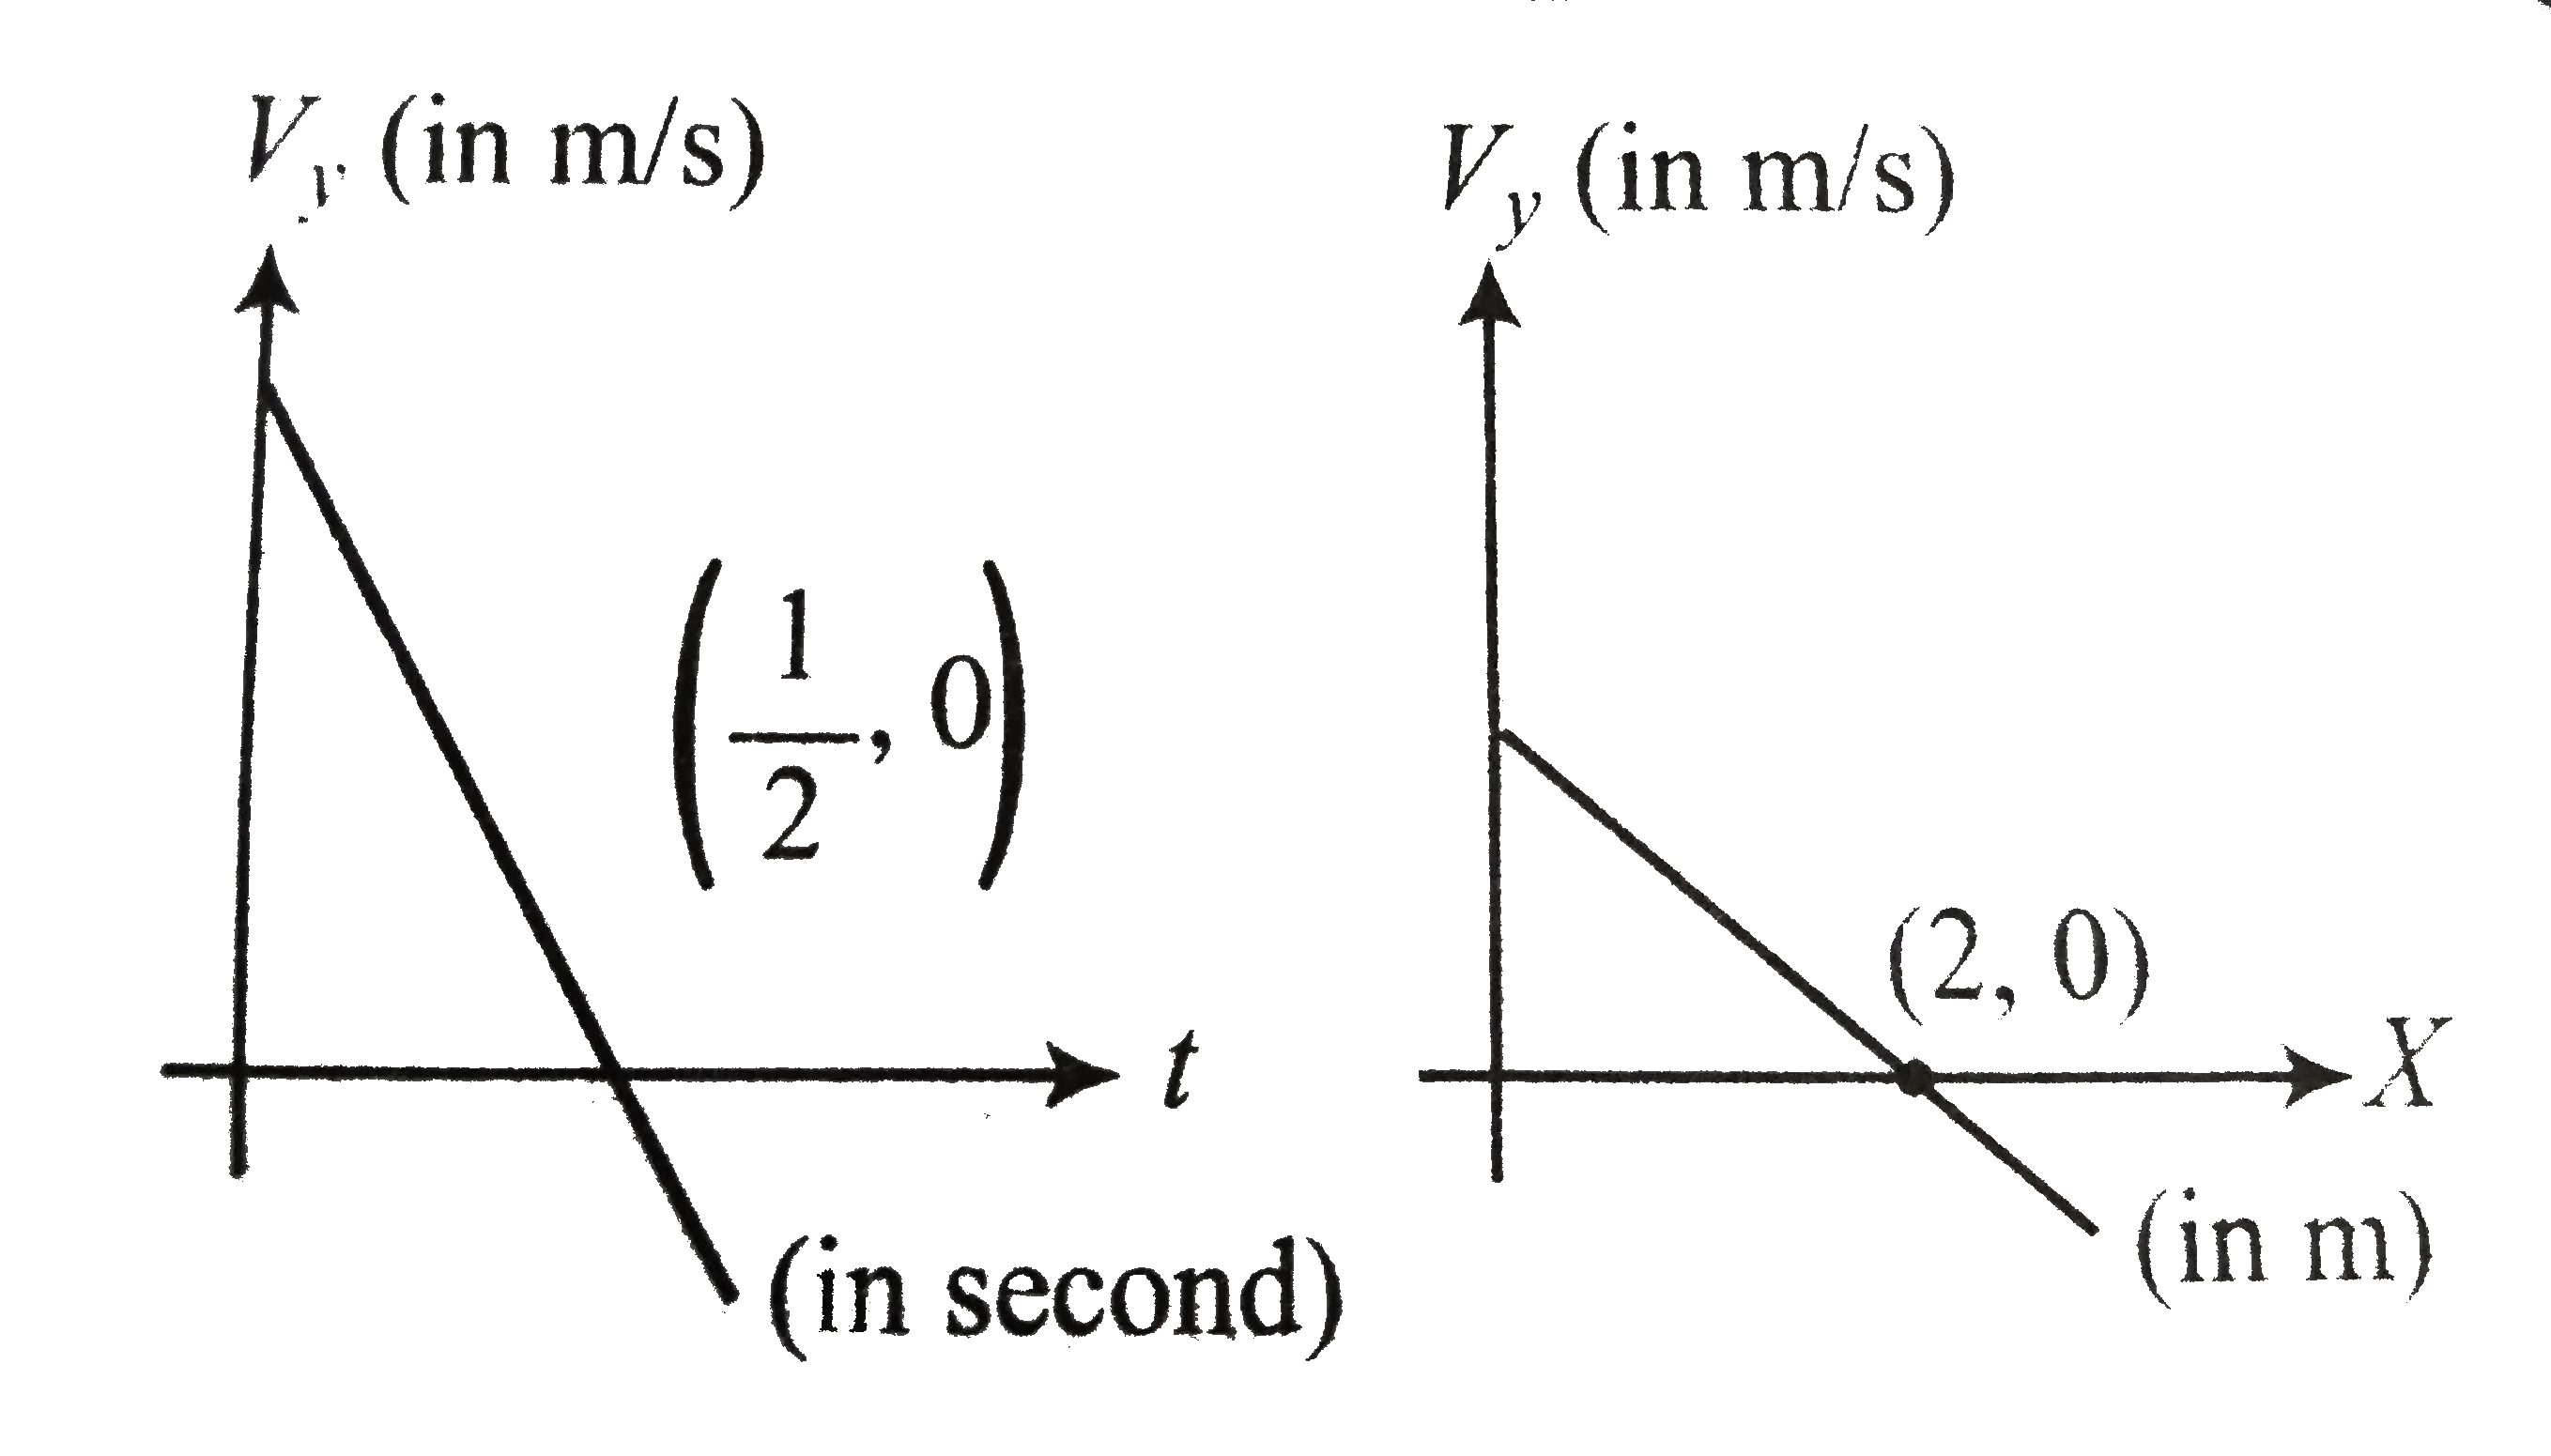
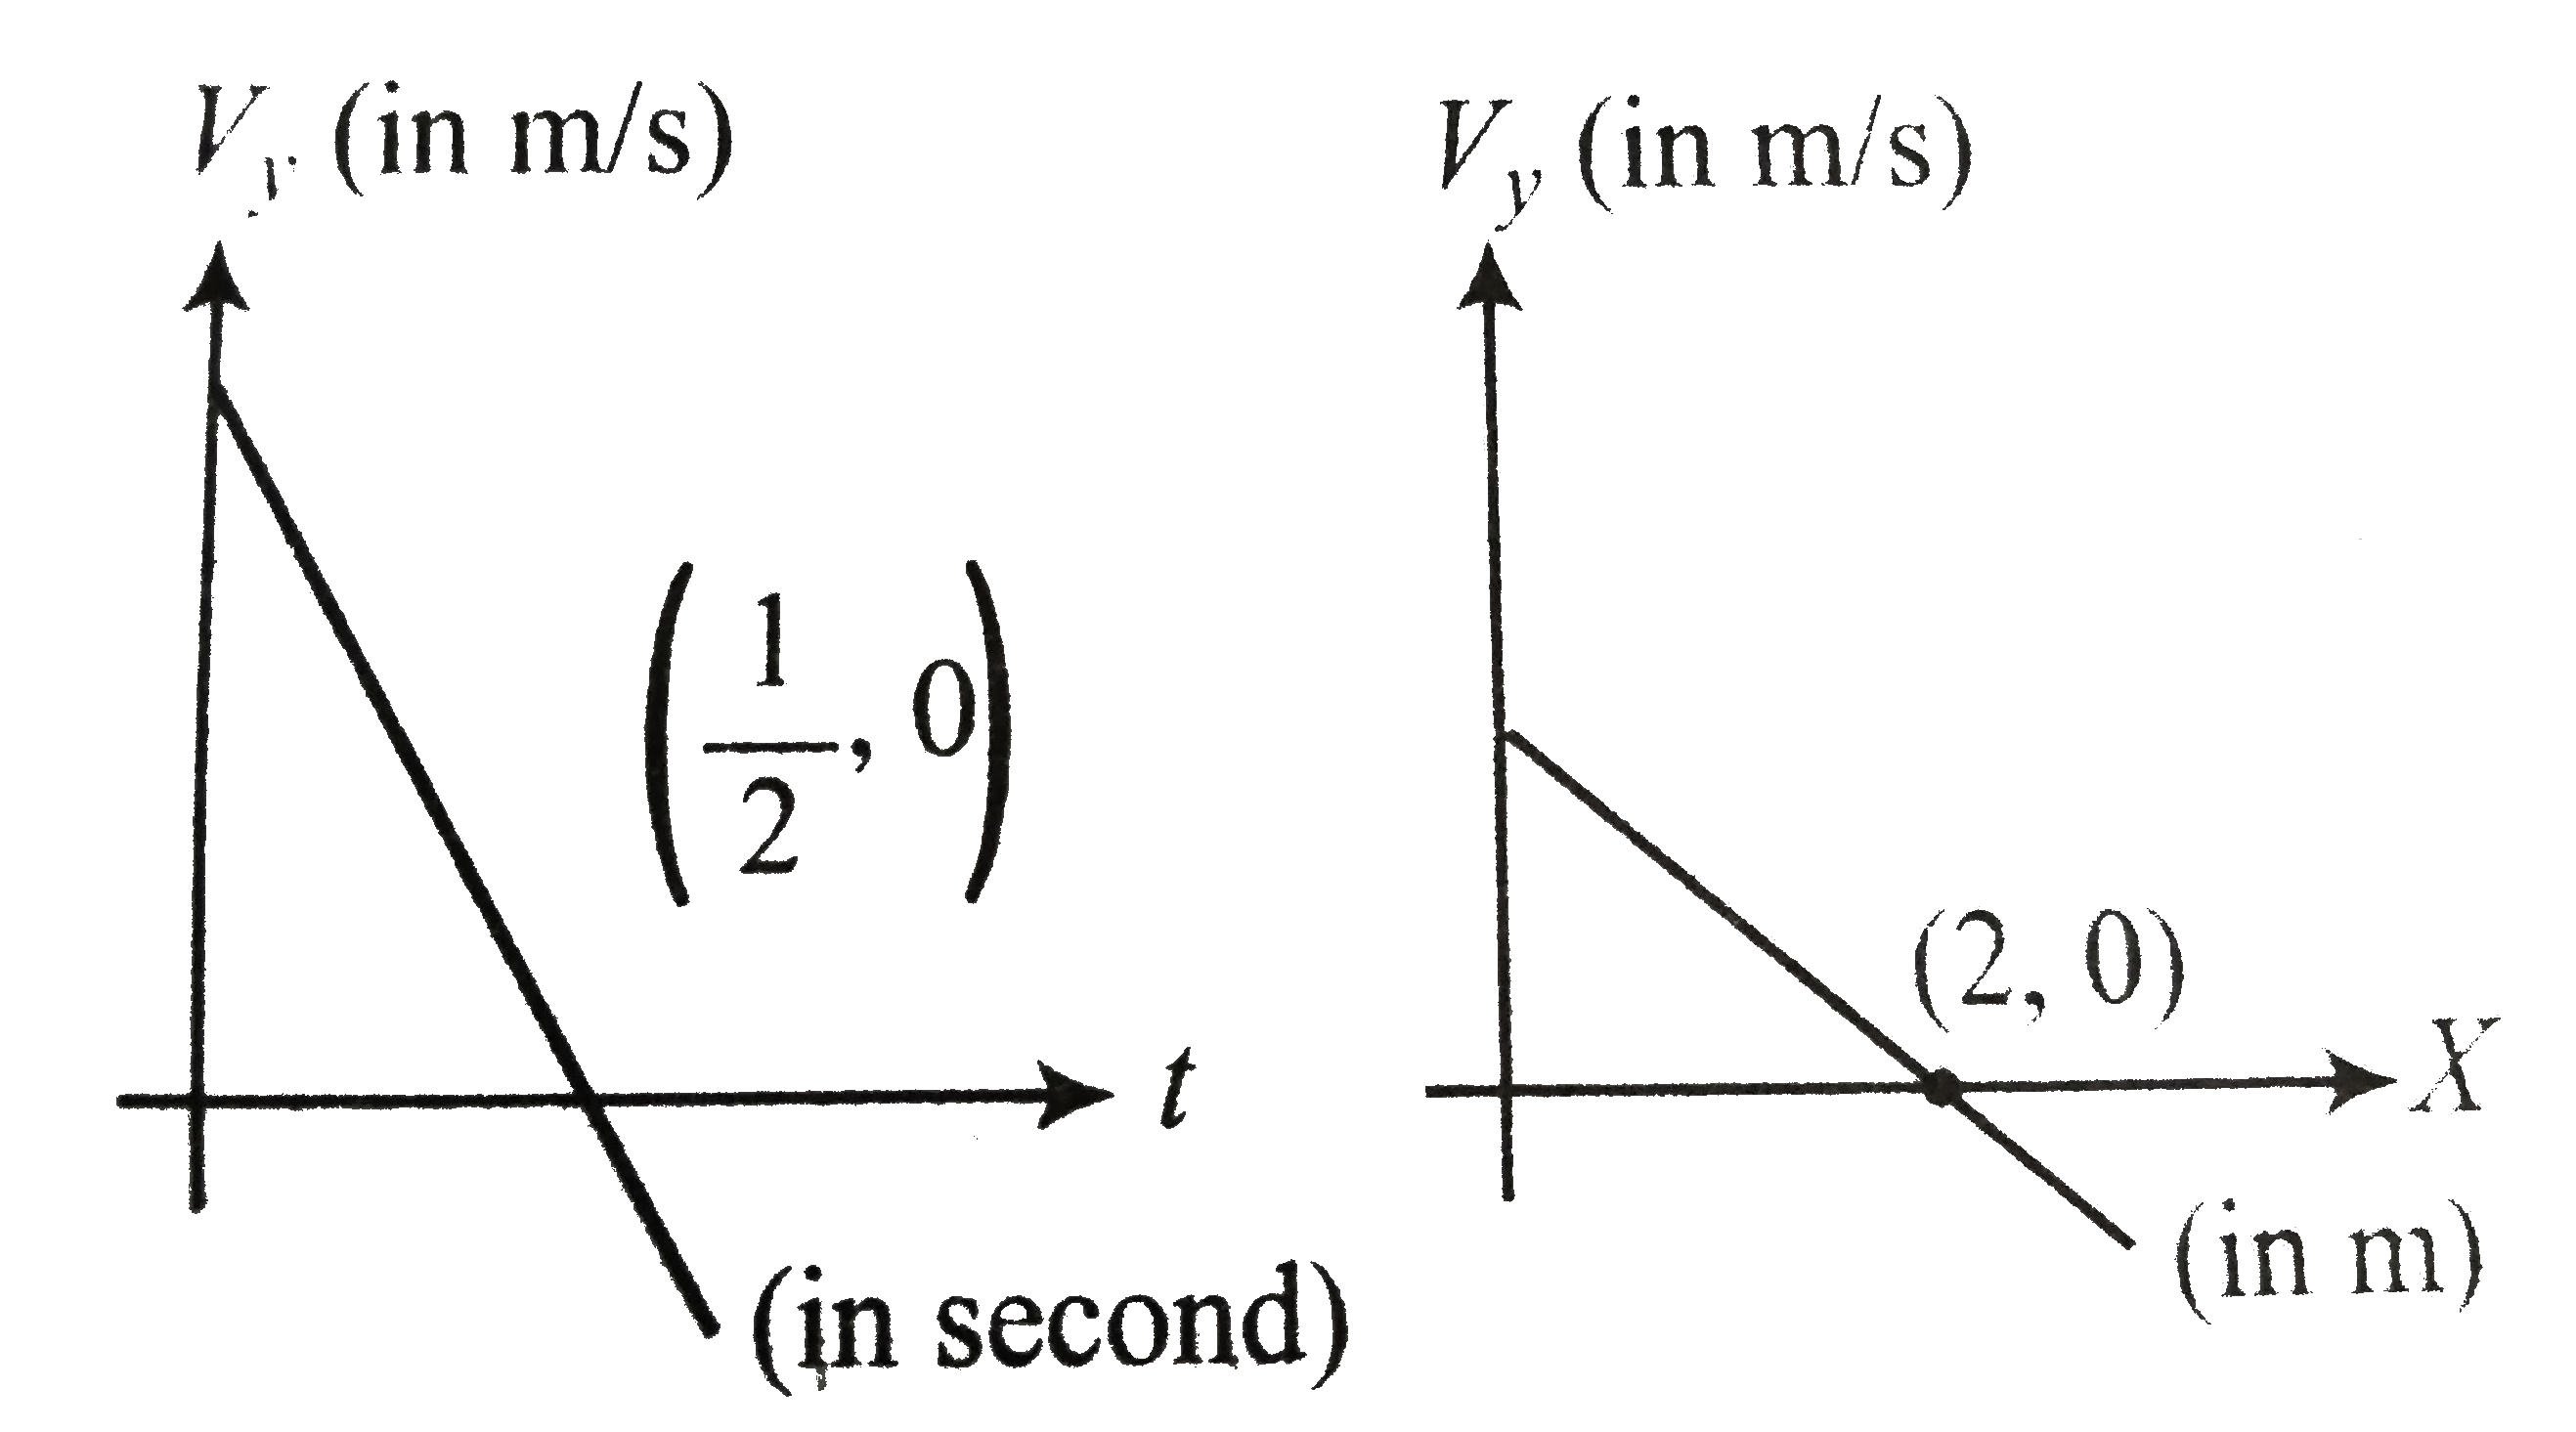
Two graphs of the same projectile motion (in the xy-plane) projected from origin are shown. X-axis is along horizontal direction and y-axis is vertically upwards. Take g=10ms−2.
 ,
,
The projection speed is :A√37ms−1B√41ms−1C√14ms−1D√40ms−1
A particle starts with uniform acceleration. Draw a graph taking the displacement(s) of the particle along y-axis and time(t) along x-axis. What is the curve known as?
View SolutionA body starts from the origin with an acceleration of 6ms−1 along the x - axis and 8ms−1 along the y - axis. Find its distance from the origin after 4s.
View SolutionTwo graphs of the same projectile motion (in the xy-plane) projected from origin are shown. X-axis is along horizontal direction and y-axis is vertically upwards. Take g=10ms−2.
Projection angle with the horizontal is :View SolutionThe slope of the graph showing the variation of potential difference V on X-axis and current Y-axis gives conductor
View SolutionTwo graphs of the same projectile motion (in the xy-plane) projected from origin are shown. X-axis is along horizontal direction and y-axis is vertically upwards. Take g=10ms−2.
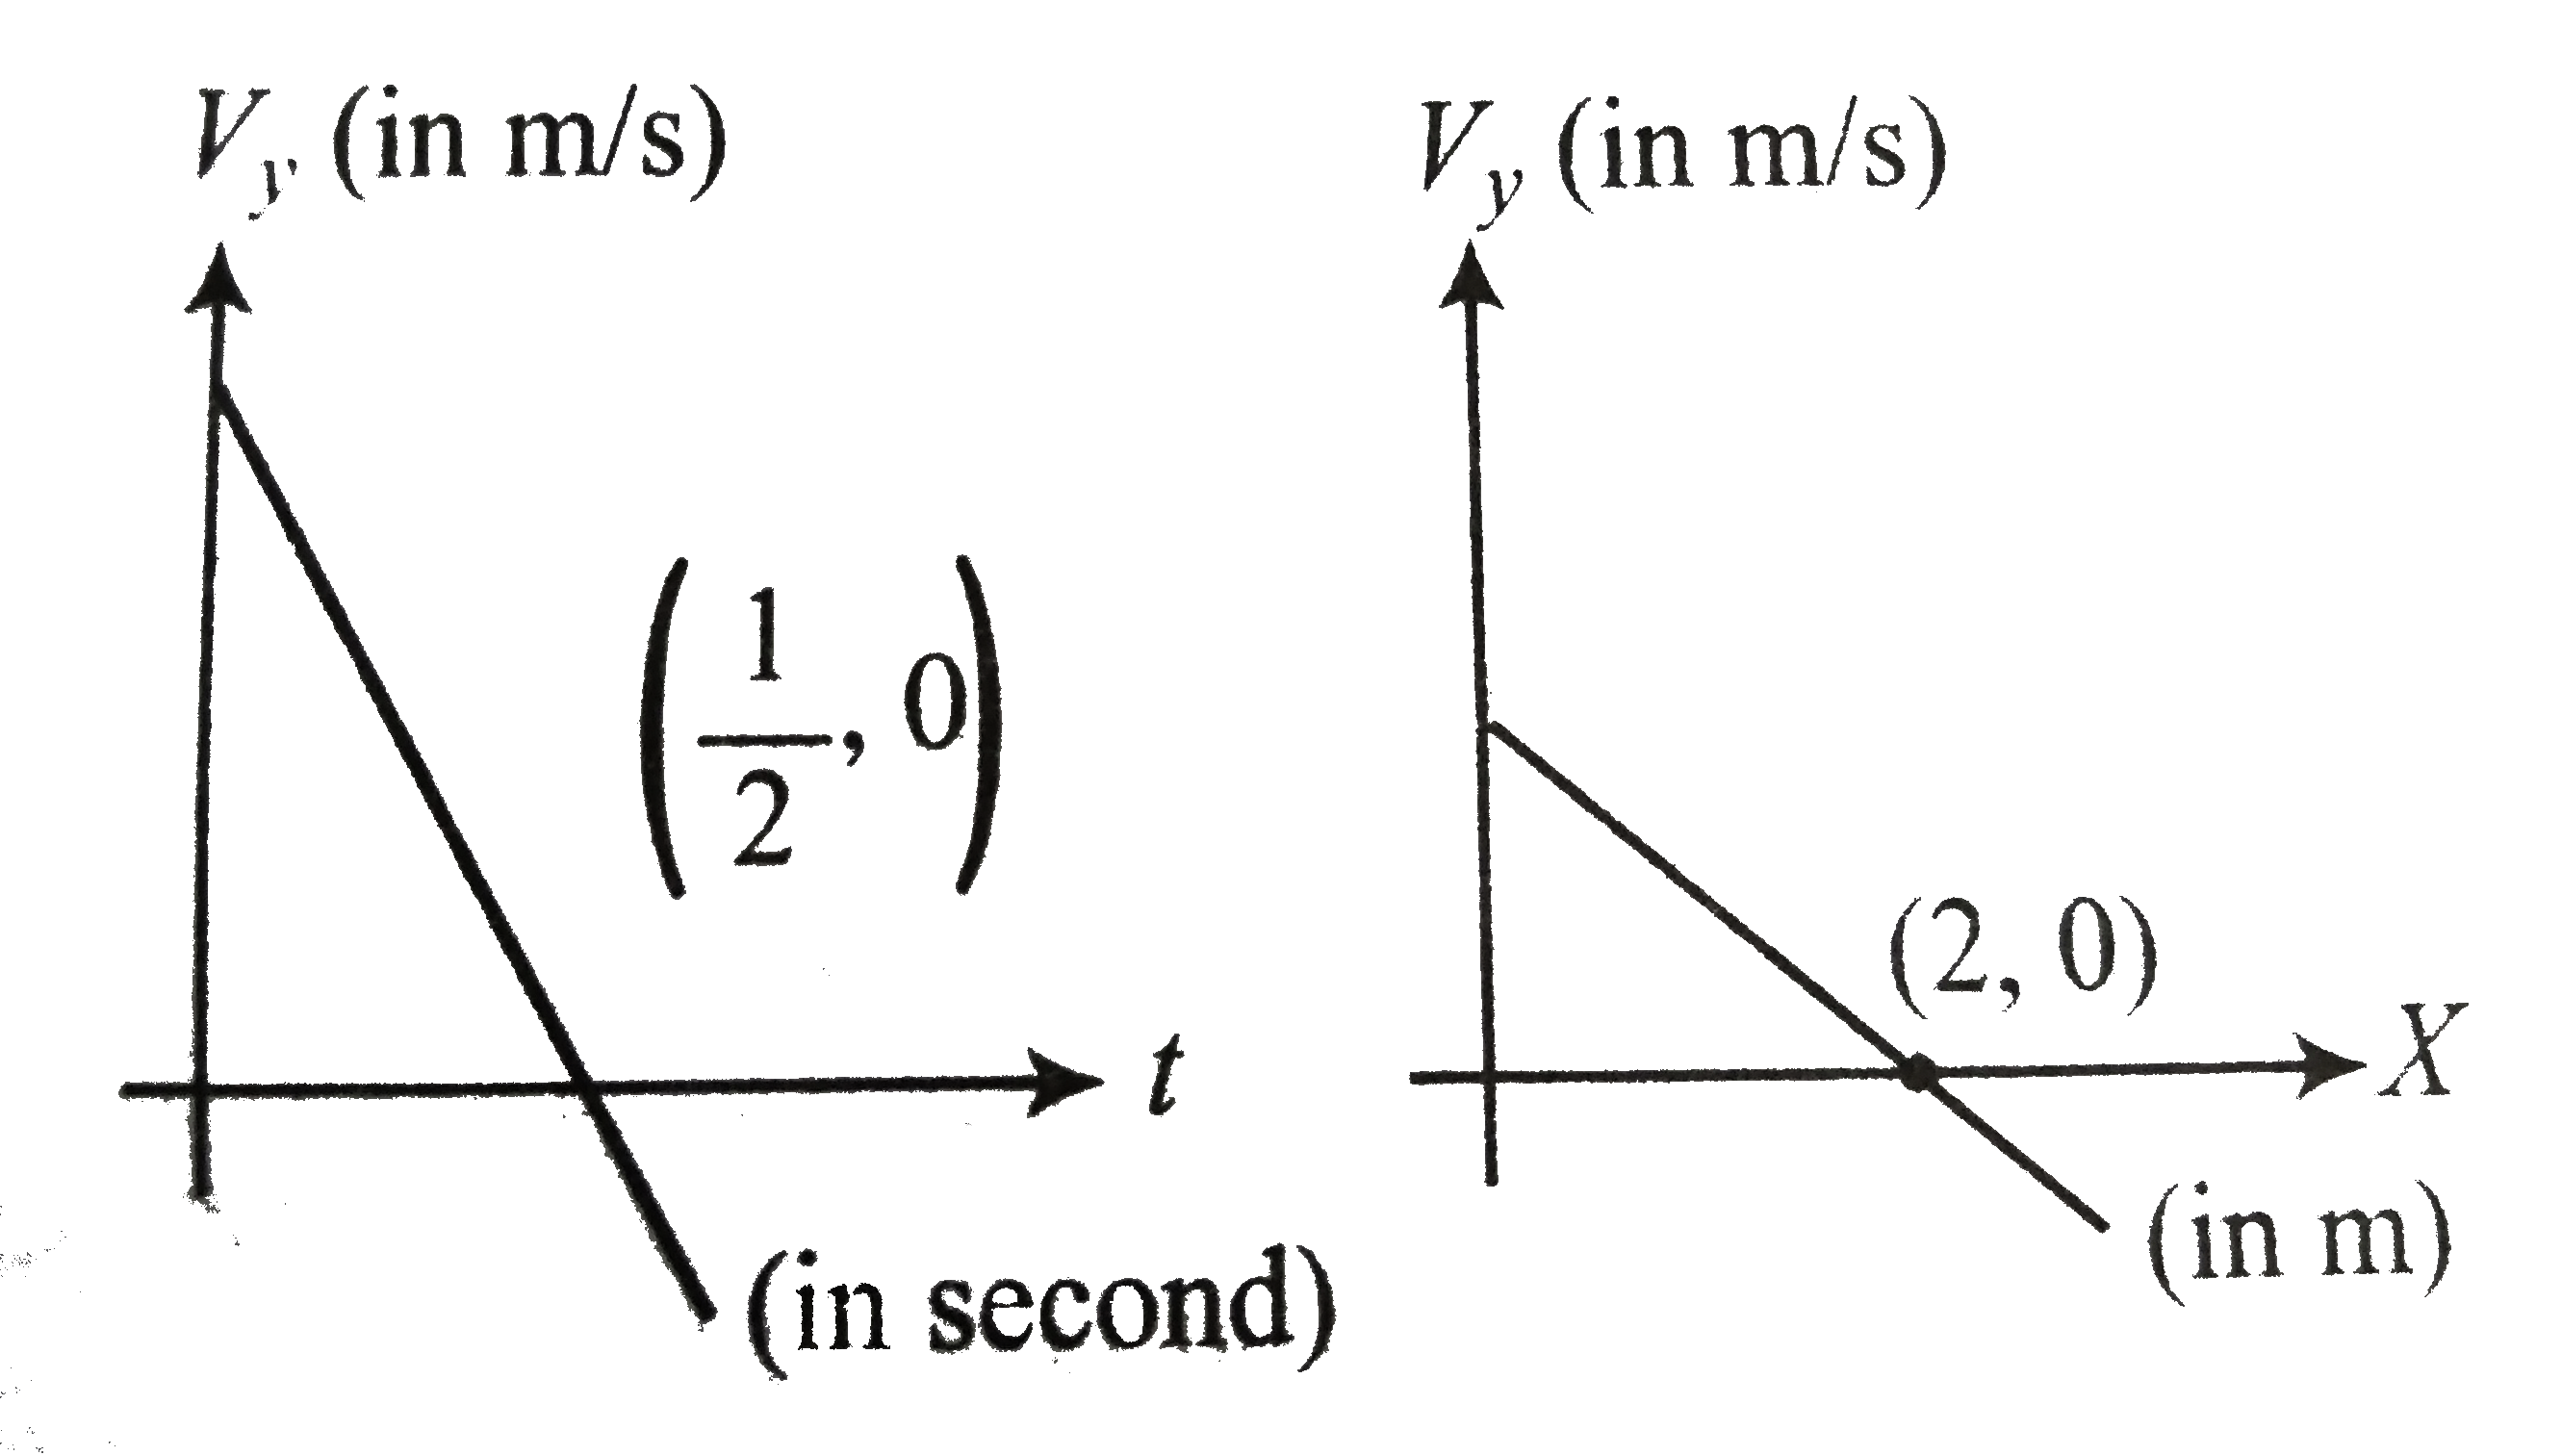 ,
,
Maximum height attained from the point of projection isView Solution

