The number of students who absented from the class cluring a week are given below:

Step by step video & image solution for The number of students who absented from the class cluring a week are given below: by Maths experts to help you in doubts & scoring excellent marks in Class 6 exams.
Topper's Solved these Questions
Similar Questions
The table given below shows the number of students who were absent and percentage of students who were present in the given two examinations from five different schools. The table also shows the percentage of students who were present in the Biology and Physics examination respectively.

The number of students who were present in Physics examination from school M is what per cent of number of students who were absent from schools M, L and O?View SolutionThe table given below shows the number of students who were abset and percentage of students who were present in the given two examination from five different of students who were present in the Biology and Physics examination respectively.
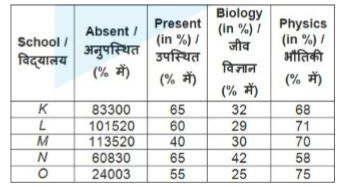
Number of students who were present in Physics examination from school M is what percent of number of students who were absent from school M, L and O?View Solution
Knowledge Check
- Question 1 - Select One
In a class, there are 100 students. Of them, 60 students attend music classes, 40 students attend dance classes, and 20 students attend both the classes. Find the number of students who attend neither of the classes.
The following steps are involved in solving the above problem. Arrange them in sequential order
(A) n(M∪D)=n(M)+n(D)−n(M∪D)→n(M∩D)→n(M∪D)=60+40−20=100−20=80
( B) ∴Number of students who attend neither of the classes = 100 - 80 = 20
( C) n(M)=60,n(D)=40andn(M∩D)=20(given)
(D) Let n(M) be the number of students who attend music classes and n(D) be the number of students who attend dance classes.ADACBBDCBACACDBDDCAB
The table given below shows the number of students who were absent and percentage of students who were present in the given two examinations from five different schools. The table also shows the percentage of students who were present in the Biology and Physics examination respectively.

If the number of students who were present in the Physics examination from school A is 250% of the difference of the number of the students who were present in Physics and bilogy examination, from school K, then what is the ratio of the number of students who were present from school L to number of students who were present in Physics examination from school A?View SolutionThe table given below shows the number of students who were absent and percentage of students who were present in the given two examinations from five different schools. The table shows the percentage of students who were present in the Biology and Physics examination respectively.
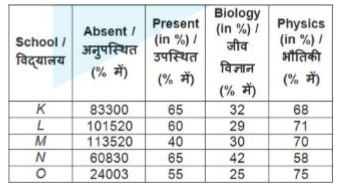
If the number of students who were present in the Physics examination from school A is 250% of the difference of the number of the students who were present in Physics and Biology examination, from school K, then what is the ratio of the number of students who were present from school L to number of students who were present in Physics examination from school A?View SolutionThe table given below shows the number of students who were absent and percentage of students who were present in the given two examinations from five different schools. The table also shows the percentage of students who were present in the Biology and Physics examination respectively.

What is the average of the number of the students who were of the students who were present in Physics examination from schools N. K and L?View SolutionThe table given below shows the number of students who were absent and percentage of students who were present in the given two examinations from five different schools. The table also shows the percentage of students who were present in the Biology and Physics examination respectively.

What is the difference between the number of students who were present in Physics and that in Biology examination from school N?View SolutionThe table given below shows the number of students who were absent and percentage of students who were present in the given two examinations from five different schools. The table also shows the percentage of students who were present in the Biology. And Physics examination respectively.
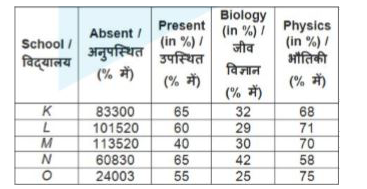 What is the average of the number of the students who were present in Physics examination from school N, K and L?View Solution
The bar graph below shows the percentage break-up of the number of student who visited various touris spots on new Year evening.
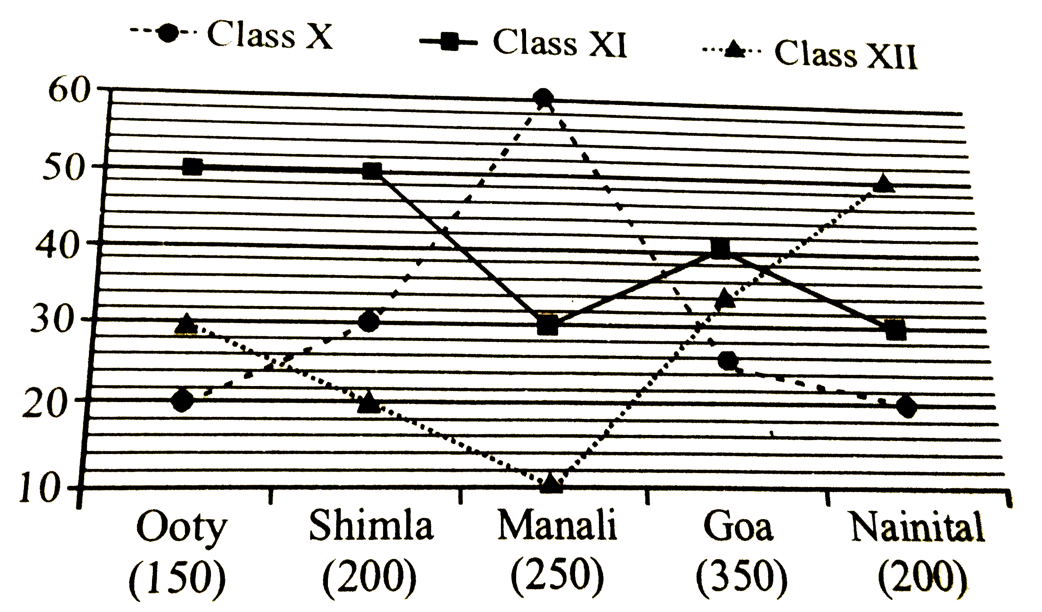
The table shows the total numbers of students om classes X,XI and XII .
ClassNo. of studentsX420XI480XII400
If the ratio of girls and boys, who went to Manali from class X, was 7:8 , then what percent of the total number of students from class X who went to a turist spot is the number of girls who went to Manali ? (approximate)View SolutionThe bar graph below shows the percentage break-up of the number of student who visited various tourist spots on new Year evening.
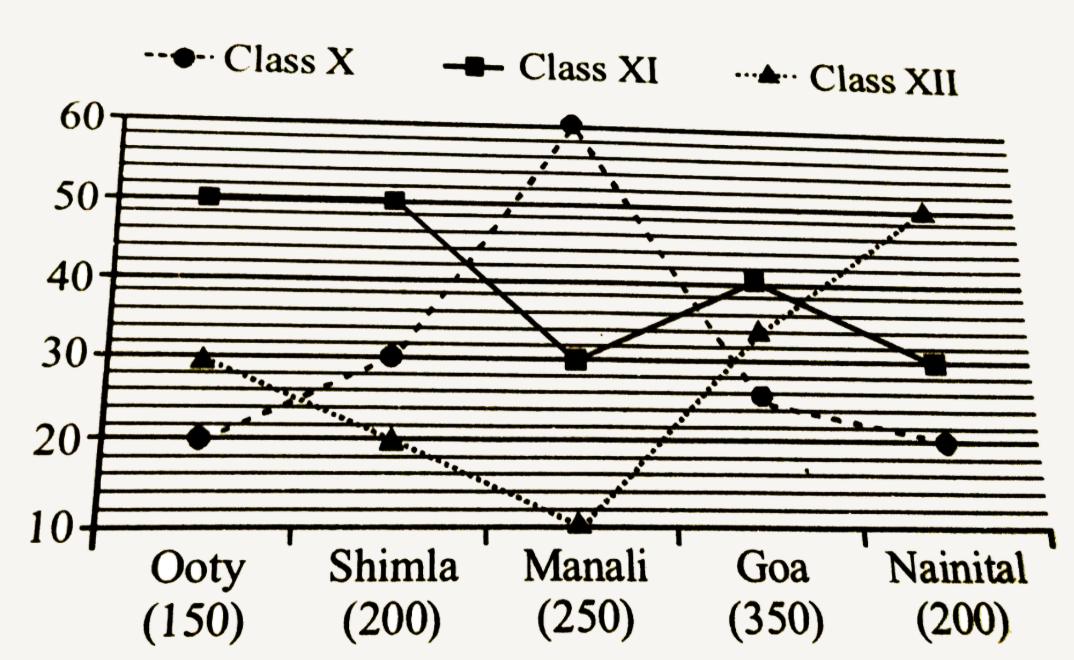
The table shows the total numbers of students om classes X,XI and XII .
ClassNo. of studentsX420XI480XII400
The number of students from class XI and XII together who visited Manali is what percent of the number of students from class X who visited Shimla, Ooty and Nainital together ? (approximate)View Solution

