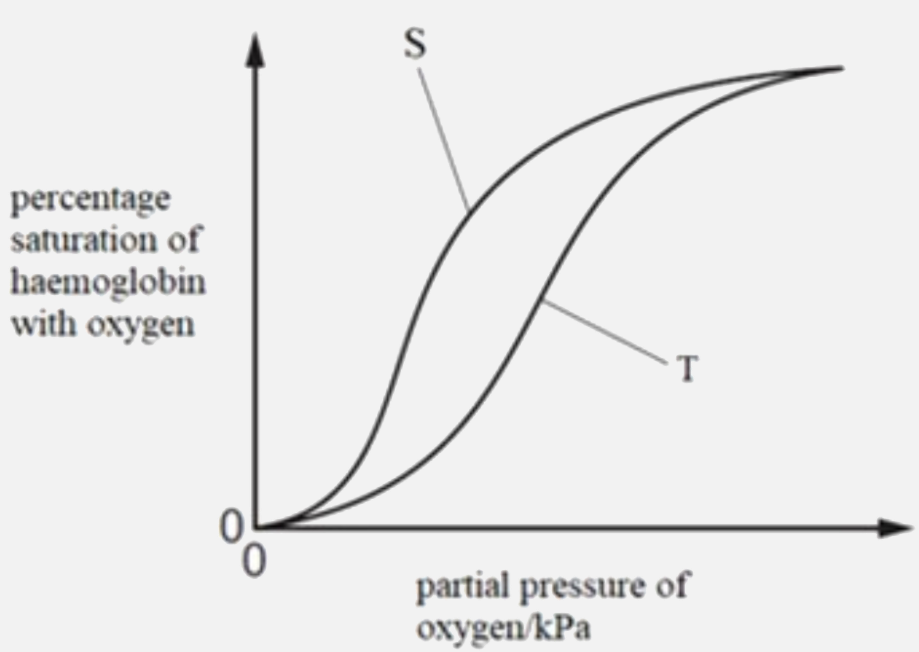
The oxygen dissociation curve of hemoglobin is
Similar to the growth curve under restricted environmental resources
Sigmoid shape
Hyperbola
Both (A) and (B)
The correct Answer is:D
Step by step video, text & image solution for The oxygen dissociation curve of hemoglobin is by Biology experts to help you in doubts & scoring excellent marks in Class 12 exams.
Updated on:21/07/2023Topper's Solved these Questions
Similar Questions
The graph shows the oxygen dissociation curves of haemoglobin from two species of mammals, s and T .

Which statements could explain the difference in the oxygen dissociation curves of species S and species T ?
I. Species T has higher haemoglobin concentration in its red blood cells than species S.
II. The haemoglobin in species T has a lower affinity for oxygen than the haemoglobin in species S.
III. Species T may be living at a higher altitudes than species S.
View SolutionWhen parital pressure of CO2(pCO2) rises the oxygen dissociation curve of haemoglobin will
View Solution
Knowledge Check
Oxygen dissociation curve of haemoglobin is
AsigmoidBhyperbolicChypobolicDhypobloicThe oxygen dissociation curve is
AparabolaBslopeCsigmoidDstright line.When partial pressure of CO2 rises, the oxygen dissociation curve of haemoglobin at 37∘C will :
Aremain unchangedBbecome irregularCshift towards leftDshift towards right
Oxygen dissociation curve of haemoglobin is
View SolutionOxygen dissociation curve of haemoglobinis is
View SolutionOxyghen dissociation curve of haemoglobin ius
View SolutionAssertion : Oxygen dissociation curve of haemoglobin is sigmoid .
Reason : Oxygen dissociation curve moves towards left side with increse in CO2 concentration in the air.
View SolutionAt higher O2 concentration, oxygen dissociation curve of haemoglobin will '
View Solution
