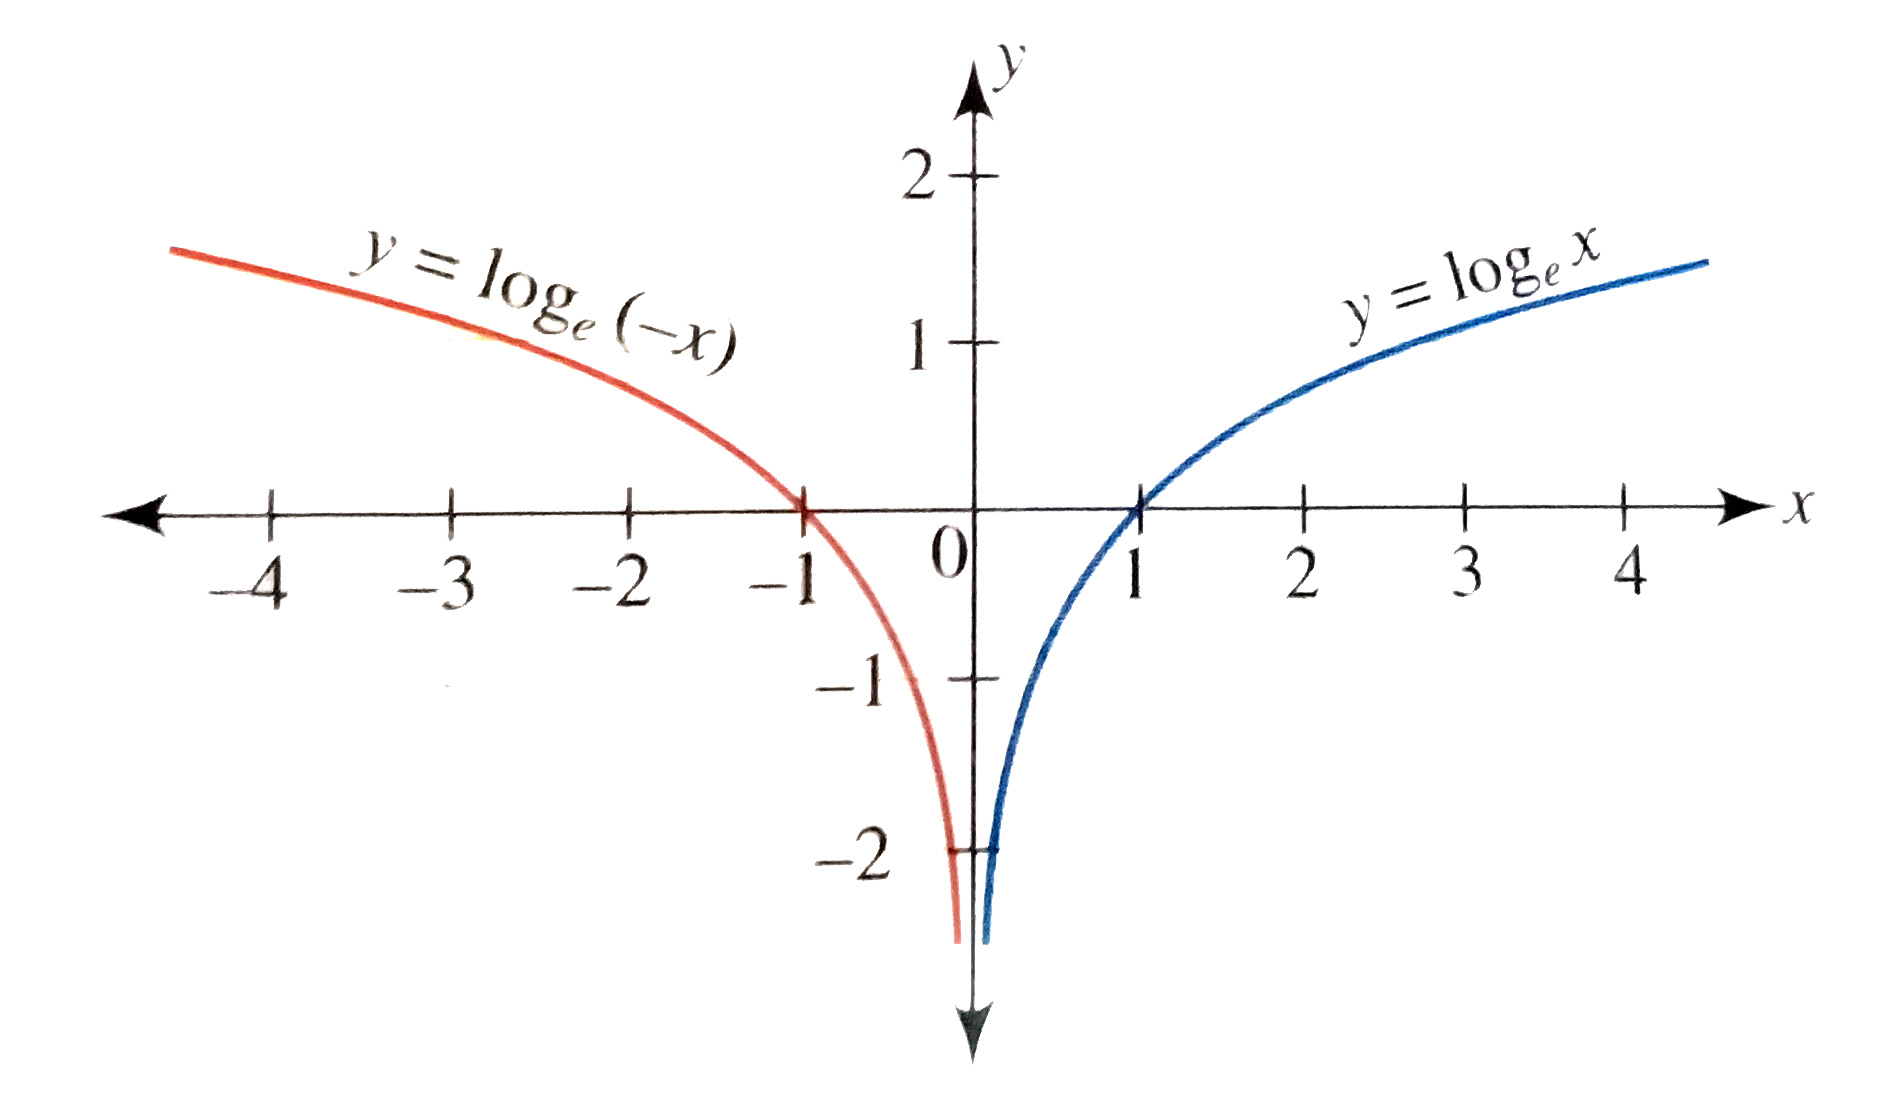
Plot the curve y=(log)e(−x).
Video Solution
Text Solution
To draw the graph of y=loge(−x), flip the graph of y=logex over the y-axis shown in the following figure.

|
Topper's Solved these Questions
- GRAPHICAL TRANSFORMATIONSBOOK - CENGAGECHAPTER - GRAPHICAL TRANSFORMATIONSEXERCISE - Exercise
22 Videos
- GRAPH OF INVERSE TRIGONOMETRIC FUNCTIONSBOOK - CENGAGECHAPTER - GRAPH OF INVERSE TRIGONOMETRIC FUNCTIONSEXERCISE - Exercise
18 Videos
- GRAPHS OF POLYNOMIAL AND RATIONAL FUNCTIONSBOOK - CENGAGECHAPTER - GRAPHS OF POLYNOMIAL AND RATIONAL FUNCTIONSEXERCISE - Exercise
13 Videos
Similar Questions
Knowledge Check
The area enclosed between the curve y=loge(x+e) and the coordinate axes is
A4 sq unitsB3 sq unitsC2 sq unitsD1 sq unitThe area bounded by the curve y=x(1−logex) and x-axis is
Ae24Be22Ce2−e2De2−e4
The area enclosed between the curves y=(log)e(x+e),x=(log)e(1y), and the x-axis is 2sq.units (b) 1sq.units 4sq.units (d) none of these
View SolutionThe area enclosed between the curve y=loge(x+e) and the coordinate axes is
View SolutionSketch the curve y=log|x|
View SolutionCompute the area of the region bounded by the curves y=ex(log)exandy=logxex
View SolutionPlot the curve y=[e[x]] ; when −4<x<2
View SolutionThe minimum distance between a point on the curve y=ex and a point on the curve y=logex is
View Solution
