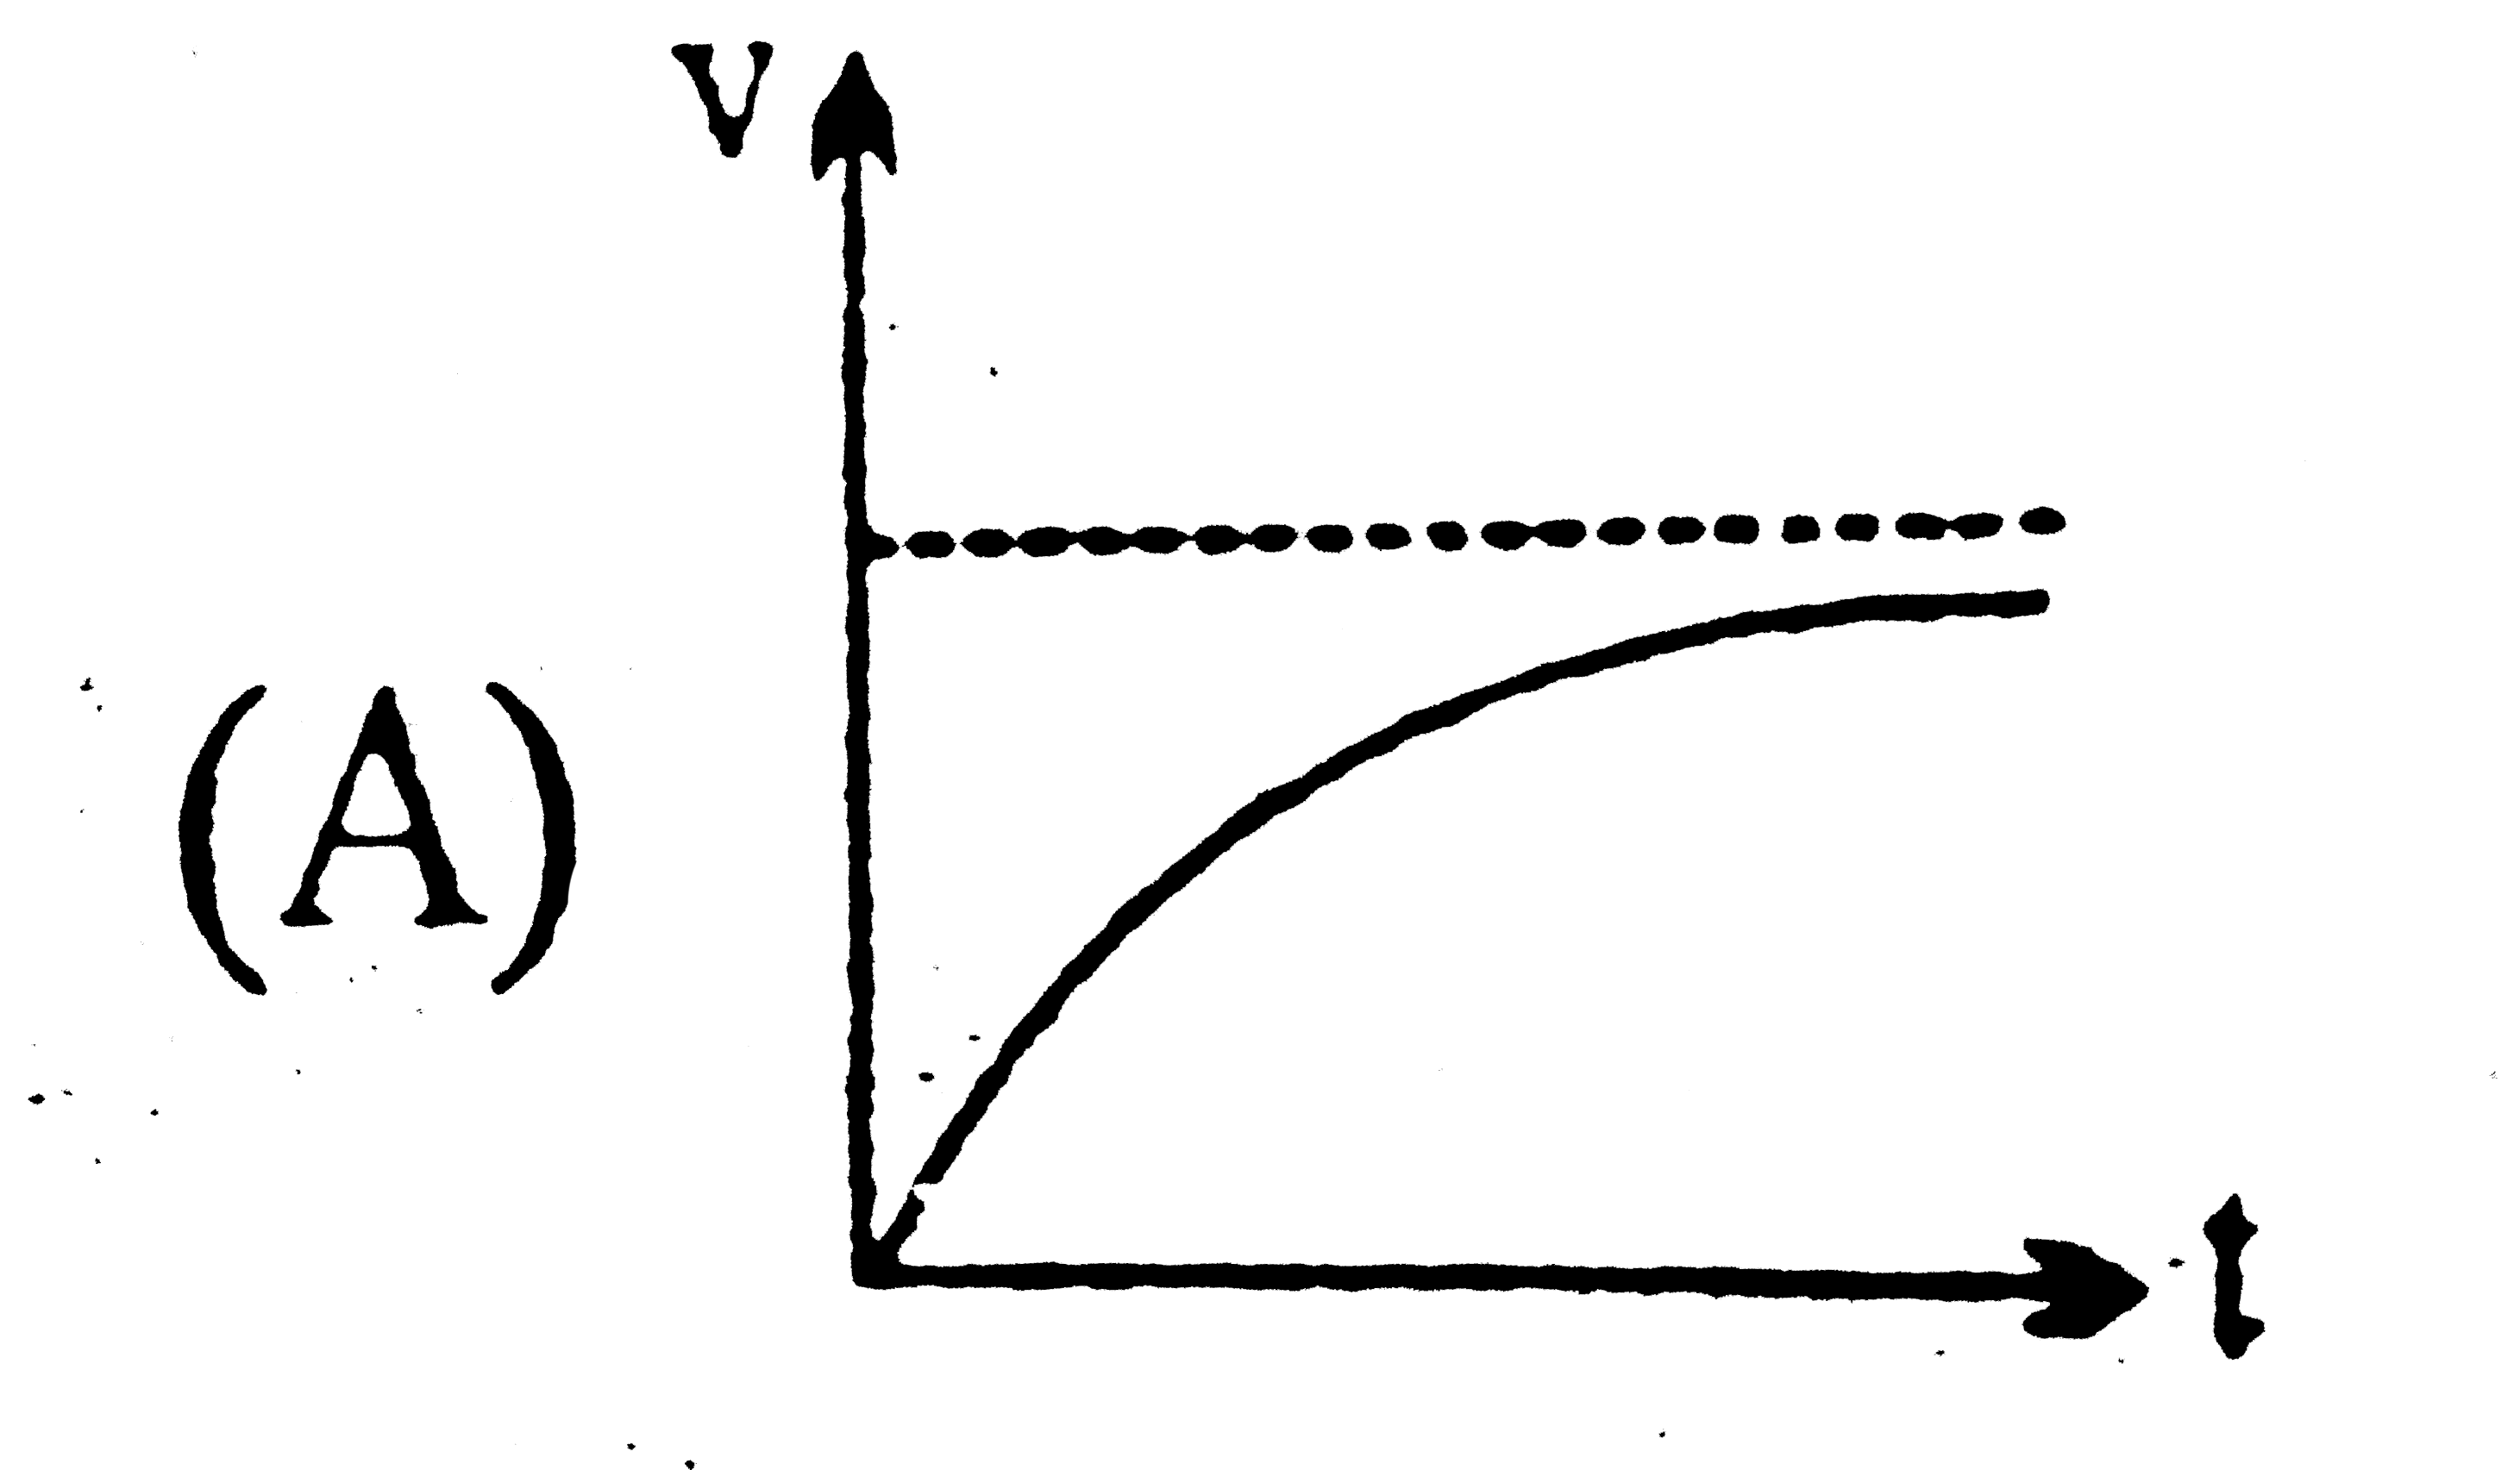
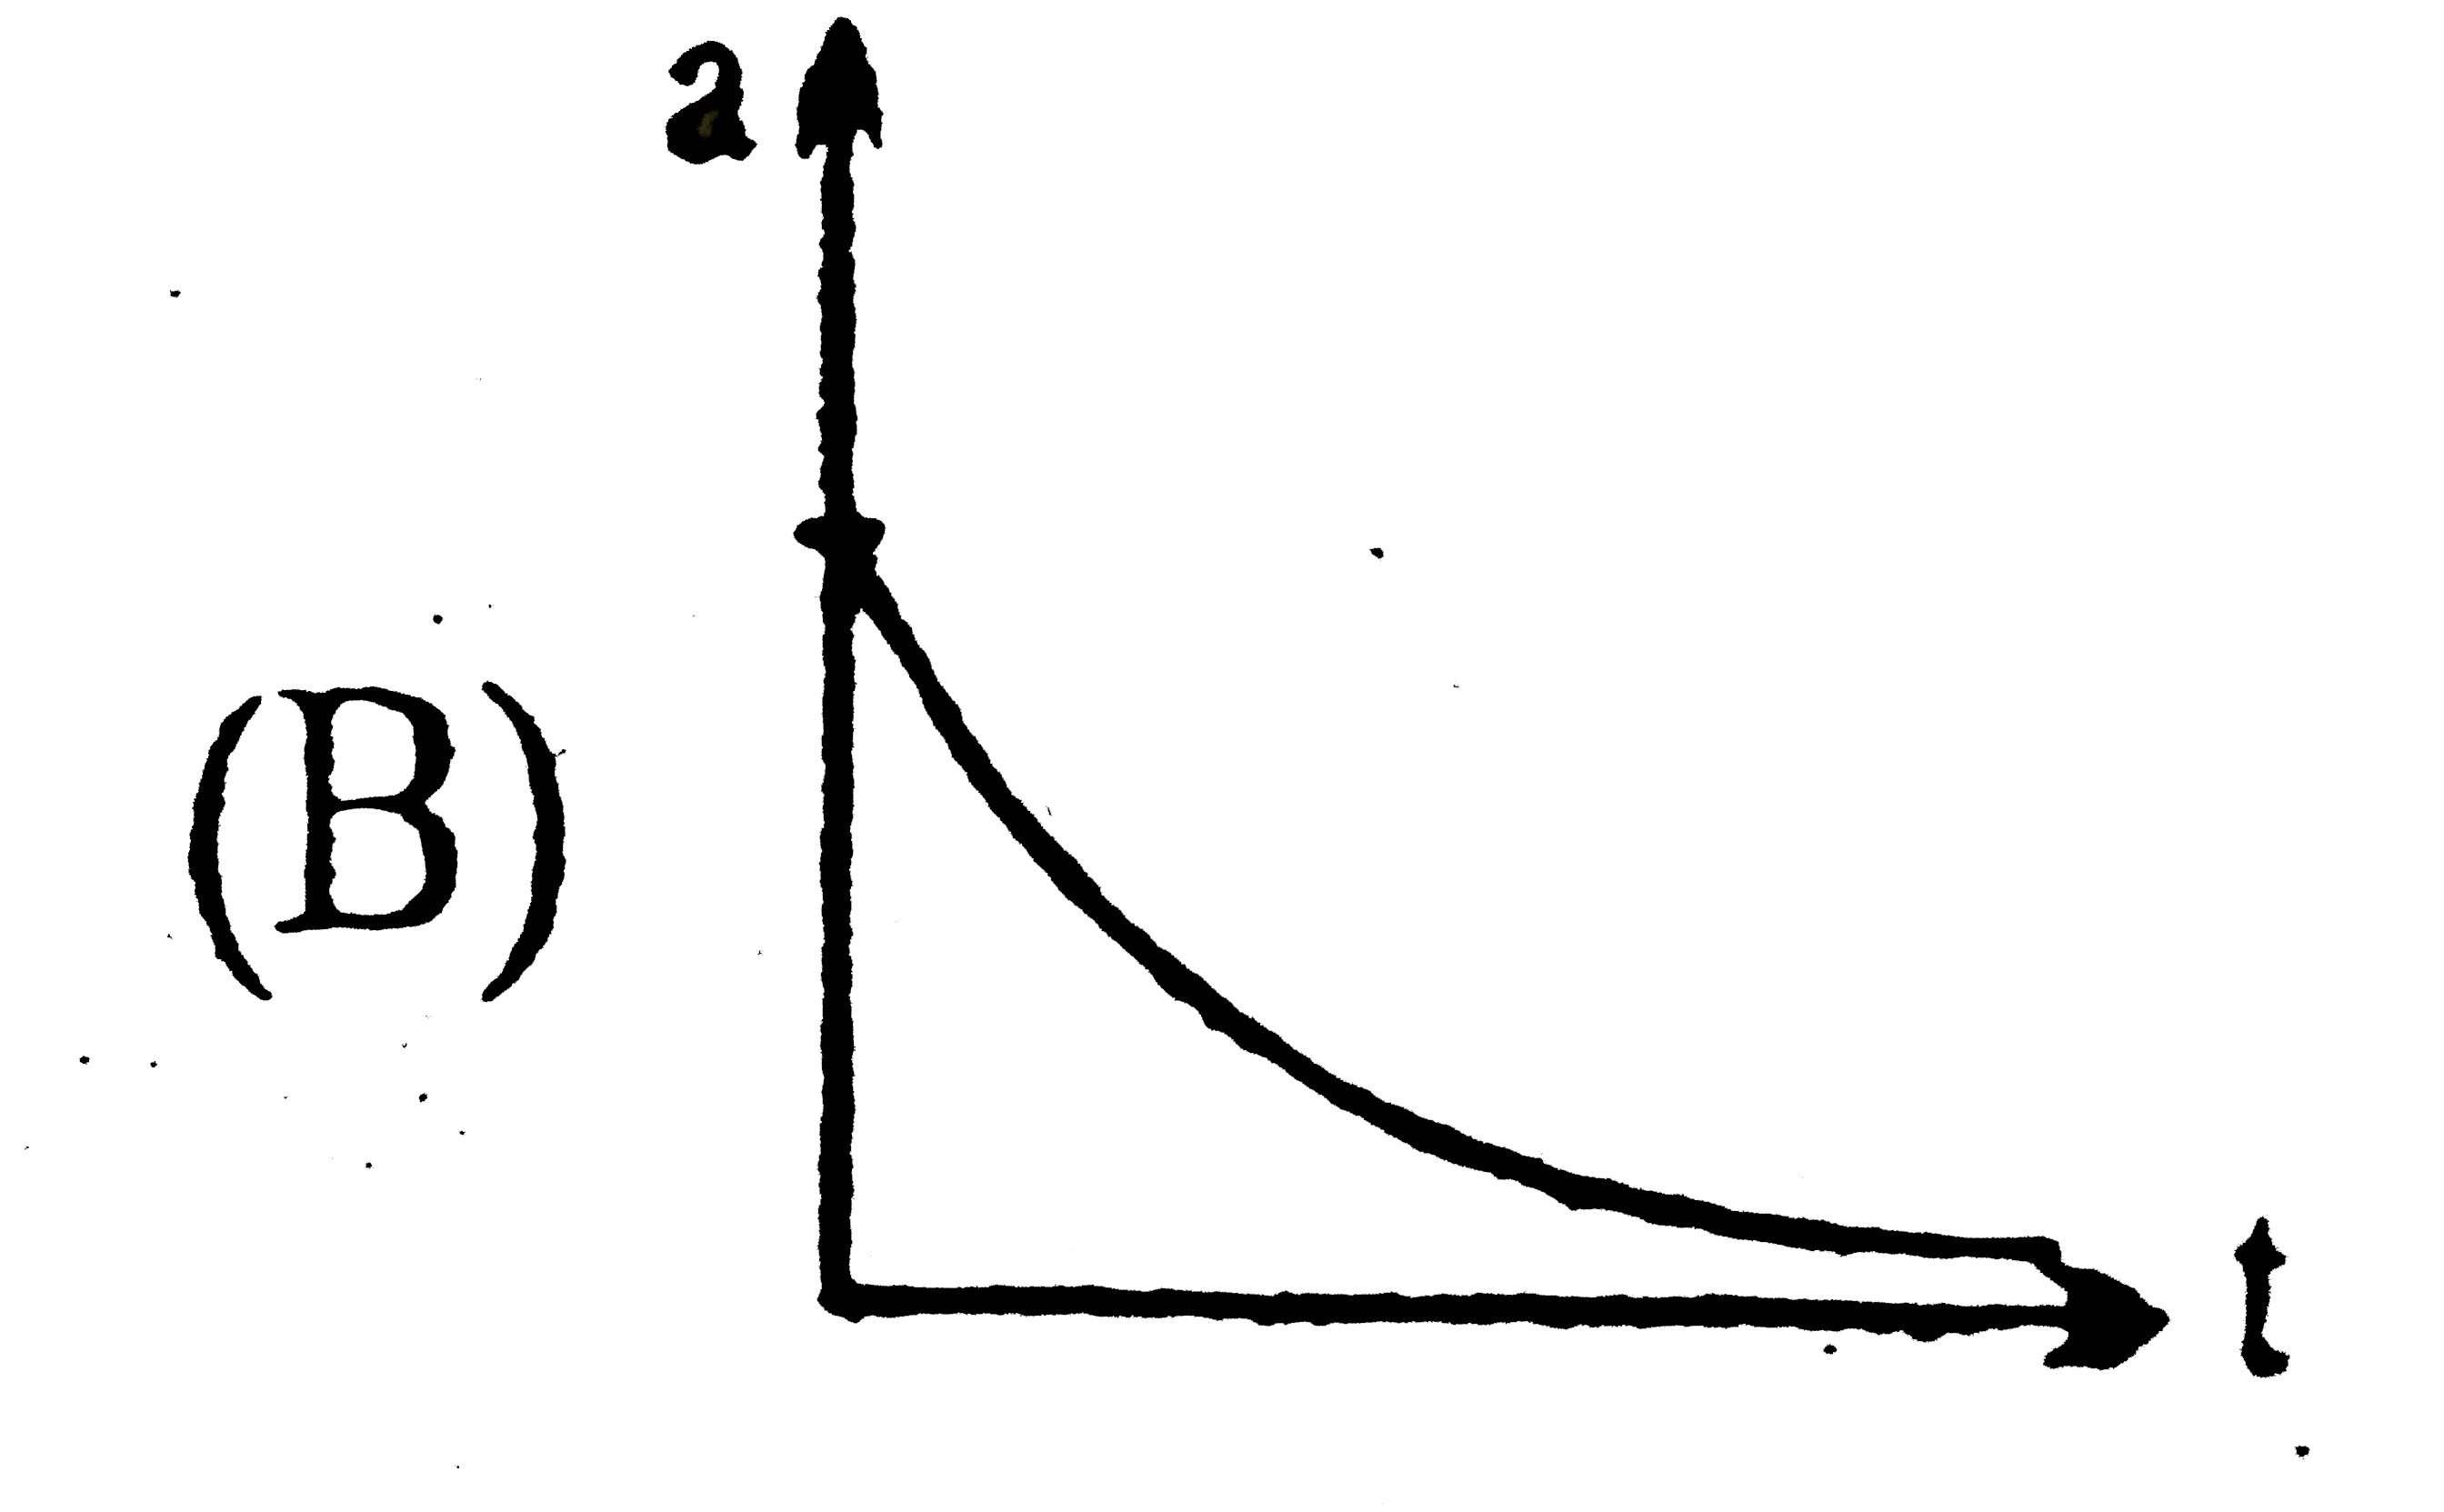
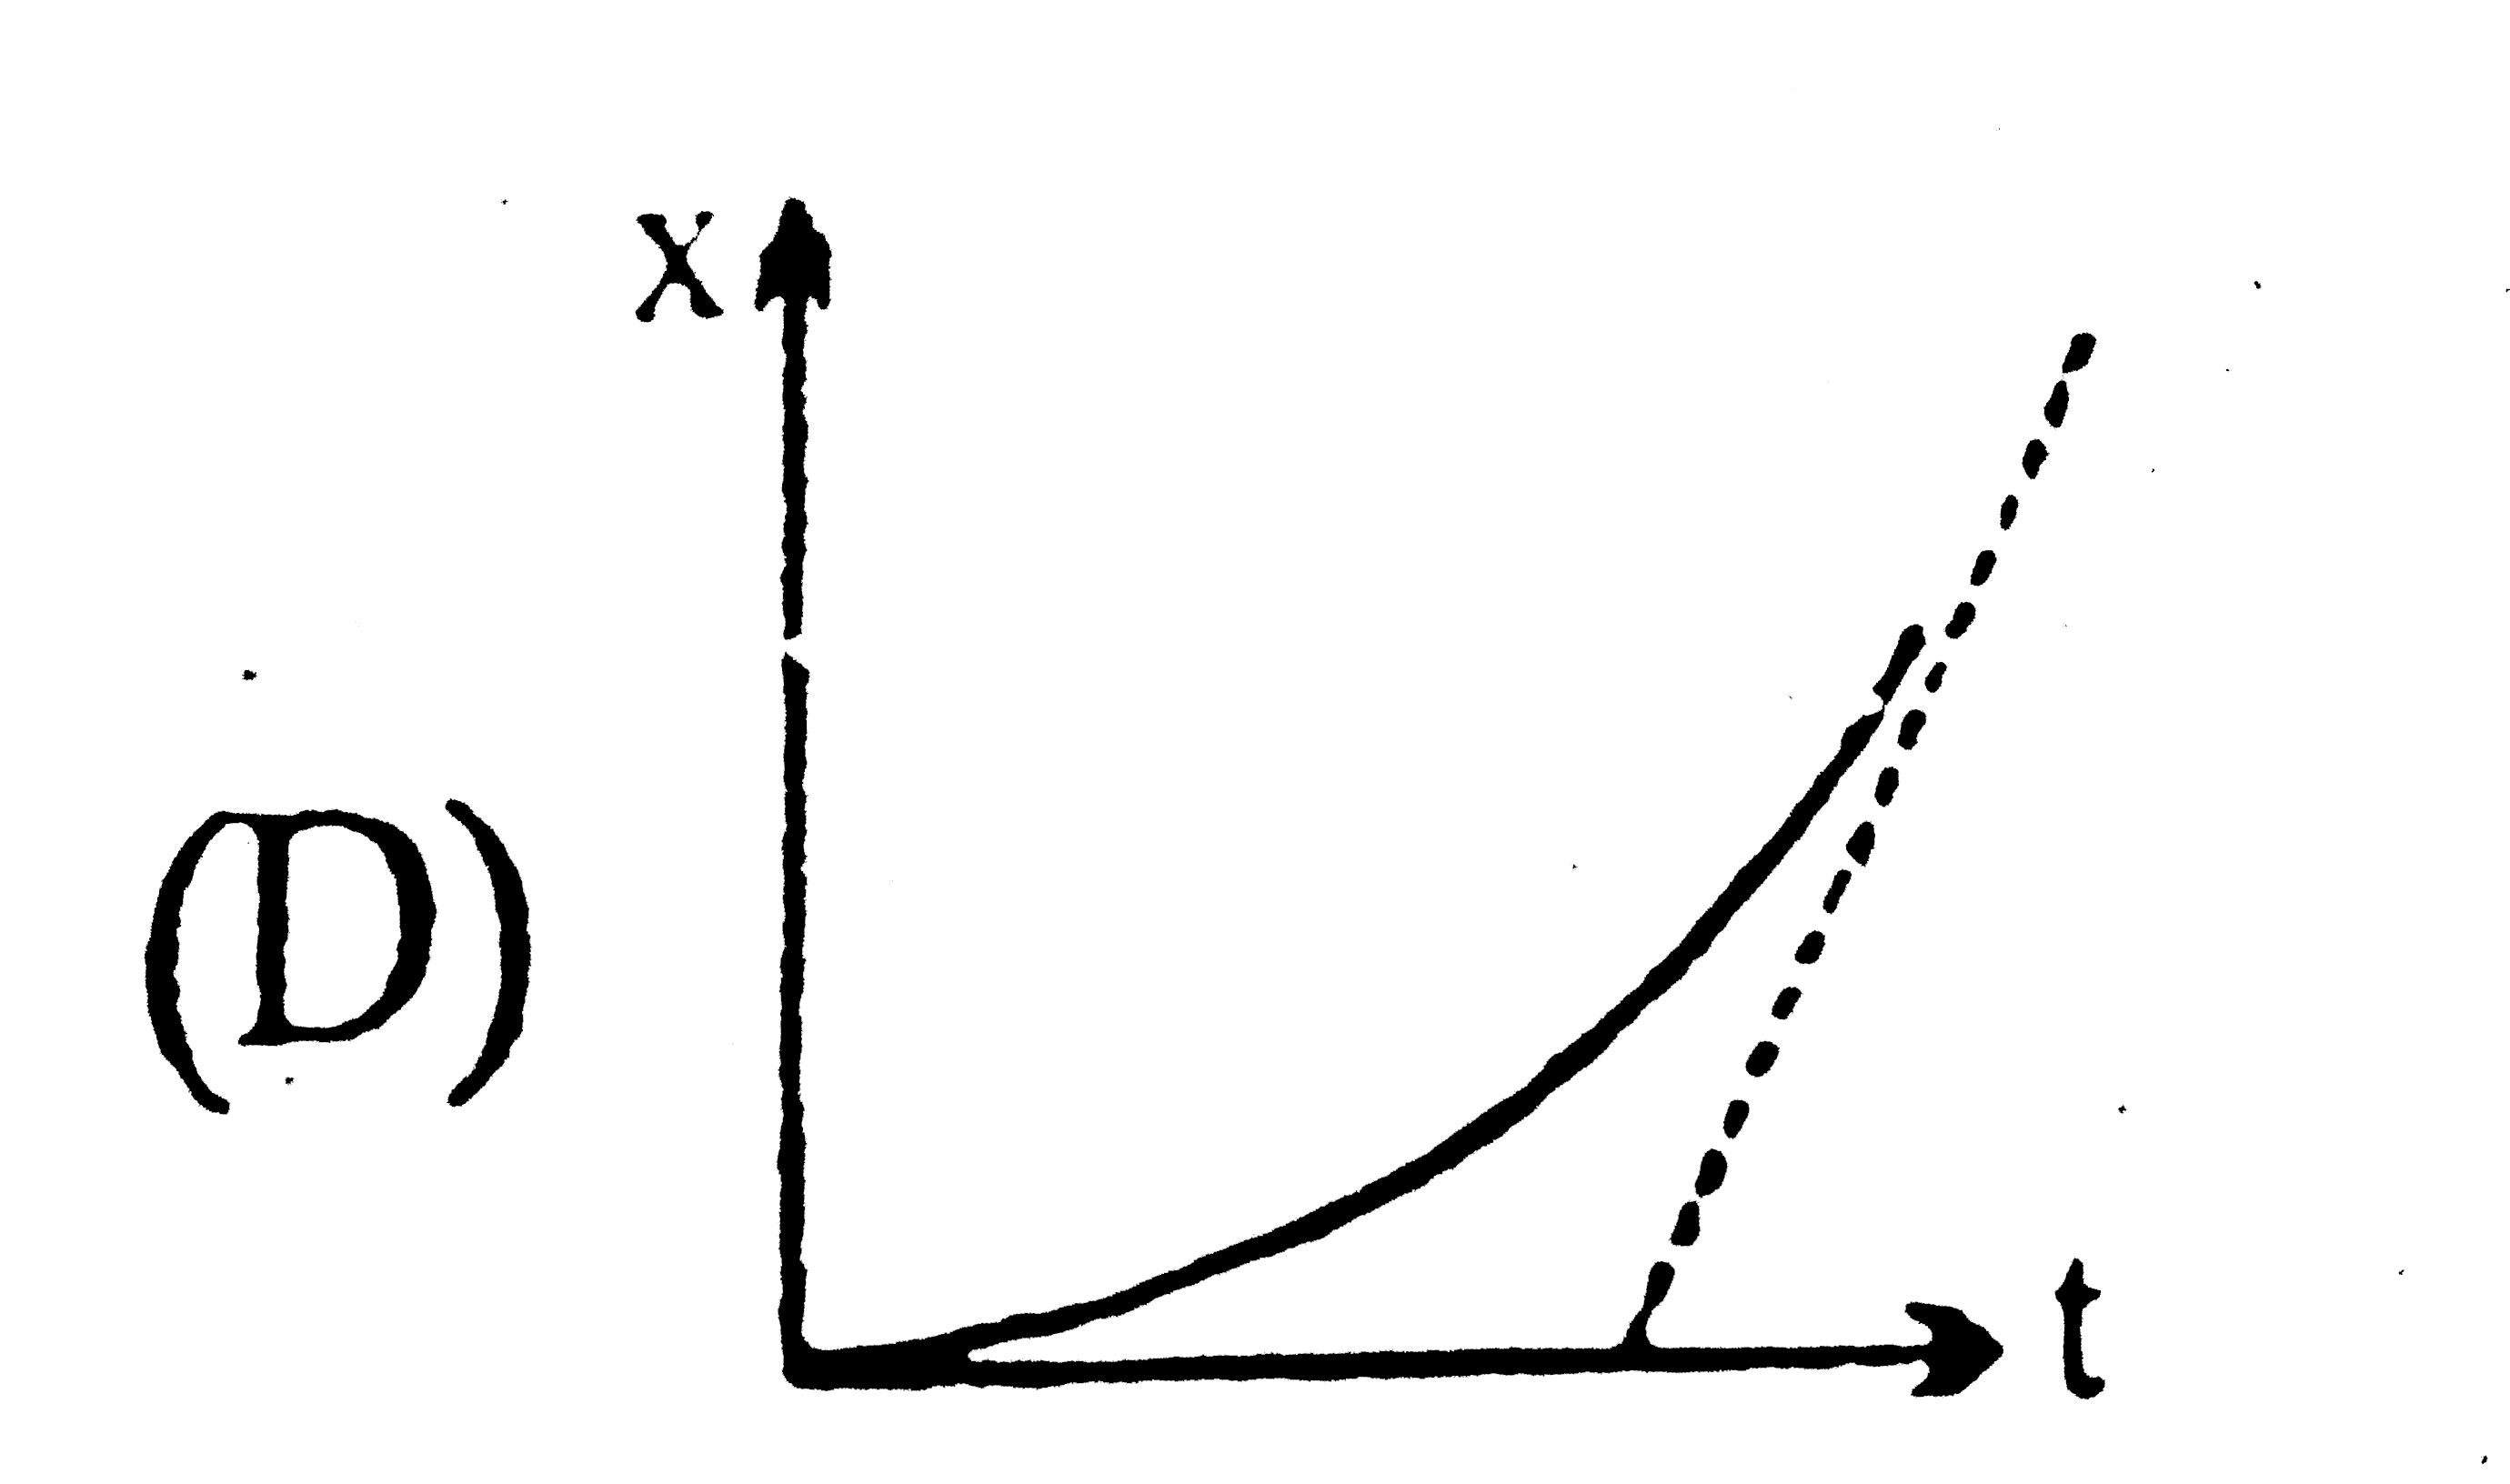
Which of the following is the incorrect graph for a sphere falling in a viscous liquid?
A
B
C

D
Video Solution
Text Solution
The correct Answer is:C
W−B=ma
mg−6πηrv=ma
a Vs v will be a straight line constant slope.
v=K(1−e−t/τ)
so graph A,B,D are correct.
|
Topper's Solved these Questions
Similar Questions
Knowledge Check
Which of the following graphs is incorrect?
A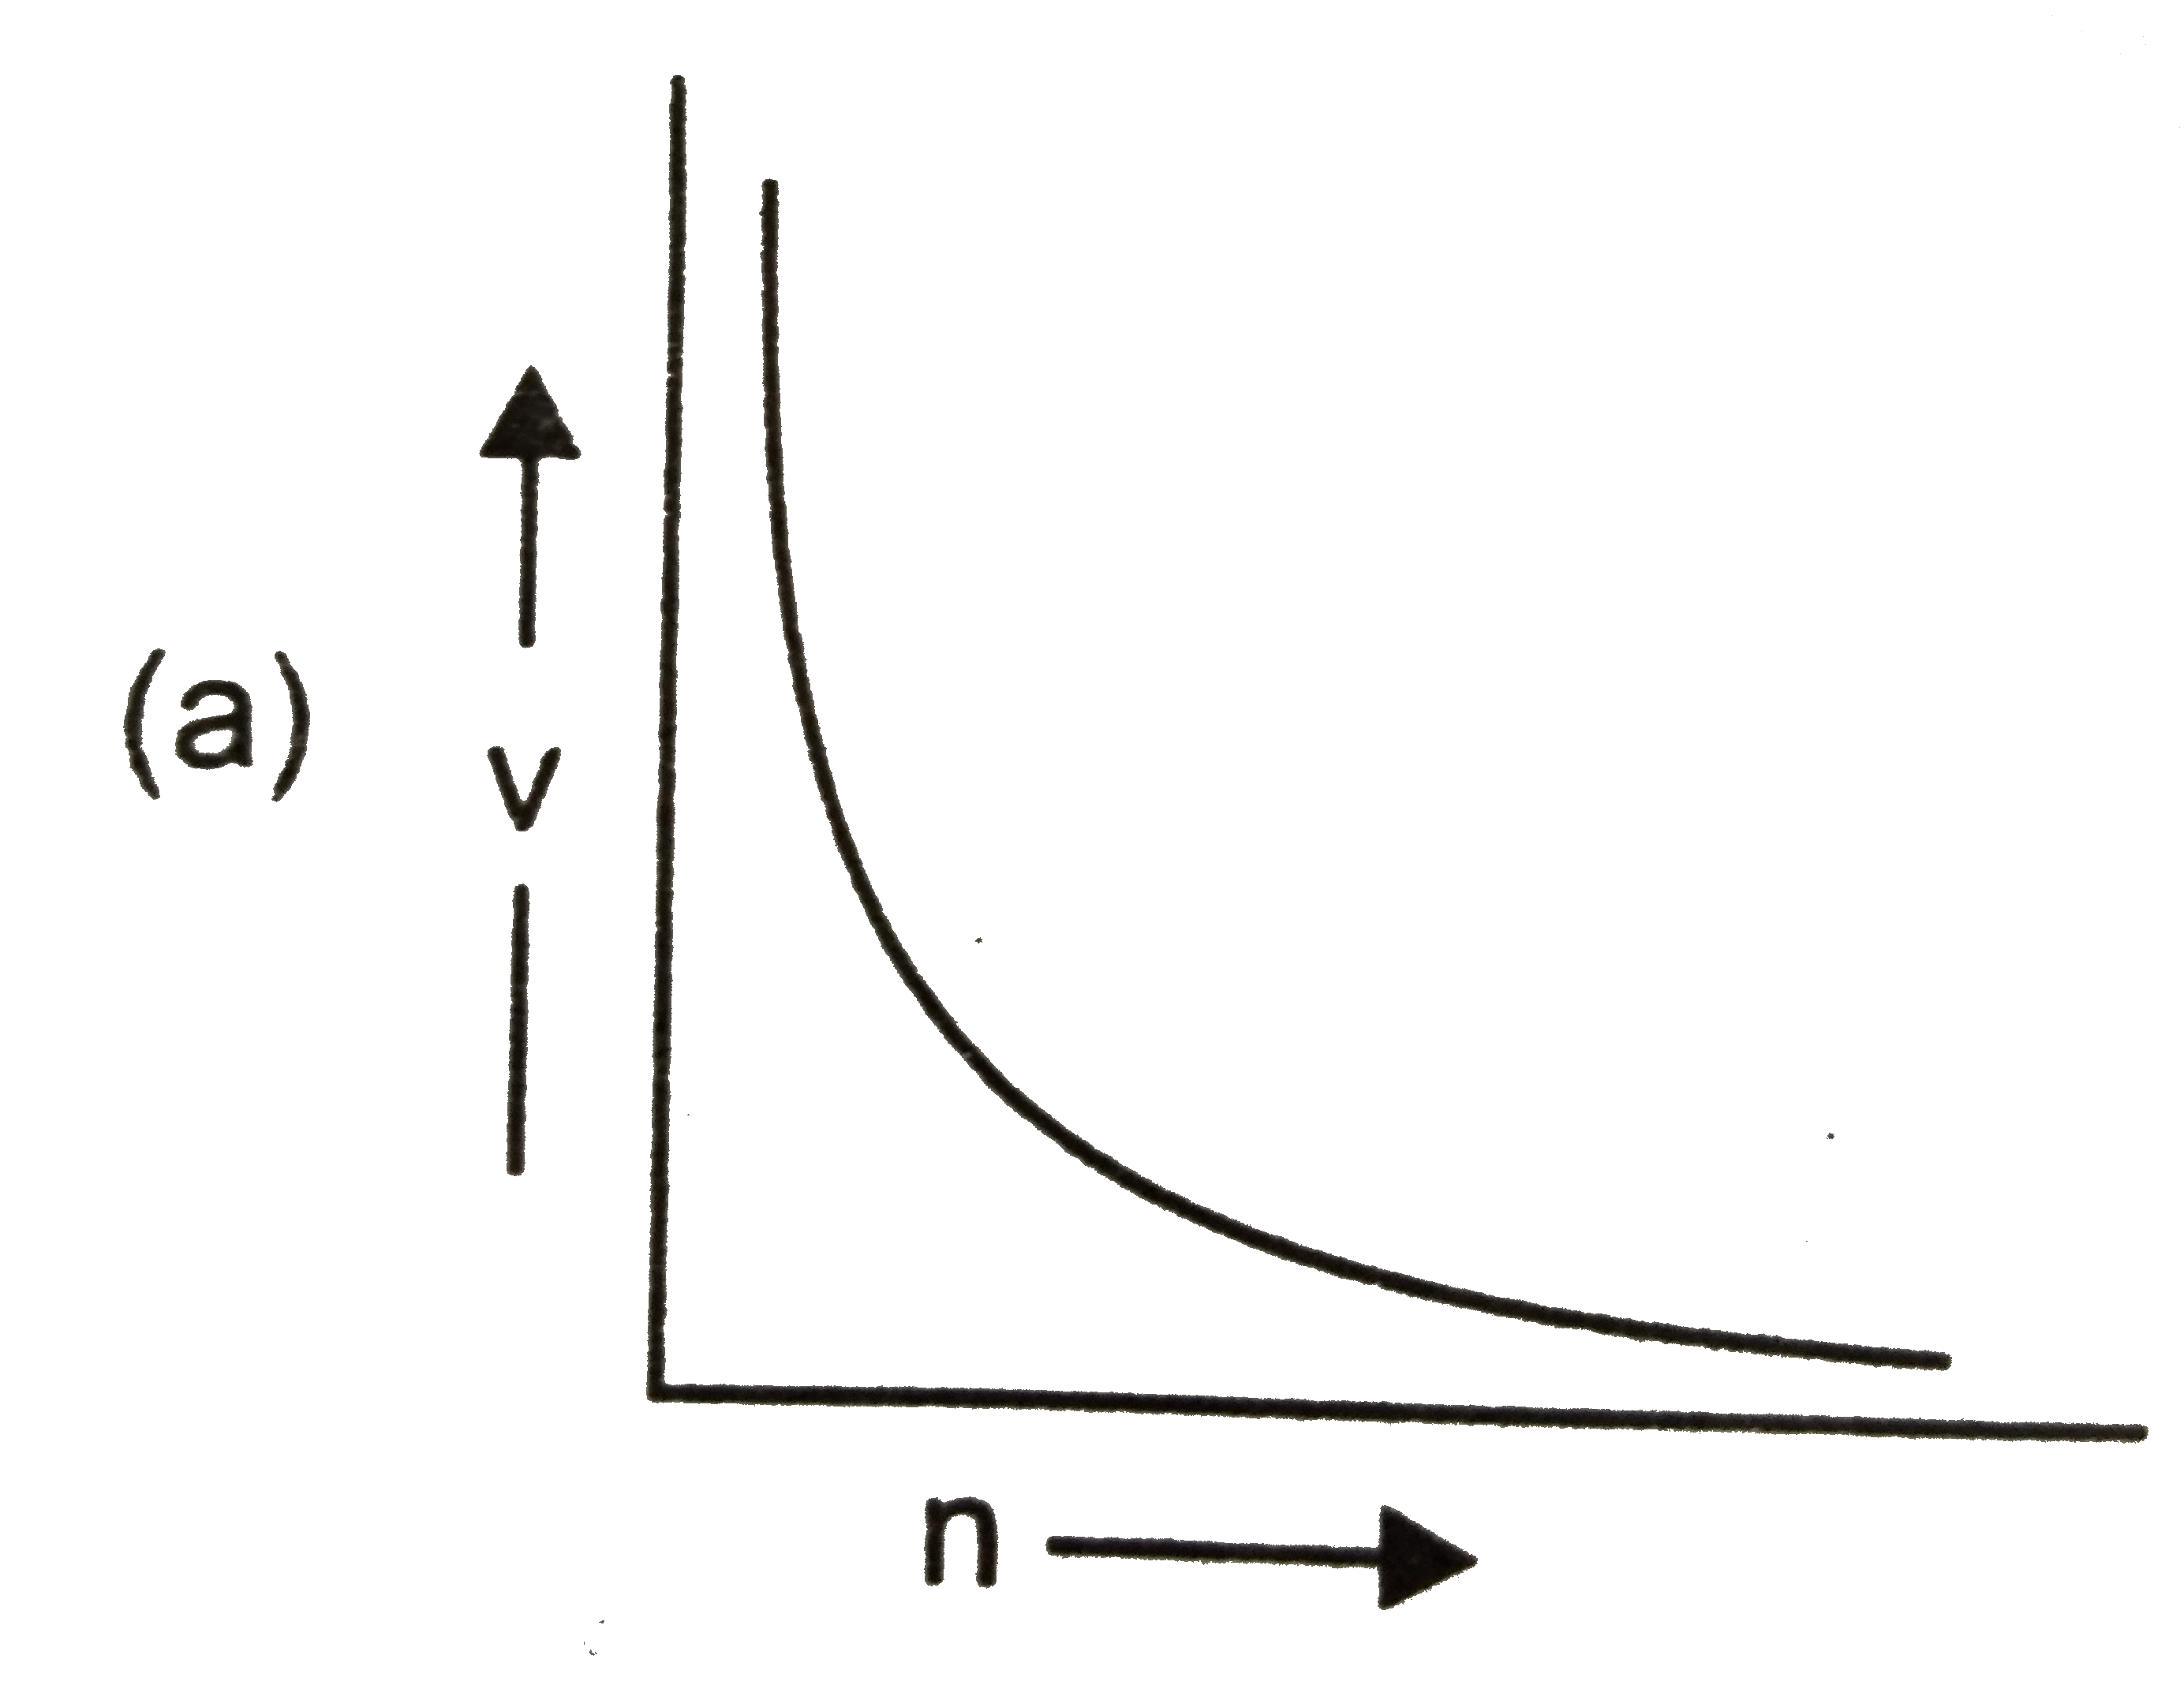 B
B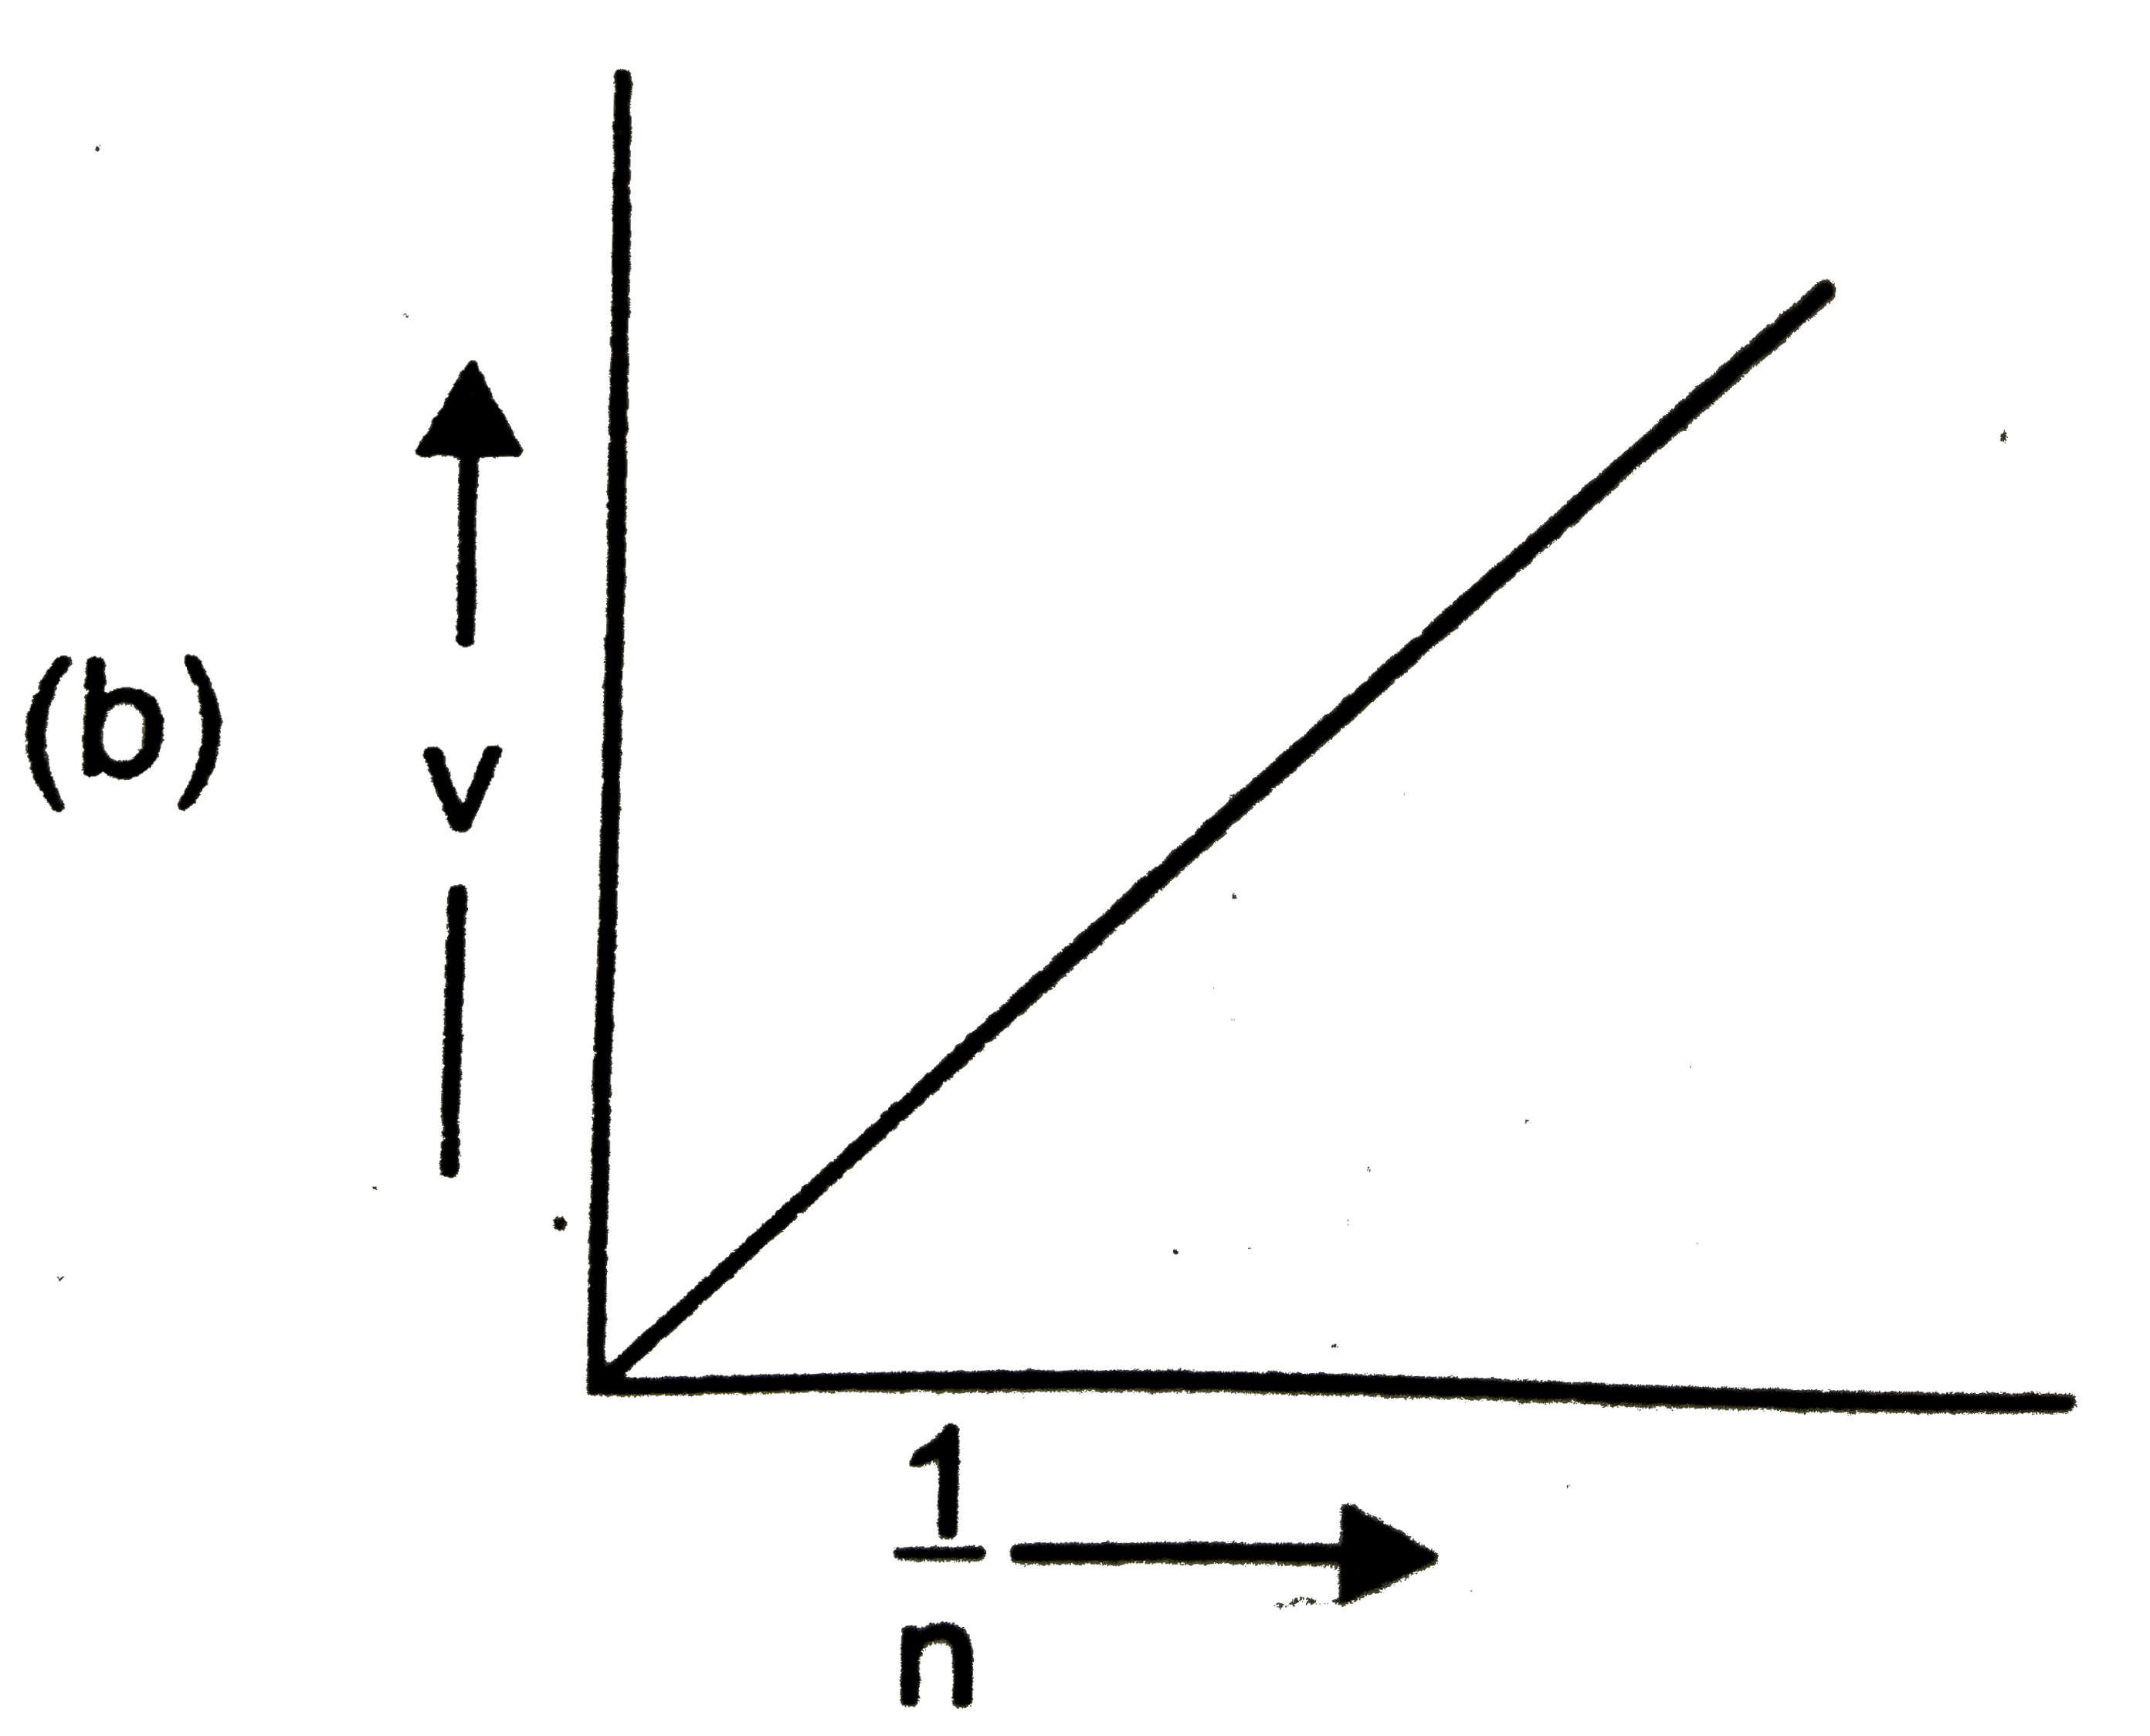 C
C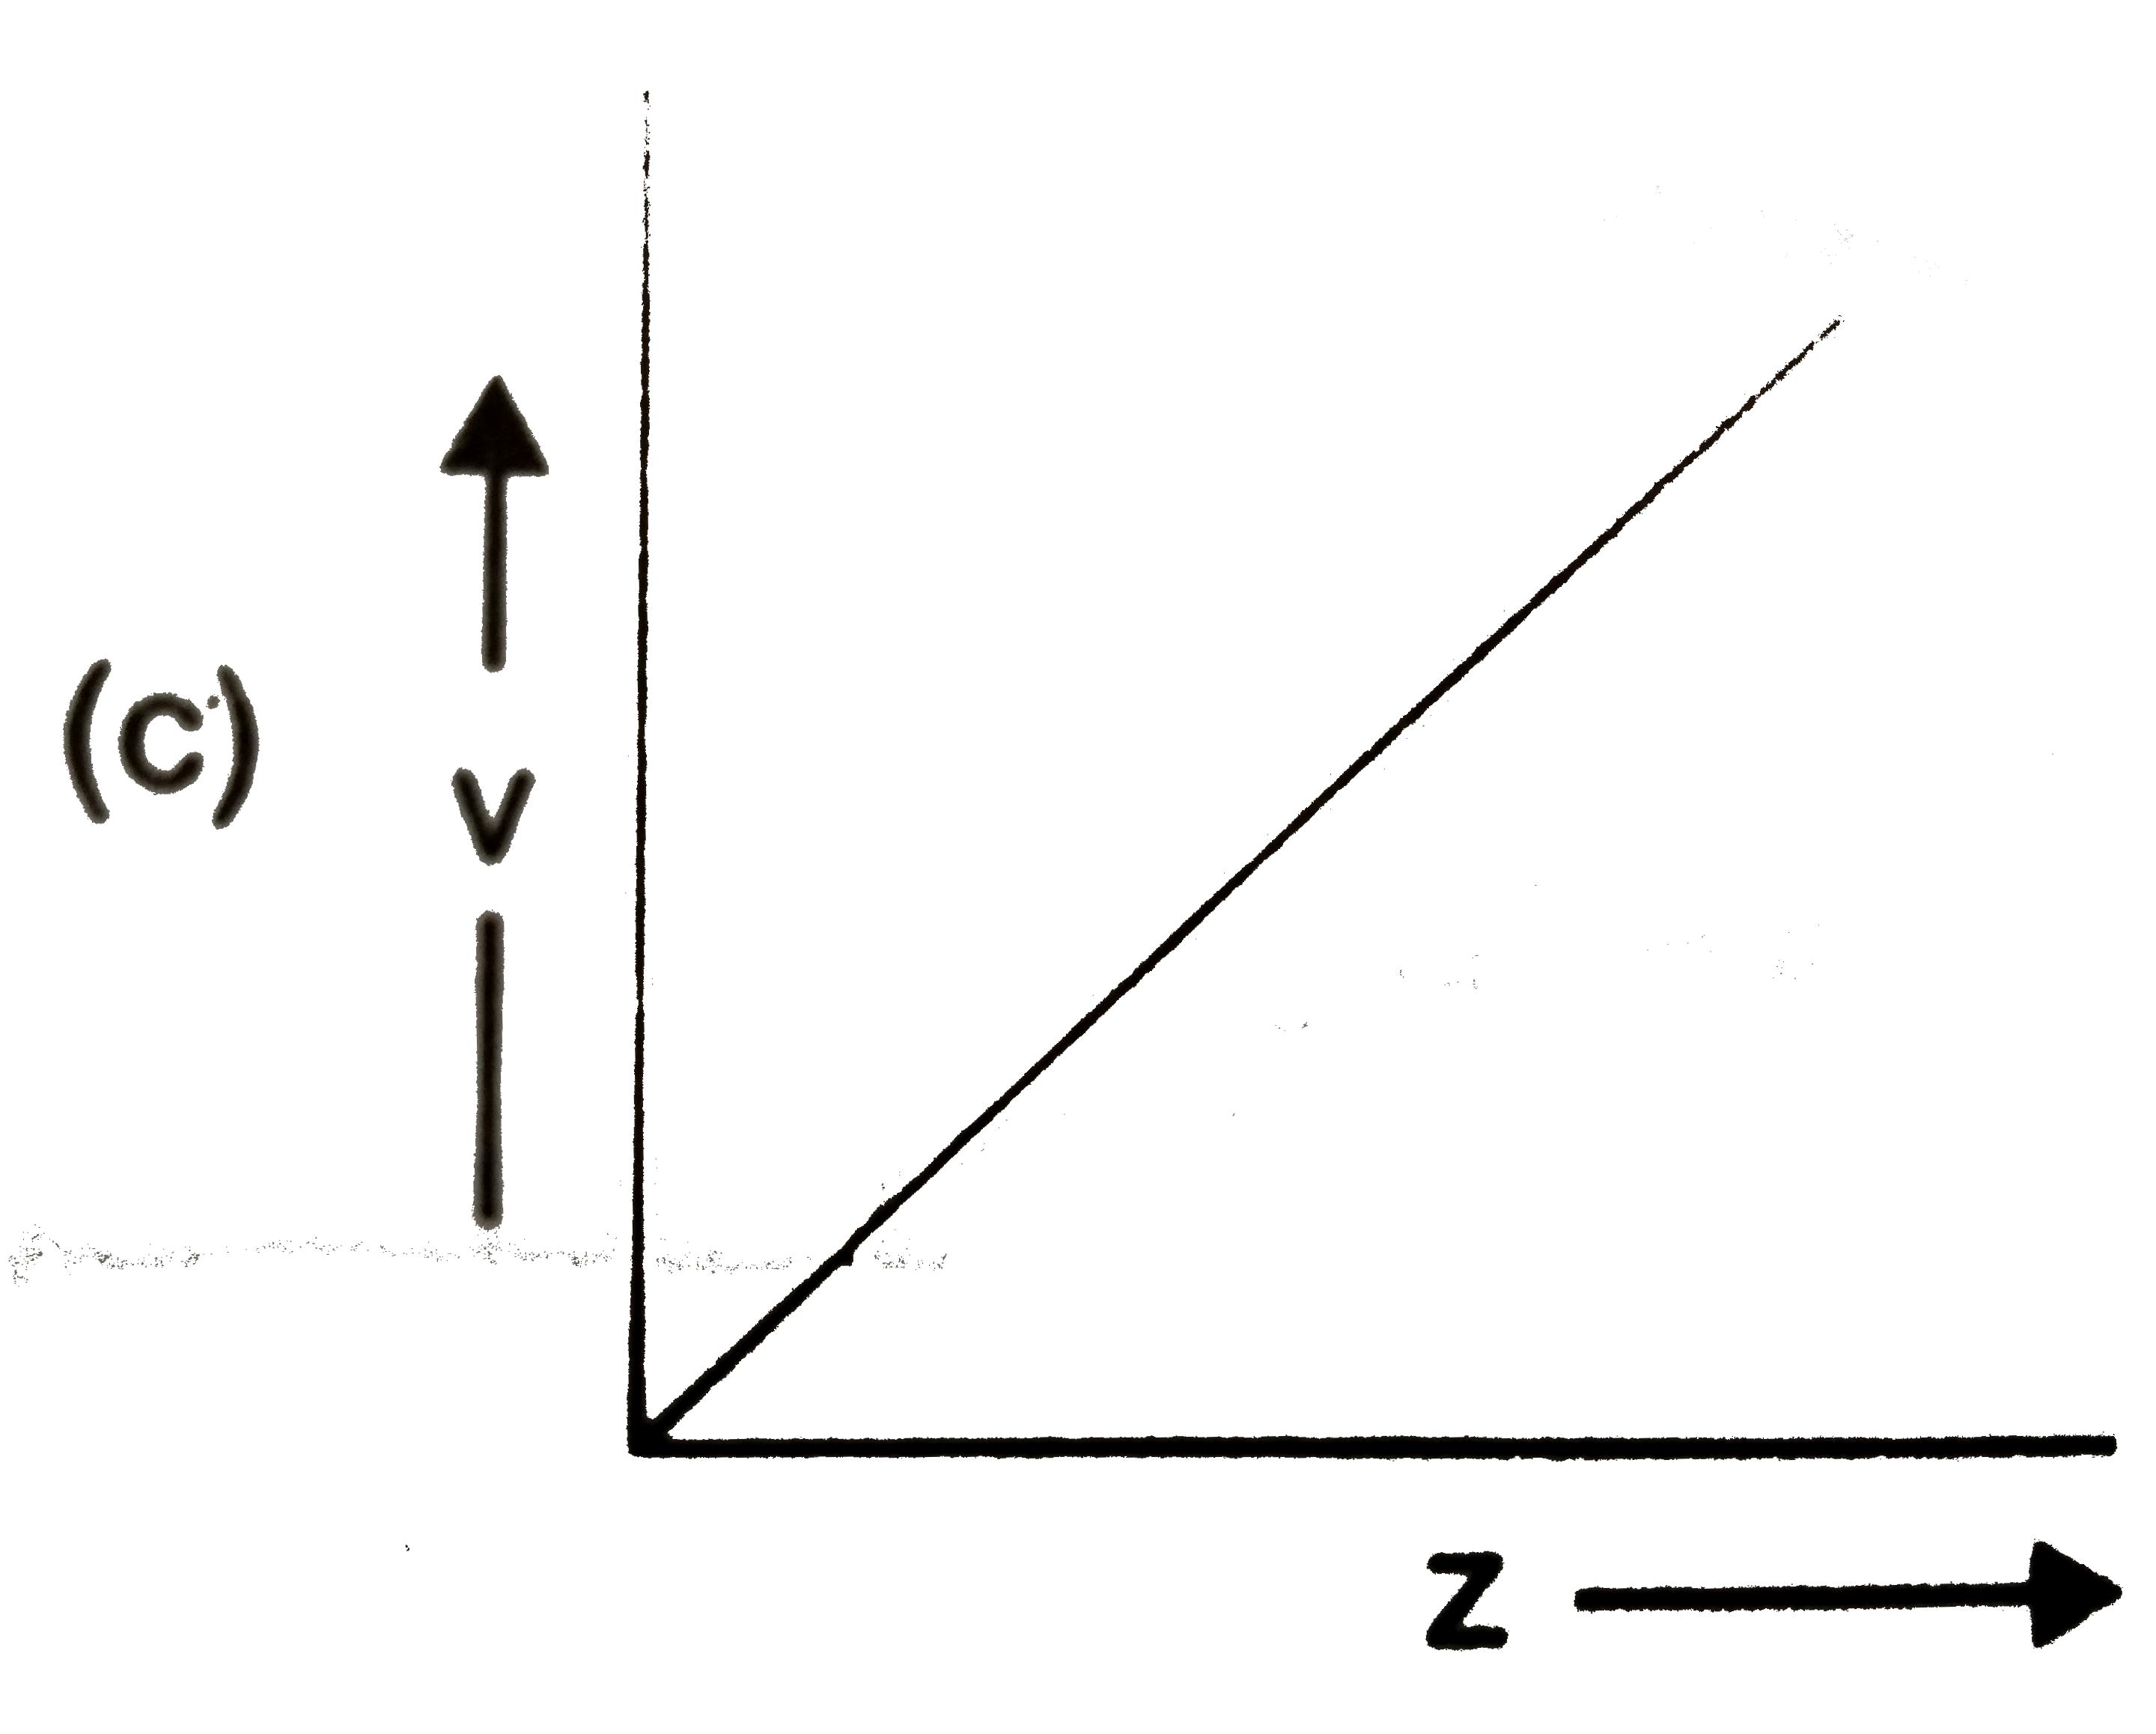 D
D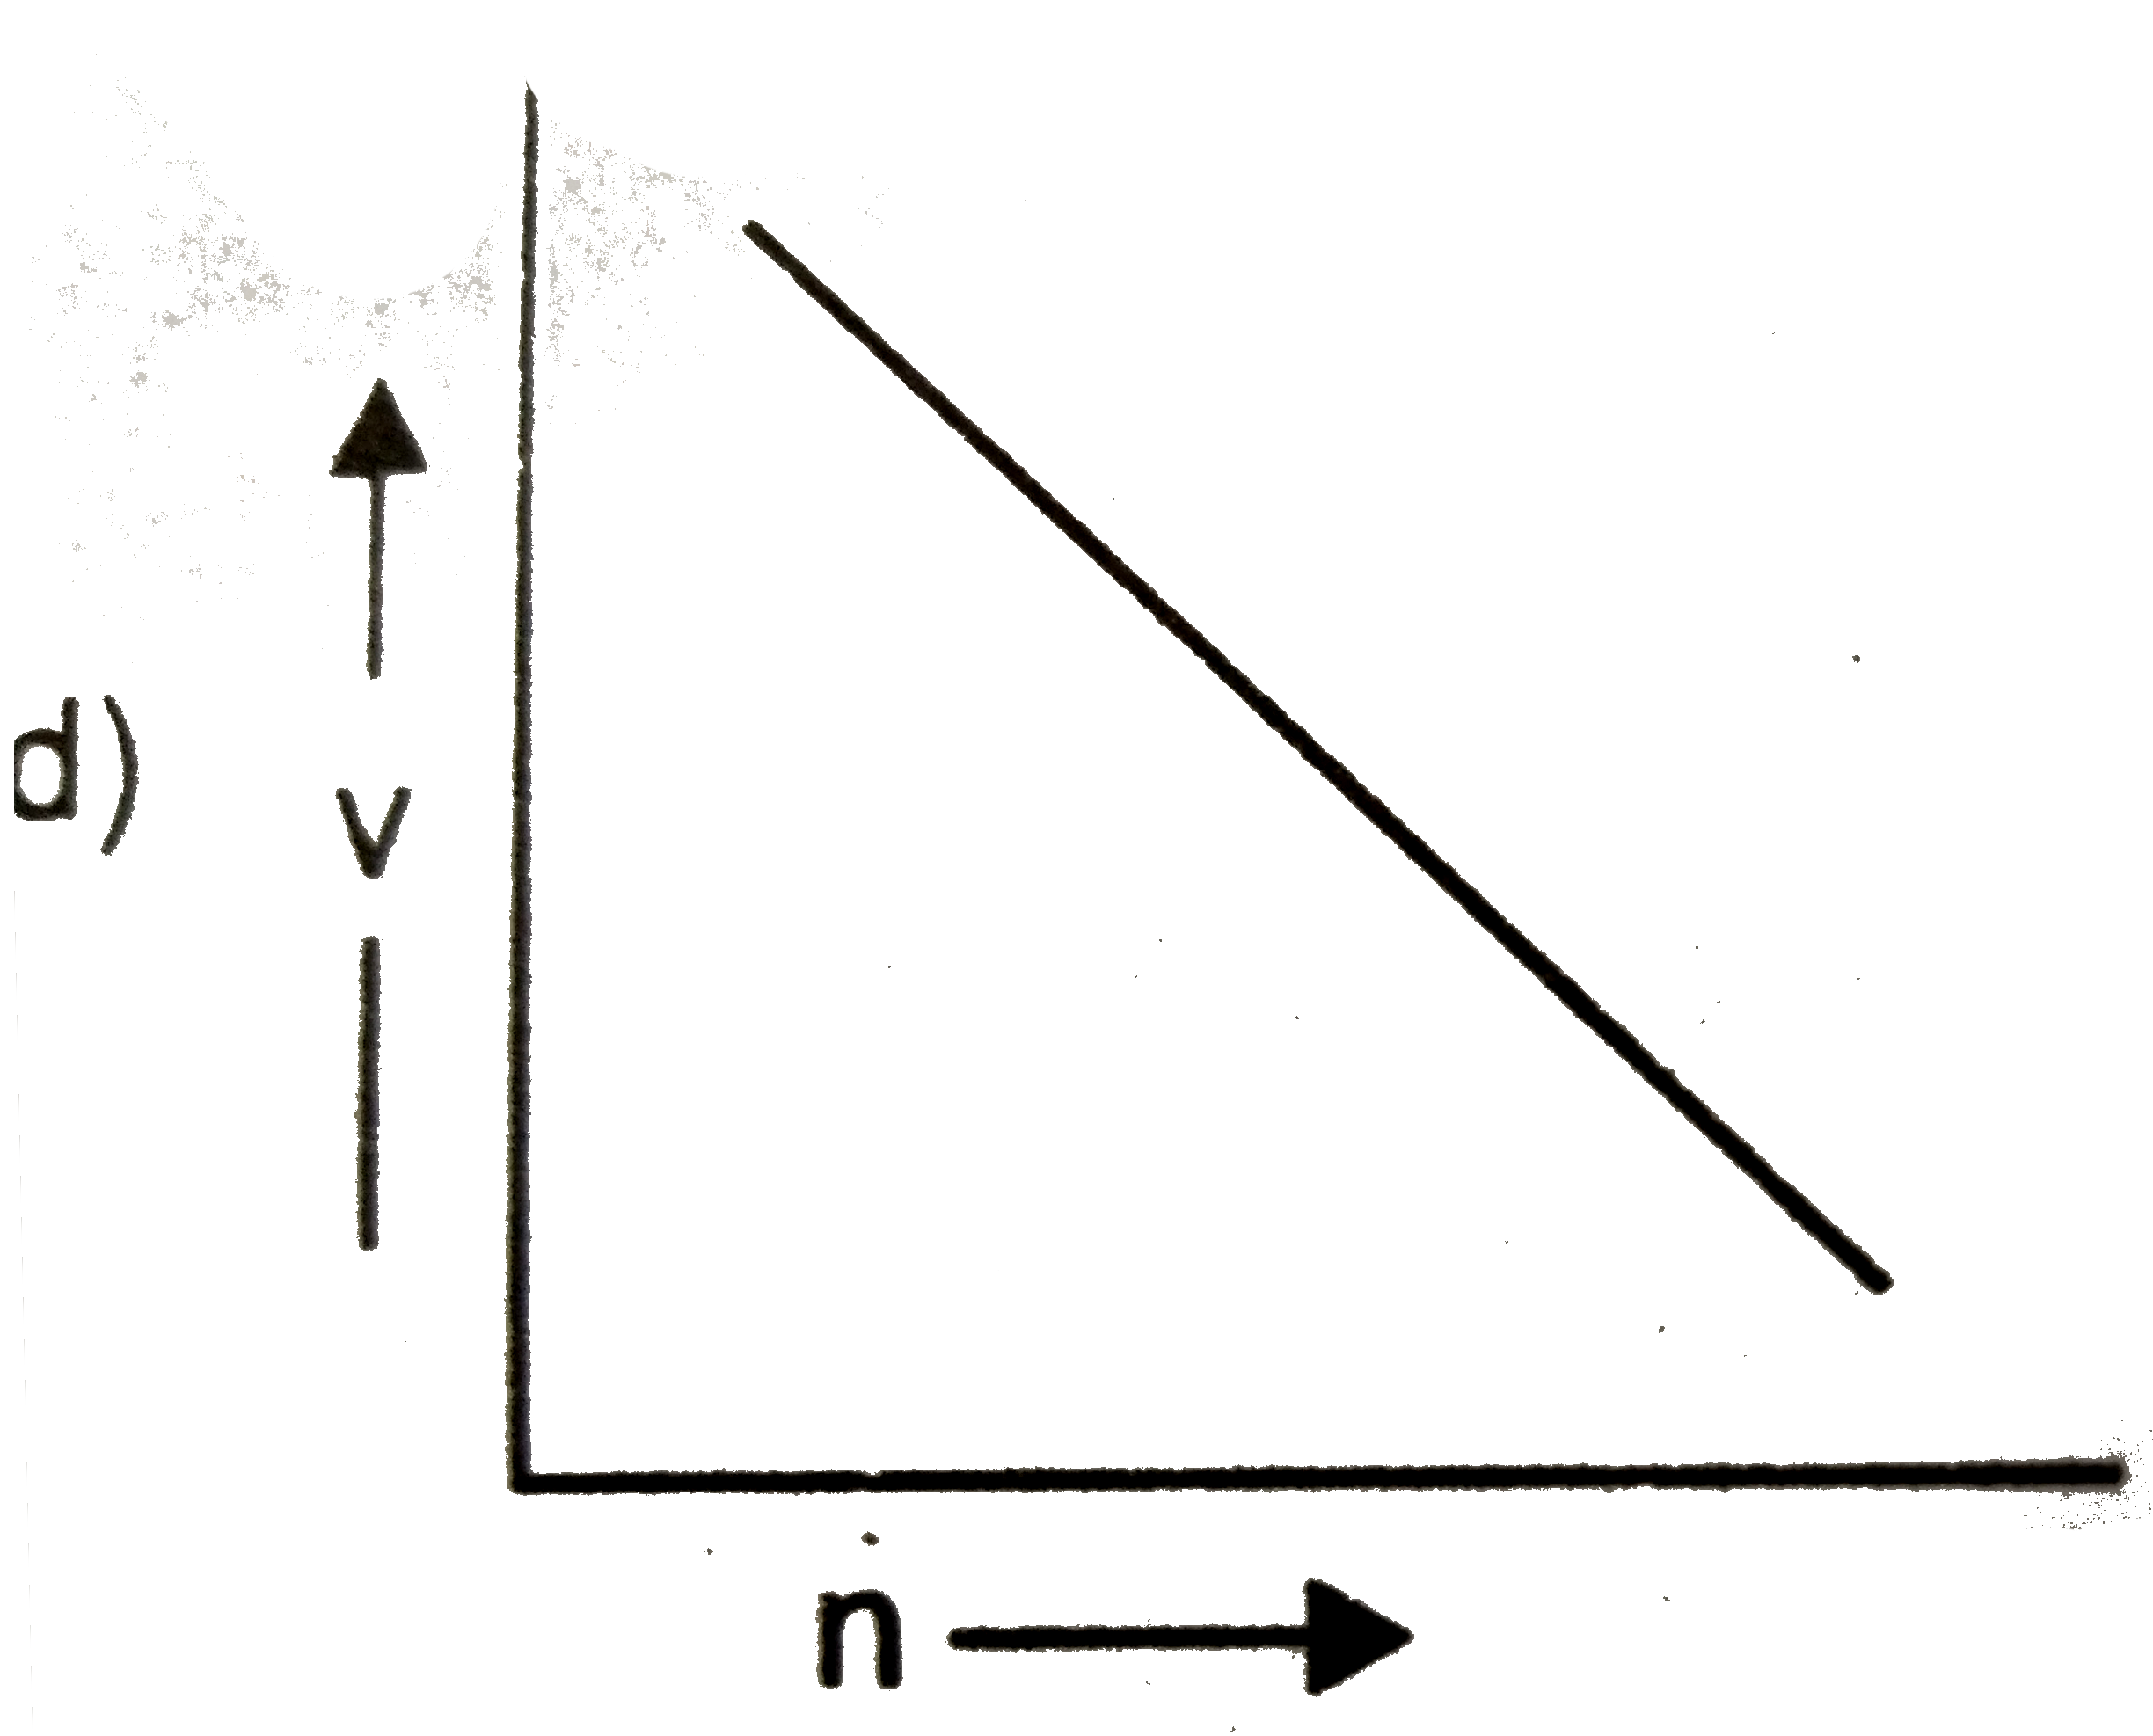
Which of the following is incorrect about the given graph ?
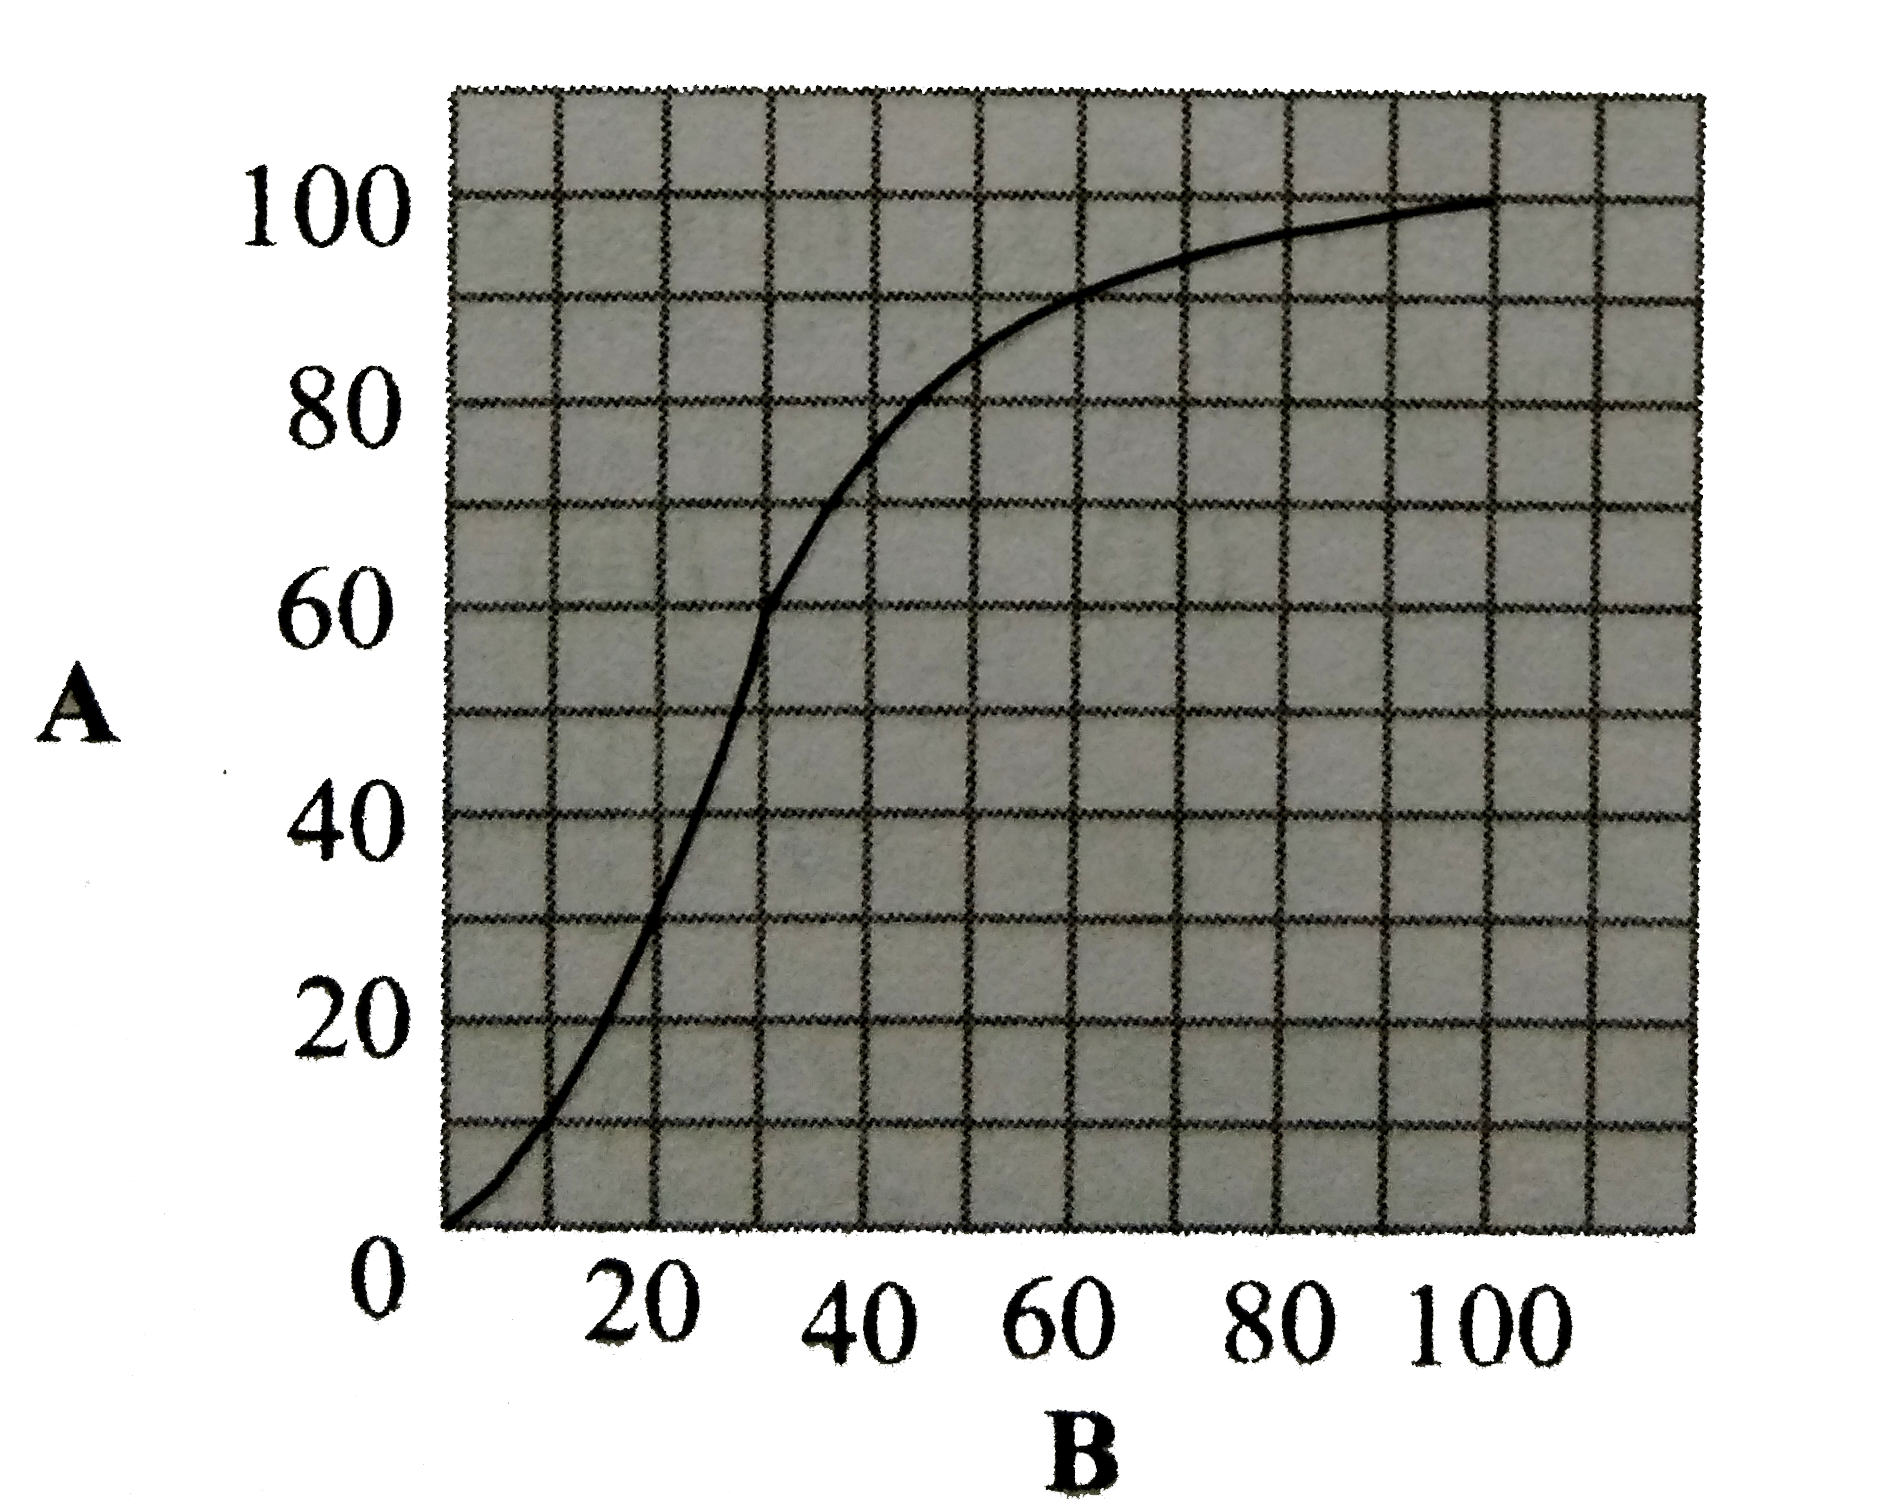 AThe curve is called oxygen dissociation curve.BThe part 'A' represents percentage saturation of haemologbin with oxygen.CThe part 'B' represents partial pressure of carbon dioxide.DThis curve is highly useful in studying the effect of factors like PCO2,H+ concentration, etc. on binding of CO2 with haemoglobin.
Which of the following is incorrect about the given graph ?
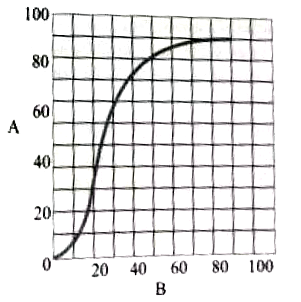 AThe curve is called oxygen dissociation curveBThe part 'A' represents percentage saturation of haemoglobin with oxygenCThe part 'B' represents partial pressure of carbon dioxideDThis curve is highly useful in studying the effect of factors like pCO2 H' concentration etc
Which of the following graph is/are incorrect for 2p orbital ?
View SolutionWhich of the following is most viscous liquid ?
View SolutionWhich of the following is most viscous liquid ?
View SolutionWhich of the following is incorrect regarding the solutions of alkali in liquid NH3 ?
View SolutionWhich of following is the most viscous liquid ?
View Solution

