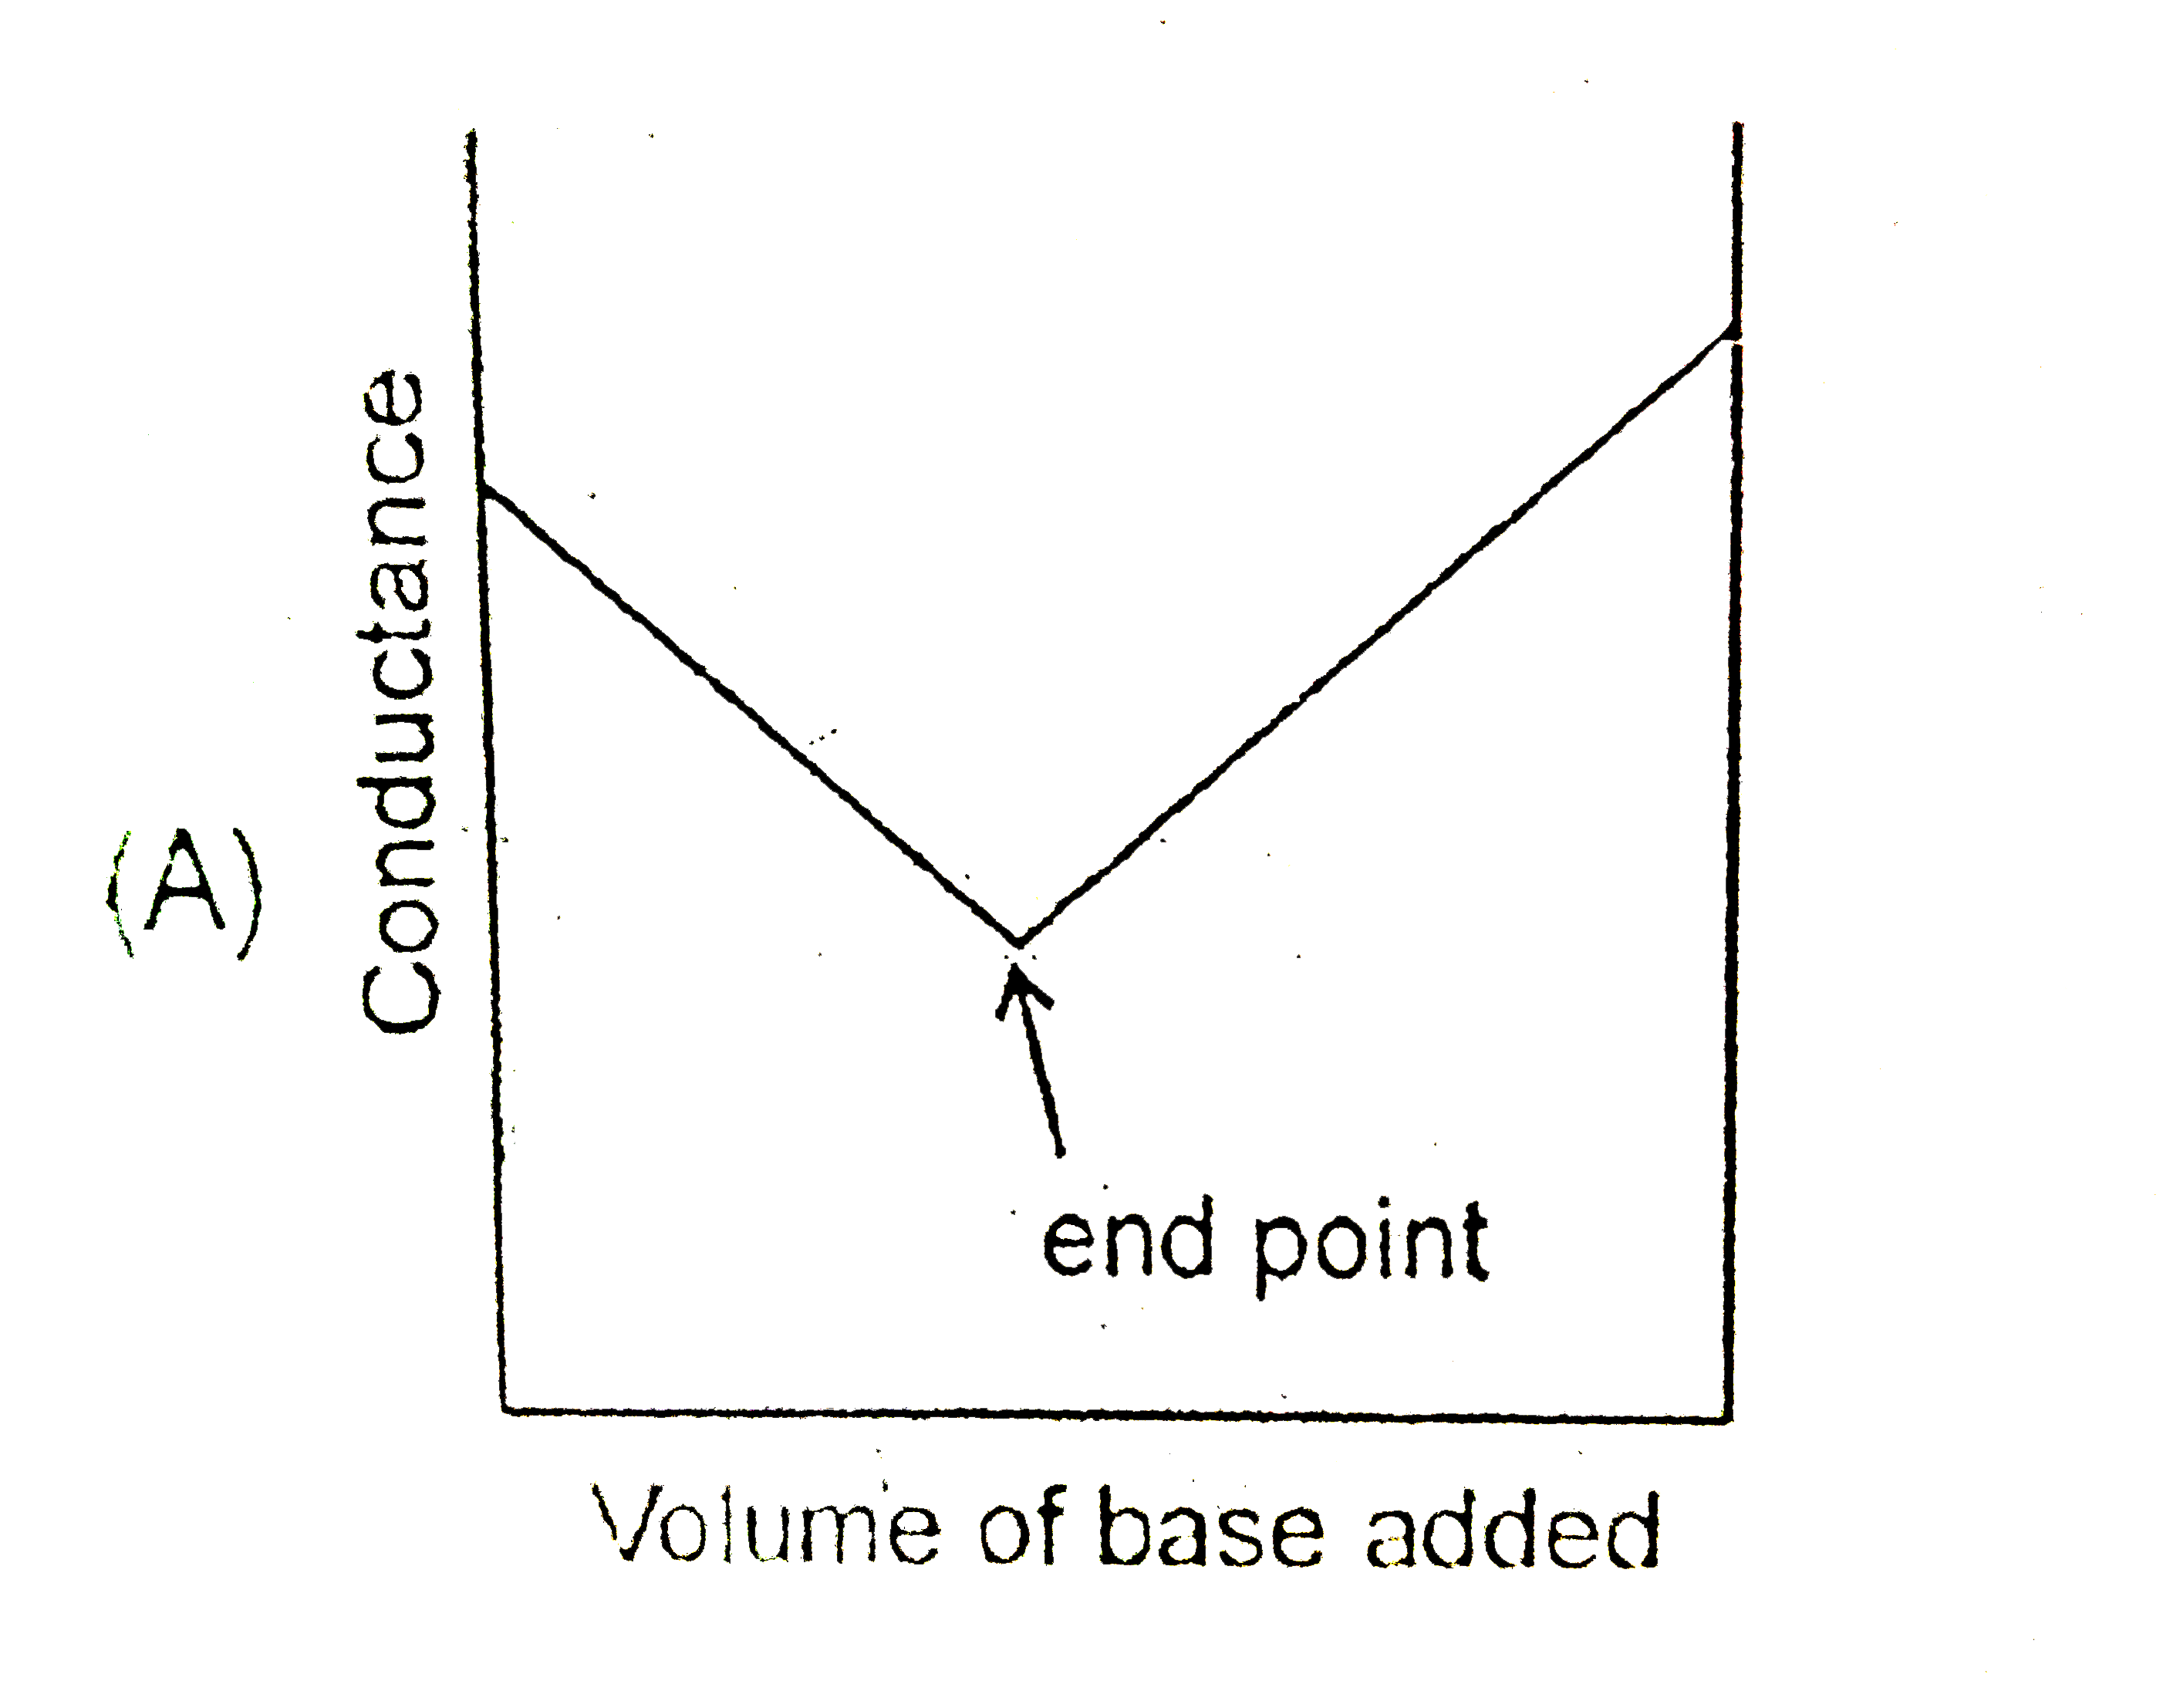
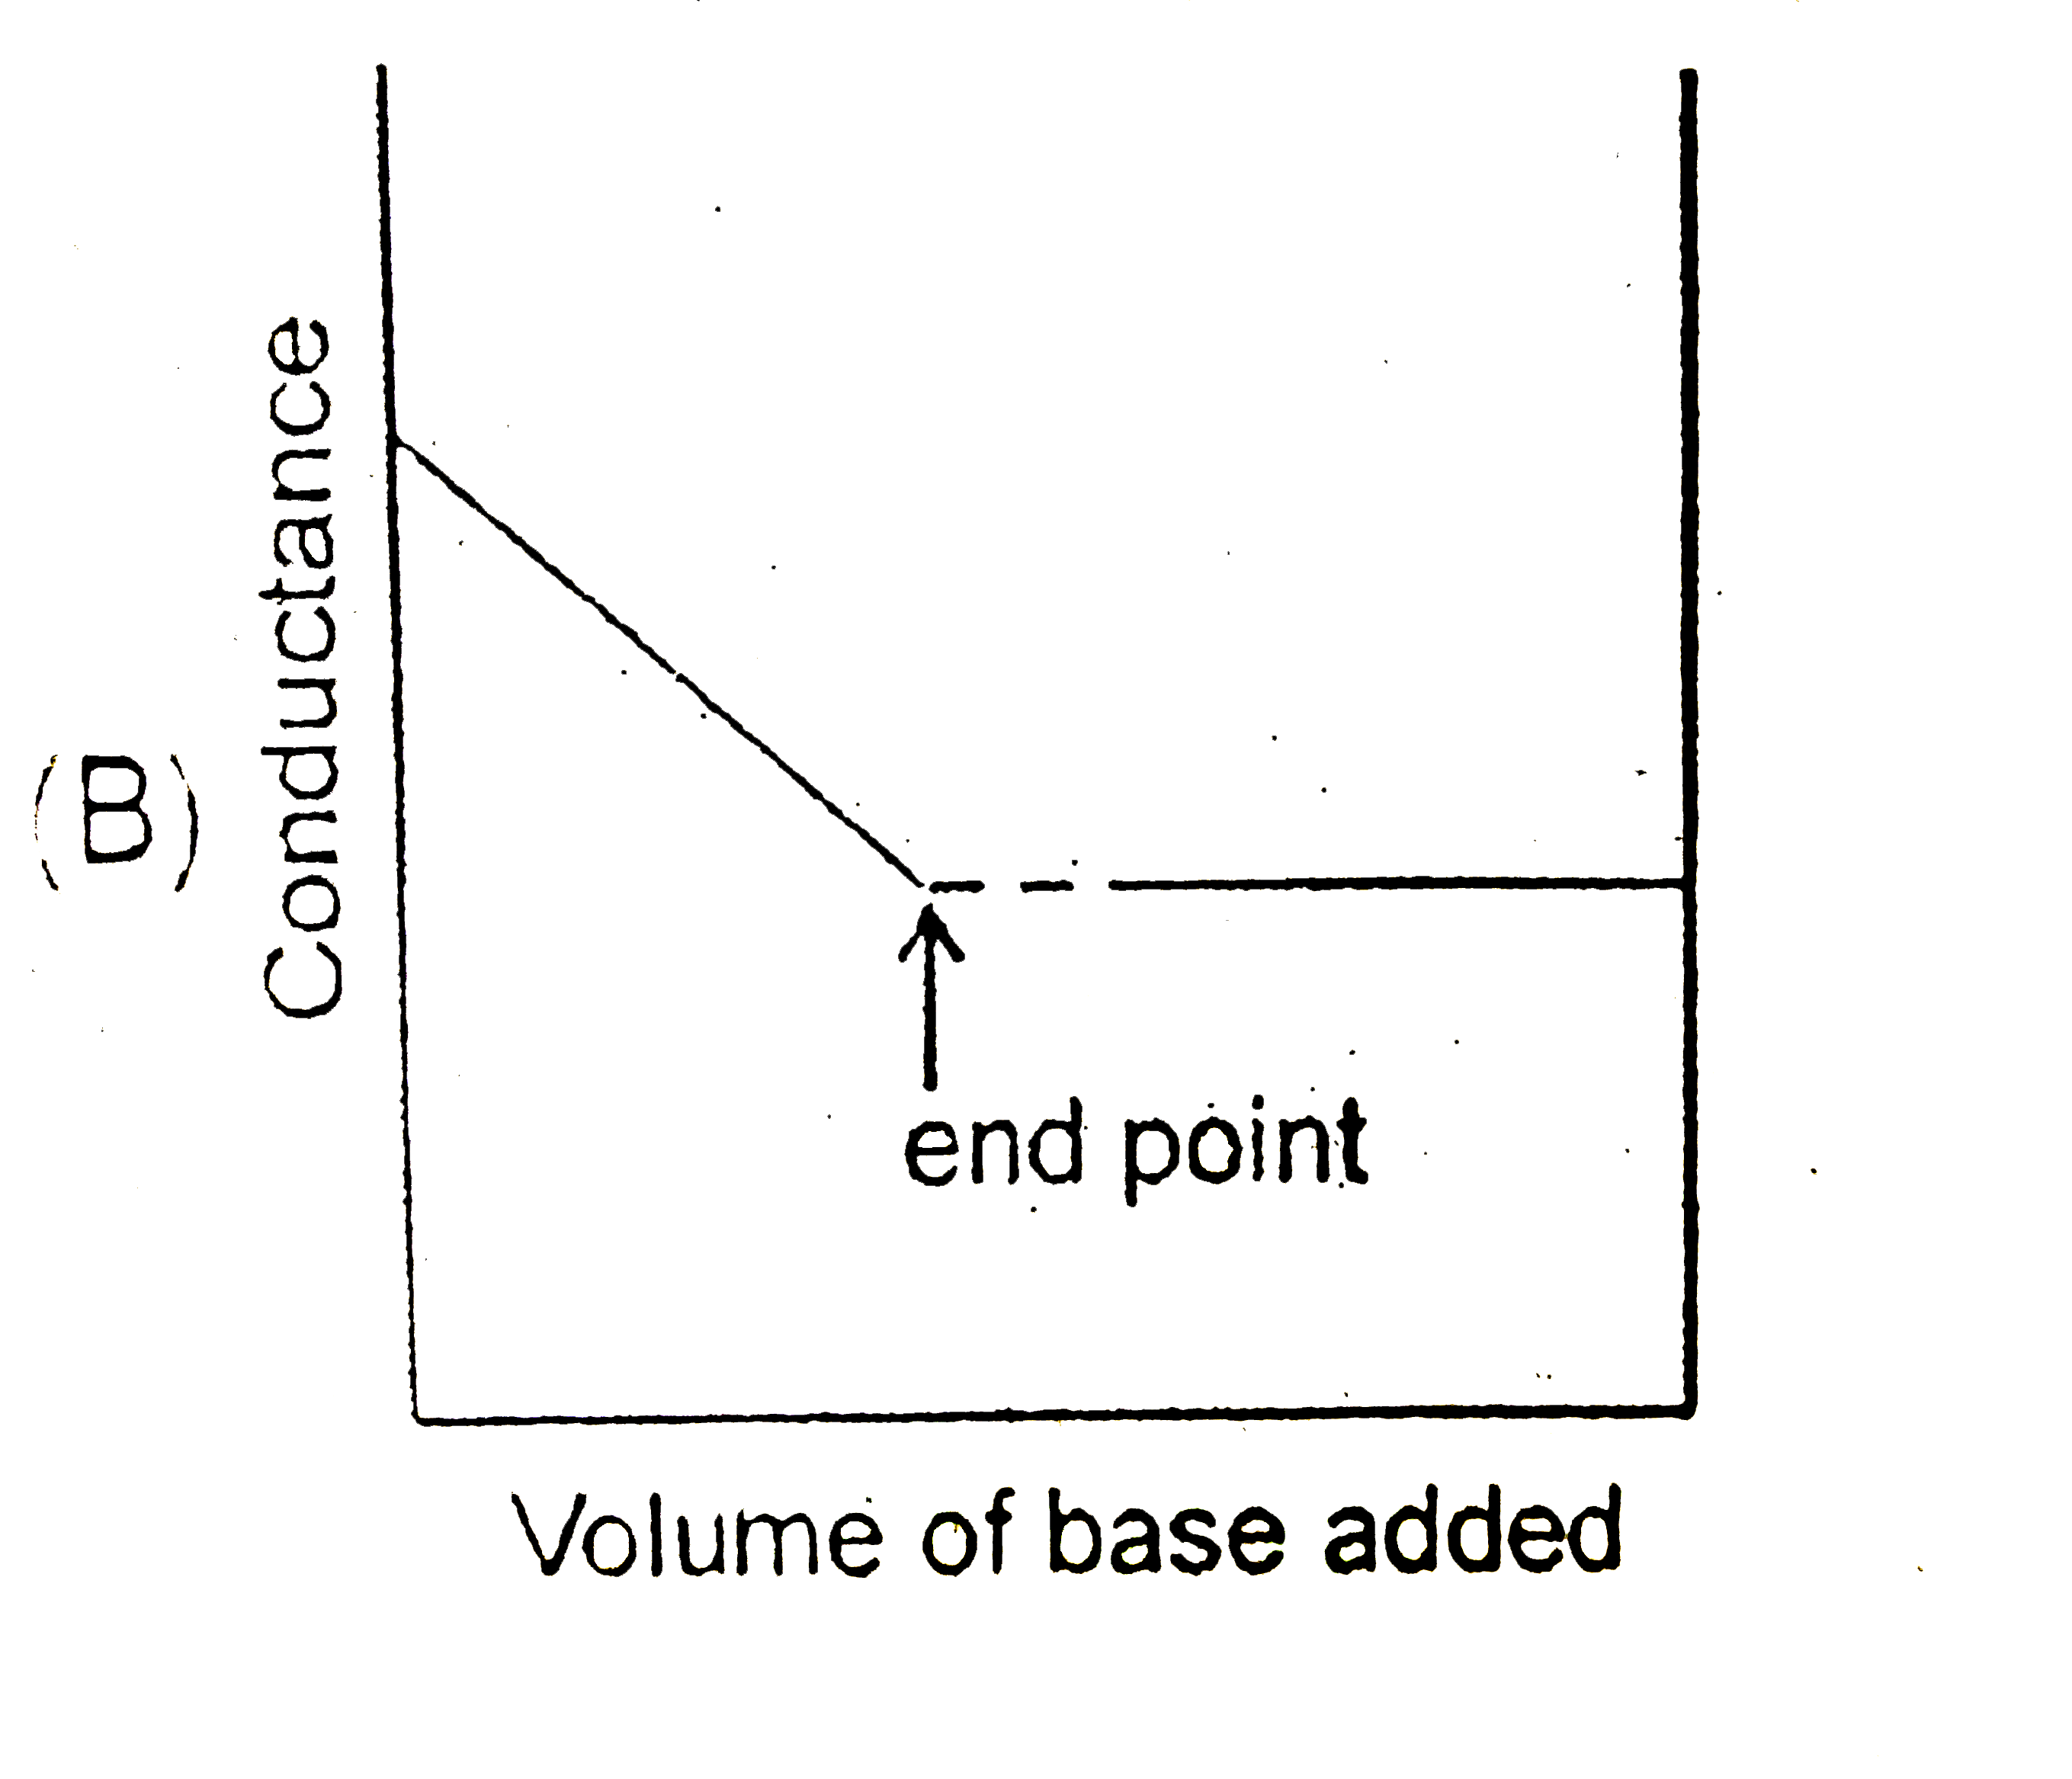
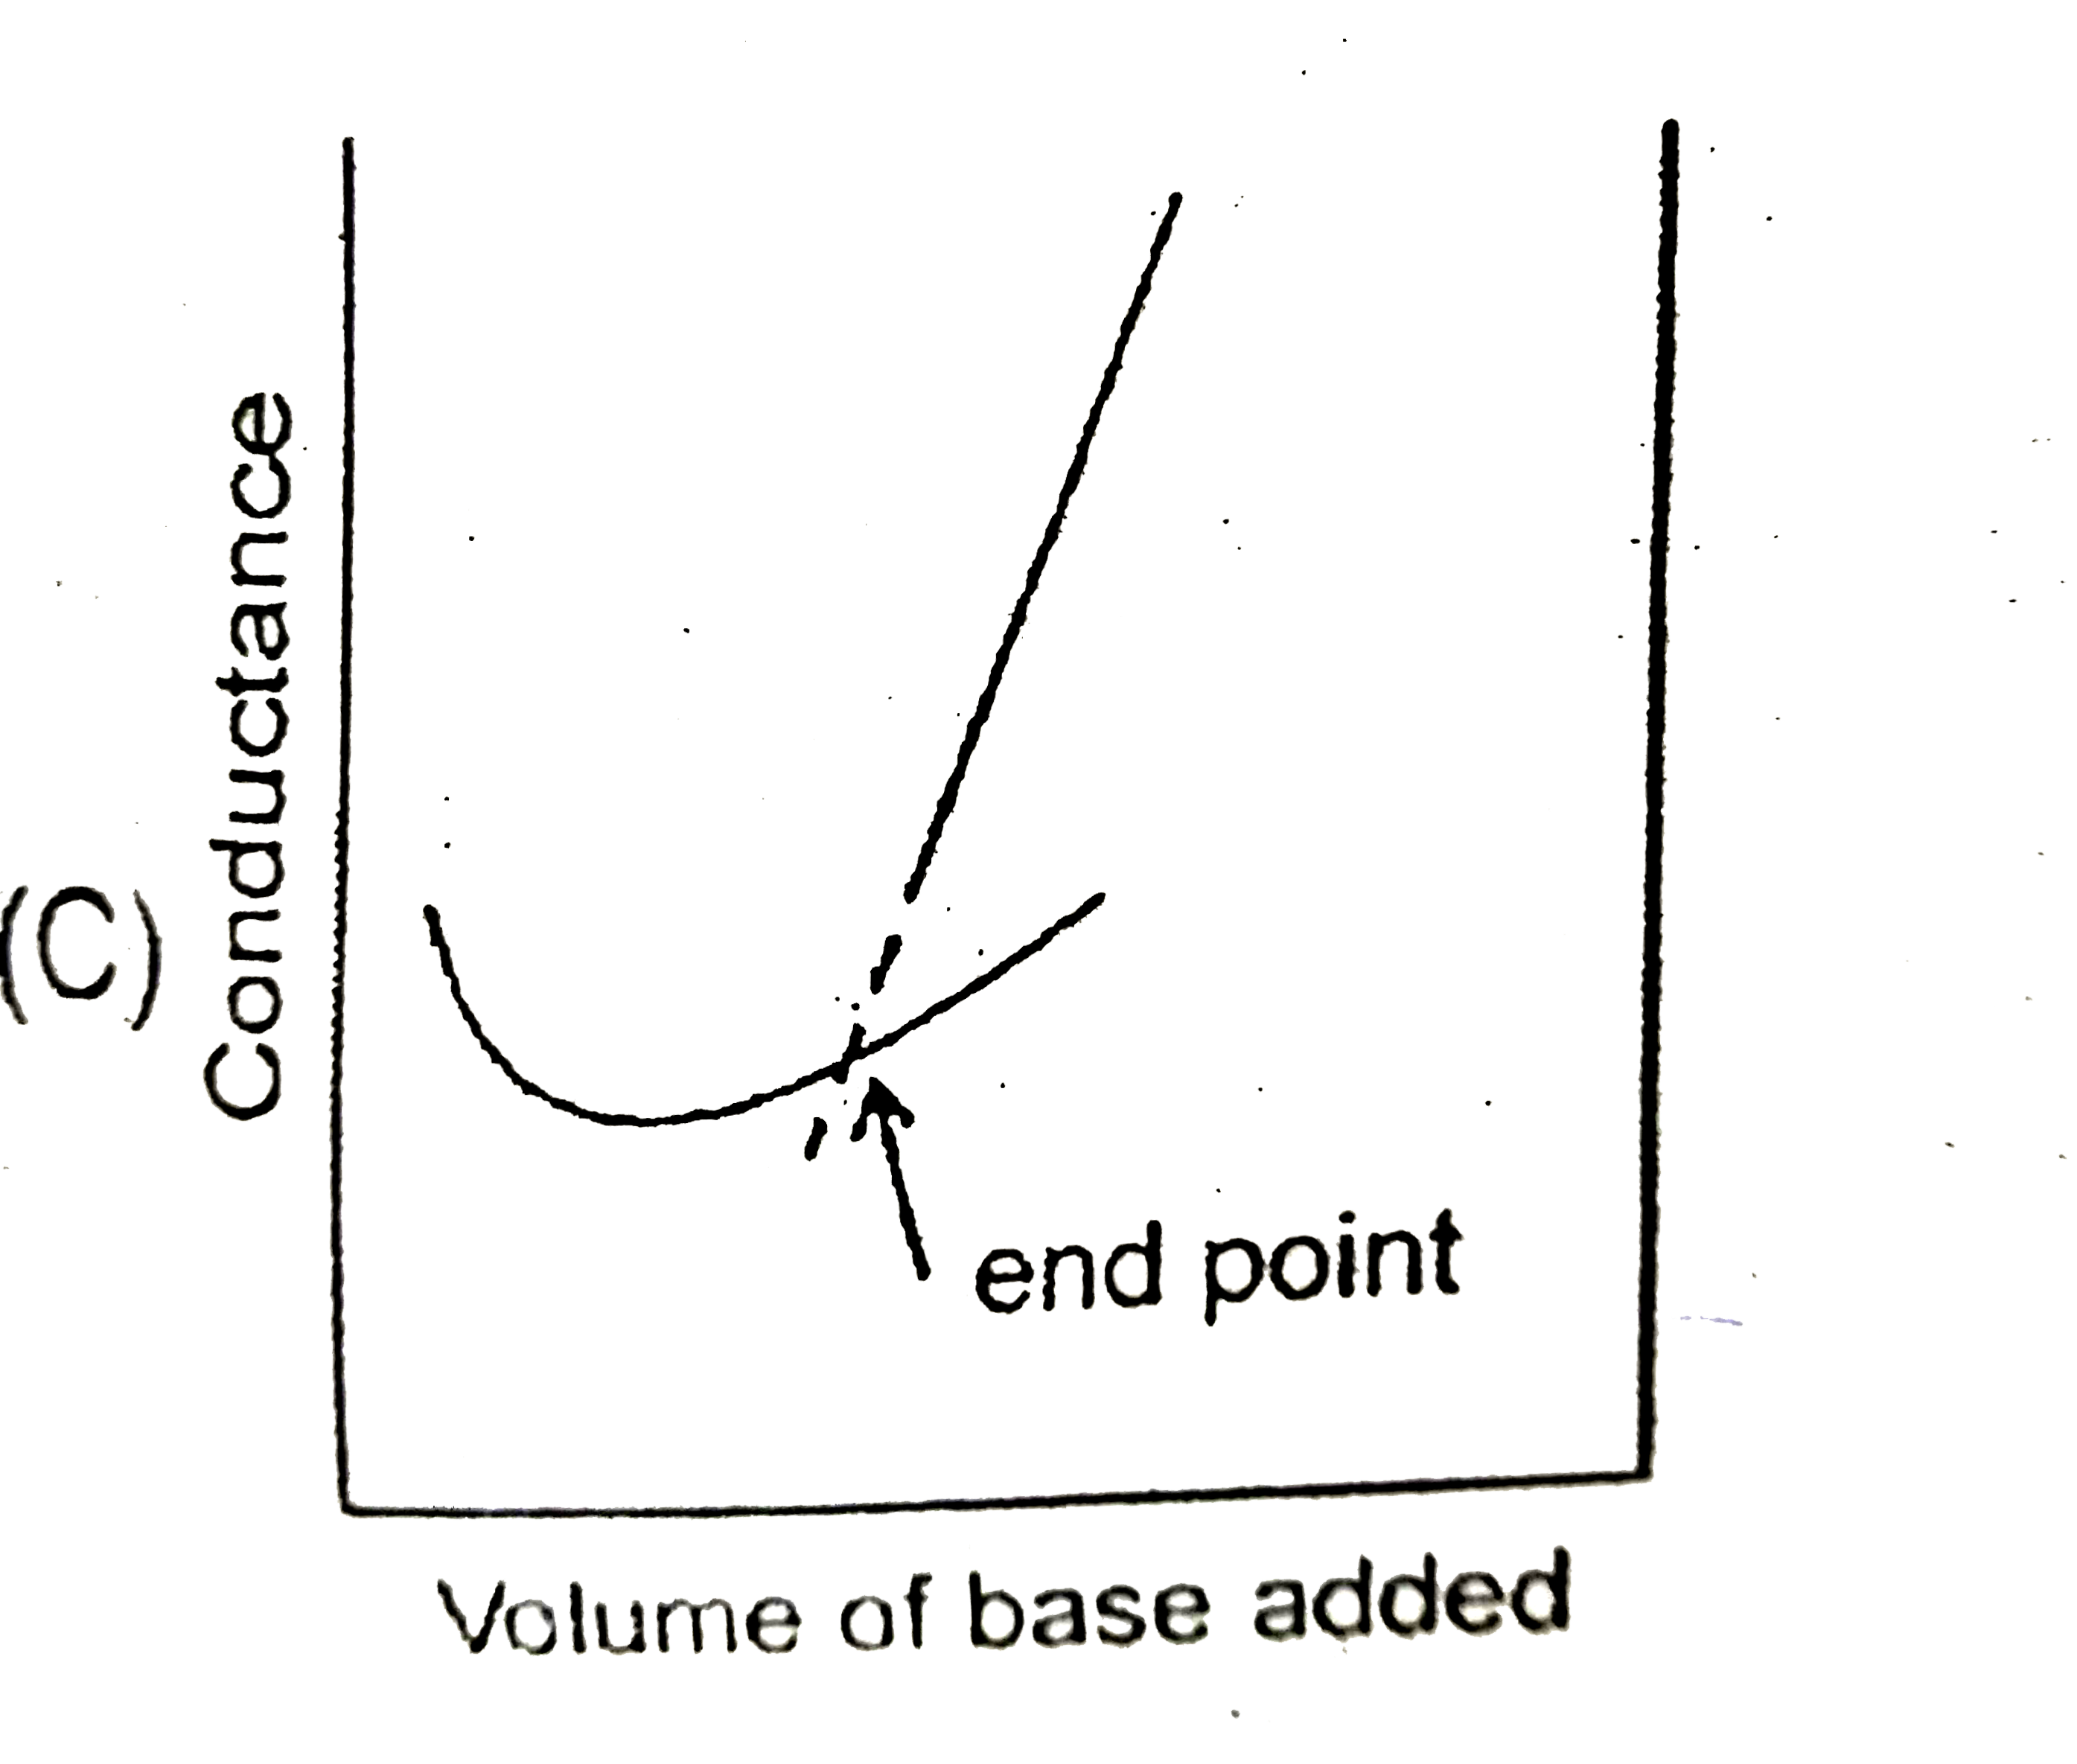
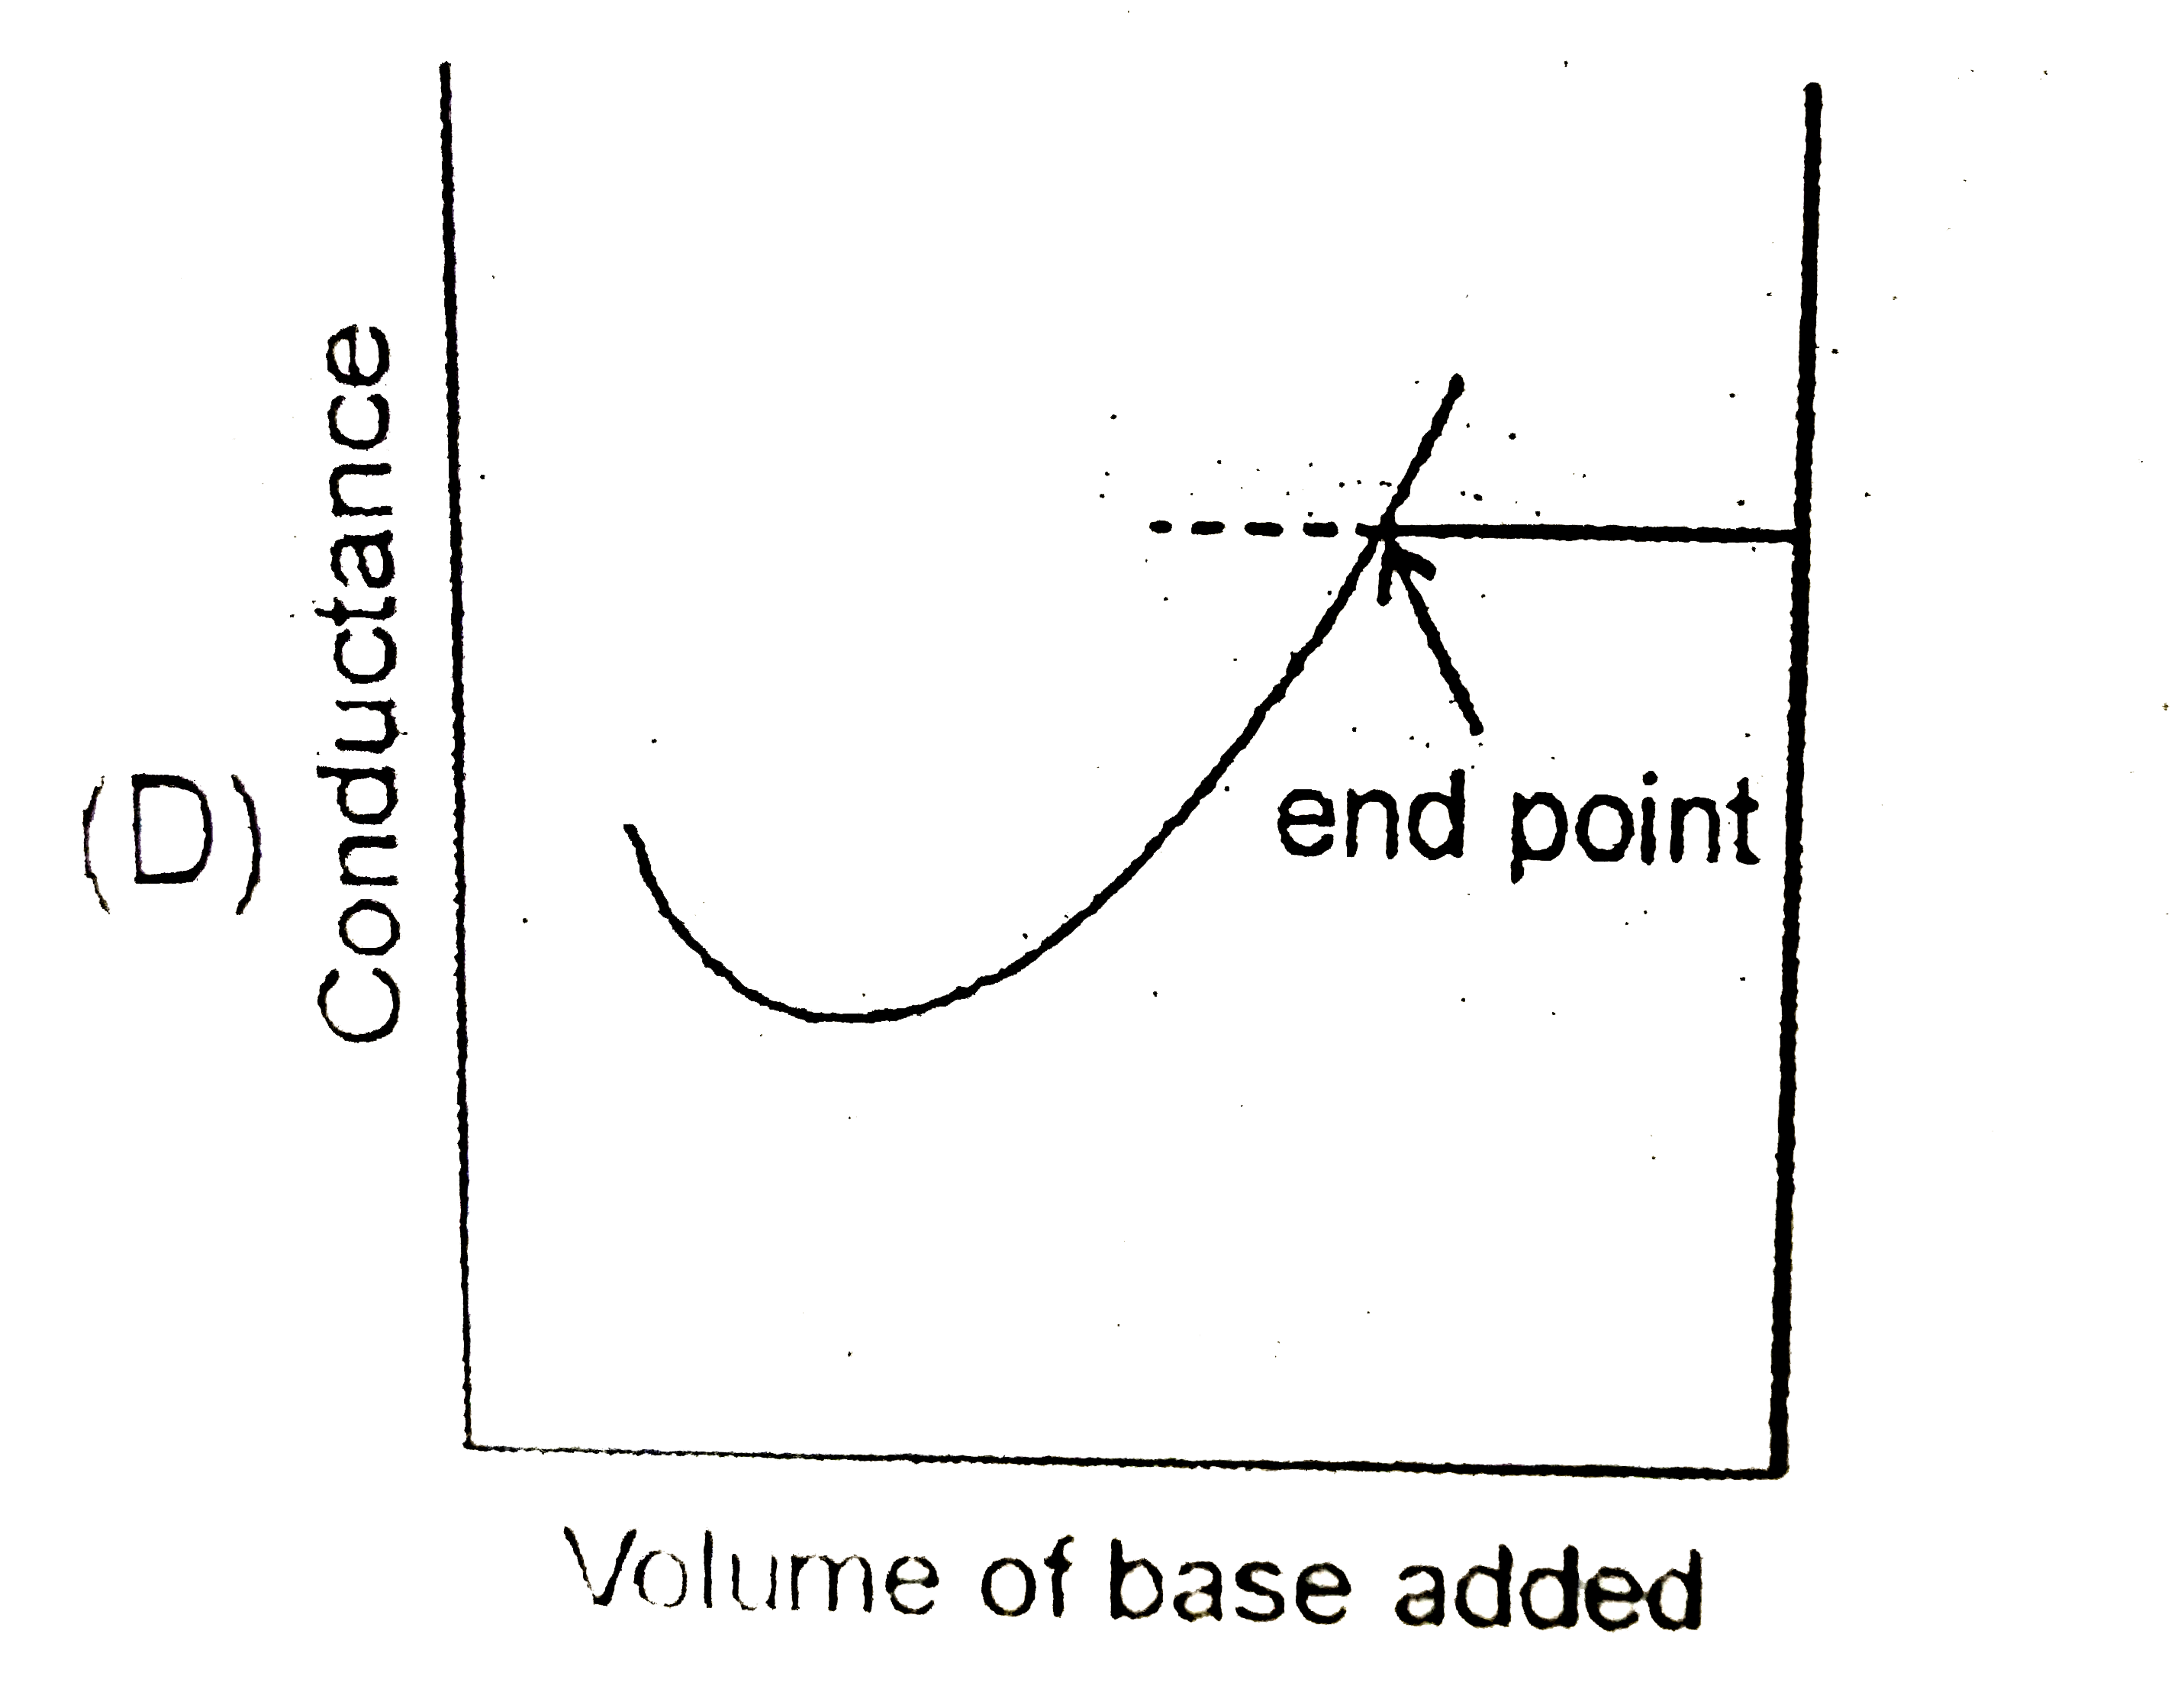
Conductance measurements and be used to detect the end point of acid-base titrations. Which of the following plots correctly represents the end point of the titration of strong acid and a strong base?
A

B

C

D

Video Solution
Text Solution
The correct Answer is:A
H++Cl−+NaOH→Na++Cl−+H2O to conductance Ist decreases since no. of ions decreases after end point it increases.
|
Topper's Solved these Questions
- ELECTROCHEMISRYBOOK - RESONANCECHAPTER - ELECTROCHEMISRYEXERCISE - Comprehension
31 Videos
- ELECTROCHEMISRYBOOK - RESONANCECHAPTER - ELECTROCHEMISRYEXERCISE - Exercise 3
7 Videos
- ELECTROCHEMISRYBOOK - RESONANCECHAPTER - ELECTROCHEMISRYEXERCISE - Subjective Questions
14 Videos
- ELECTRO CHEMISTRYBOOK - RESONANCECHAPTER - ELECTRO CHEMISTRYEXERCISE - PHYSICAL CHEMITRY (ELECTROCHEMISTRY)
53 Videos
- EQUIVALENT CONCEPT & TITRATIONSBOOK - RESONANCECHAPTER - EQUIVALENT CONCEPT & TITRATIONSEXERCISE - Part -IV
22 Videos
Similar Questions
Knowledge Check
Which indicator can be used in the titration of strong acid and strong base
AOnly phenoplphthaleinBOnly methyl orangeCEitehr of the twoDRed litmusWhich of the following curves corresponds to the titration of a weak base with a strong acid?
A B
B C
C D
D
The best indicator for the detection of the end point in the titration of a weak acid and a strong base is
AMethy1 orange (pH range 3→4)BMethy1 red (pH range 4→6)CThymol blue (pH range 8→3)DPhemolphethalein (pH range 8→10)
Salts Of Strong Acids And Strong Bases
View SolutionWhich of the following plots will obtained for a conductomeric titration of strong acid against a weak base?
View Solutionwhich of the following plots will obtained for a conductometric titration of strong acid against a weak base?
View SolutionEosin used to detect the end point of precipitation titration by adsorption is called
View SolutionThe best indicator for detection of end point in titration of a weak acid and a strong base is
View Solution
