The potential energy curve for the H2 molecule as a function of internuclear distance is :
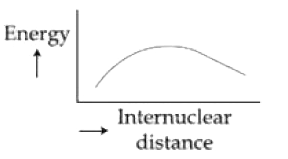
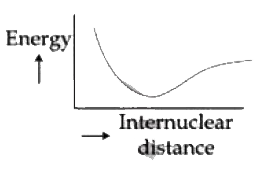
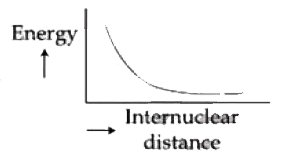
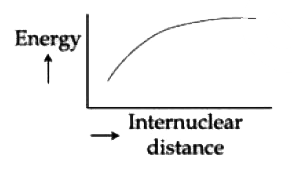
To solve the question regarding the potential energy curve for the H2 molecule as a function of internuclear distance, we will analyze the behavior of potential energy as the distance between the two hydrogen atoms changes.
1. Understanding the Potential Energy Curve:
- The potential energy of a molecule is influenced by the distance between its constituent atoms. For H2, as the two hydrogen atoms approach each other, their potential energy changes due to attractive and repulsive forces.
2. High Internuclear Distance:
- When the internuclear distance is very high, the two hydrogen atoms are essentially non-interacting. In this state, the potential energy is at a high level because the stability of the system is low. The atoms are far apart, and there is no bond formed.
3. Decreasing Distance:
- As the hydrogen atoms move closer together, the attractive forces (due to the formation of a covalent bond) begin to dominate. This results in a decrease in potential energy as the stability of the system increases.
4. Bond Formation:
- At a certain point, the atoms reach an optimal distance where the potential energy is at its minimum. This distance corresponds to the bond length of the H2 molecule, where the attractive forces balance the repulsive forces between the electrons and nuclei.
5. Too Close Together:
- If the hydrogen atoms are brought even closer than this optimal distance, the repulsive forces (due to electron-electron repulsion and nucleus-nucleus repulsion) start to dominate. This leads to an increase in potential energy, indicating a decrease in stability.
6. Graph Interpretation:
- The graph of potential energy versus internuclear distance typically shows a curve that decreases to a minimum point (the bond length) and then increases again as the distance decreases further. The correct curve will reflect this behavior.
7. Identifying the Correct Option:
- Based on the described behavior of potential energy with respect to internuclear distance, we can analyze the provided options. The correct graph should show a curve that decreases to a minimum and then increases.
Conclusion:
After analyzing the options, we find that the second option correctly represents the potential energy curve for the H2 molecule as a function of internuclear distance.
Final Answer: The correct option is 2.
- The potential energy of a molecule is influenced by the distance between its constituent atoms. For H2, as the two hydrogen atoms approach each other, their potential energy changes due to attractive and repulsive forces.
- When the internuclear distance is very high, the two hydrogen atoms are essentially non-interacting. In this state, the potential energy is at a high level because the stability of the system is low. The atoms are far apart, and there is no bond formed.
- As the hydrogen atoms move closer together, the attractive forces (due to the formation of a covalent bond) begin to dominate. This results in a decrease in potential energy as the stability of the system increases.
- At a certain point, the atoms reach an optimal distance where the potential energy is at its minimum. This distance corresponds to the bond length of the H2 molecule, where the attractive forces balance the repulsive forces between the electrons and nuclei.
- If the hydrogen atoms are brought even closer than this optimal distance, the repulsive forces (due to electron-electron repulsion and nucleus-nucleus repulsion) start to dominate. This leads to an increase in potential energy, indicating a decrease in stability.
- The graph of potential energy versus internuclear distance typically shows a curve that decreases to a minimum point (the bond length) and then increases again as the distance decreases further. The correct curve will reflect this behavior.
- Based on the described behavior of potential energy with respect to internuclear distance, we can analyze the provided options. The correct graph should show a curve that decreases to a minimum and then increases.
After analyzing the options, we find that the second option correctly represents the potential energy curve for the H2 molecule as a function of internuclear distance.
Topper's Solved these Questions
Similar Questions
The potential energy (U) of diatomic molecule is a function dependent on r (interatomic distance )as U=αr10−βr5−3
Where αandβ are positive constants. The equilrium distance between two atoms will be (2αβ)ab where a=___
View SolutionThe potential energy(y) curve for H2 formation as a function of inrtnuclear distance(x) of the H atoms is shown below
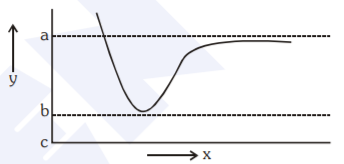
The bond energy of H2 is :
View Solution
Knowledge Check
In the potential energy curve for the formation of H2 molecule as a function of internuclear distance of H atoms, what happens at the minimum in the curve?
Anet force of attraction equals to of force repulsionBmost stable state of H2 is achievedCsystem aquires minimum energyDAll of theseThe potential energy (y) curve for H2 formation as a function of internuclear distance (x) of the H atoms is shown below.
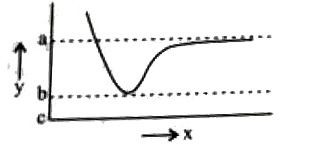
The bond energy of H2 isA(c−a)2B(b−a)2C(c−a)D(b−a)The potential energy(y) curve for H2 formation as a function of inrtnuclear distance(x) of the H atoms is shown below

The bond energy of H2 is :A(c−a)2B(b−a)2C(c−a)D(b−a)
These diagrams represent the potential energy U of a diatomic molecule as a function of the inter-atomic distance r. The diagram corresponds to stable molecule found in nature is.
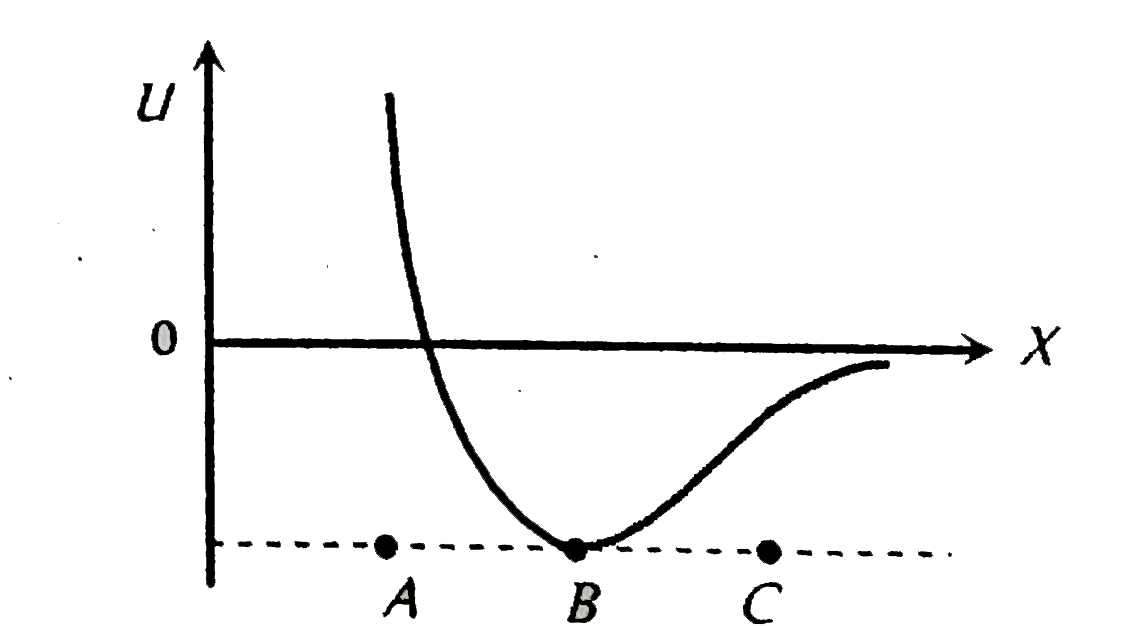
View SolutionThe potential energy U between two molecules as a function of the distance X between them has been shown in the figure. The two molecules are
View Solution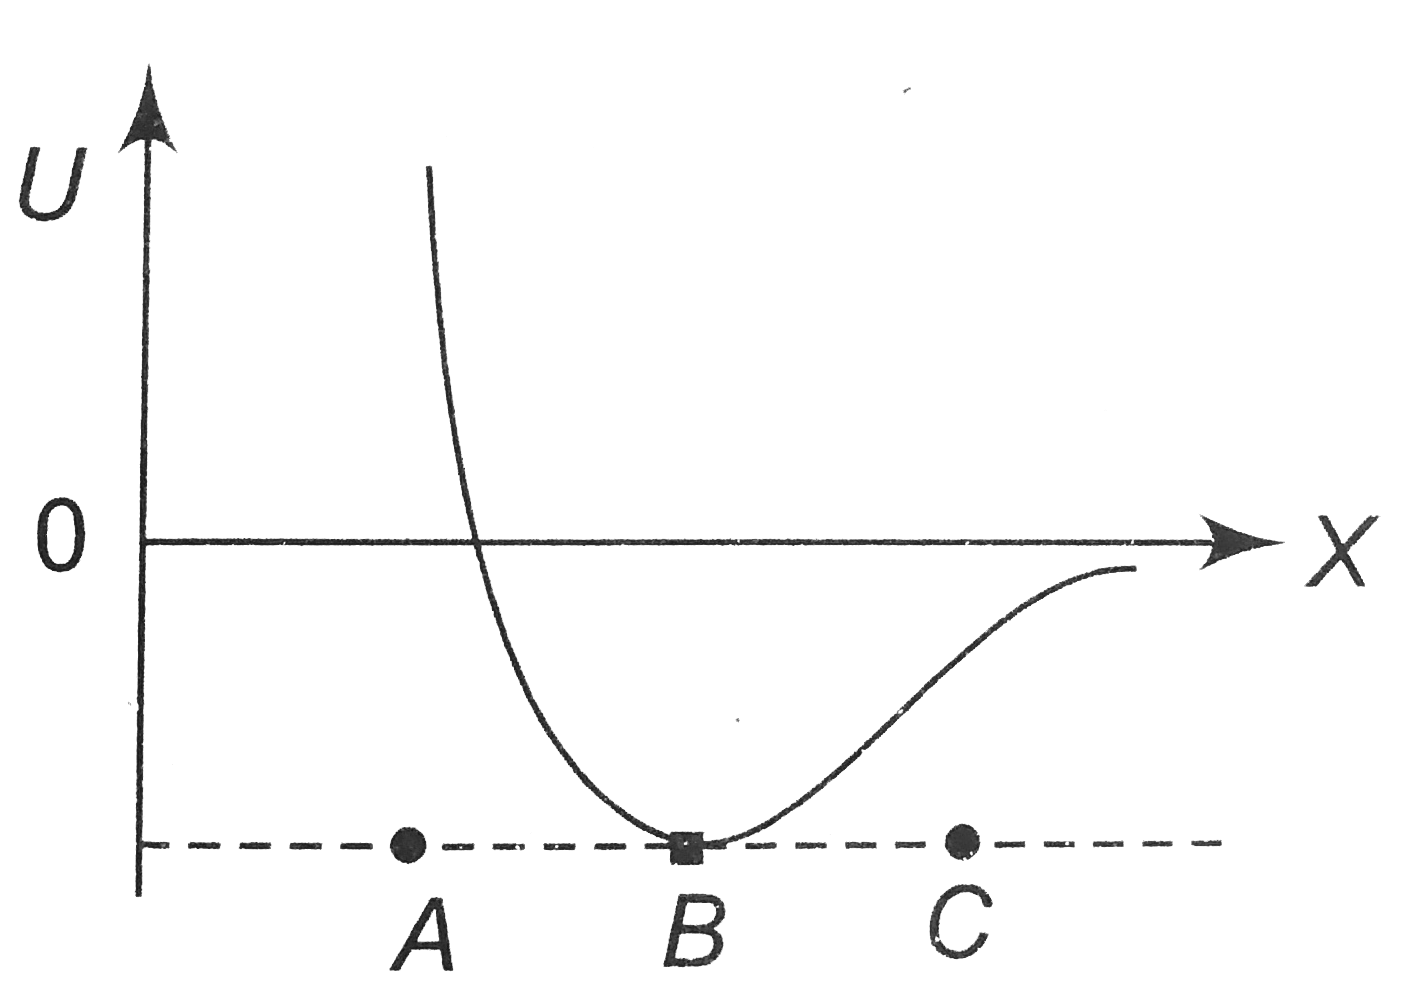
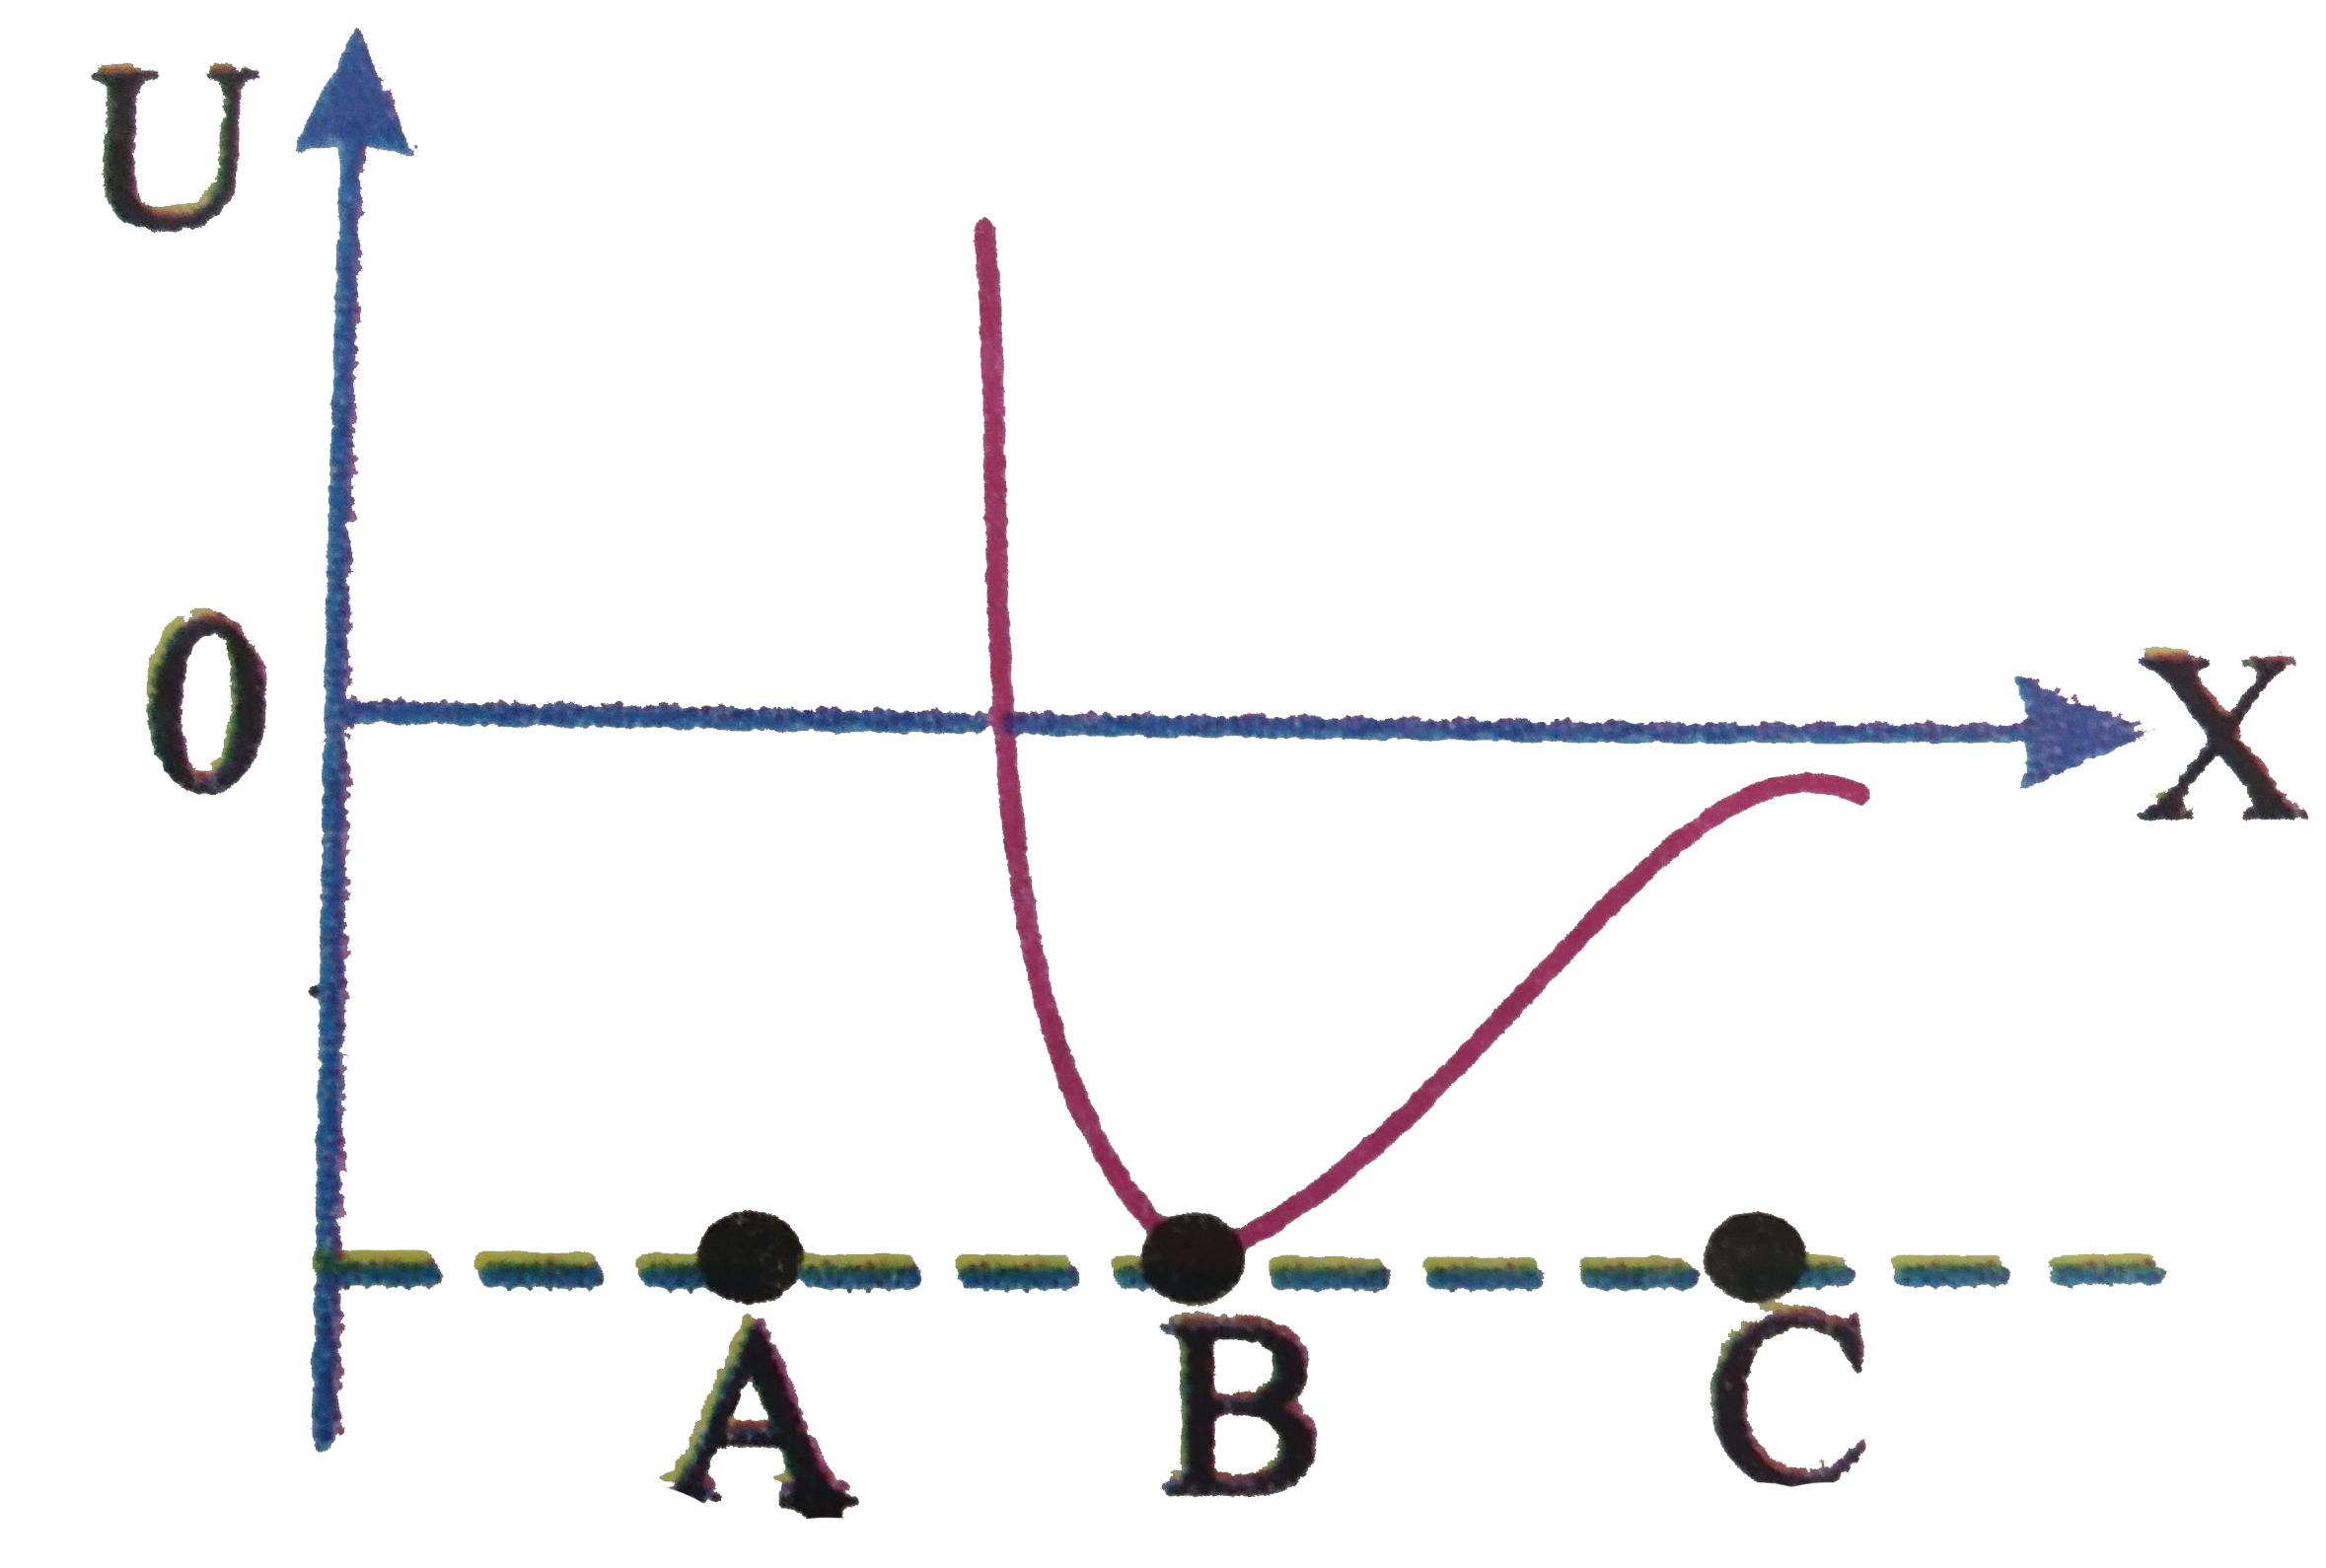
The potential energy U between two molecules as a function of the distance X between them has been shown in the figure. The two molecules are
View SolutionThe potential energy U between two molecules as a function of the distance X between them has been shown in the figure. The two moleucles are
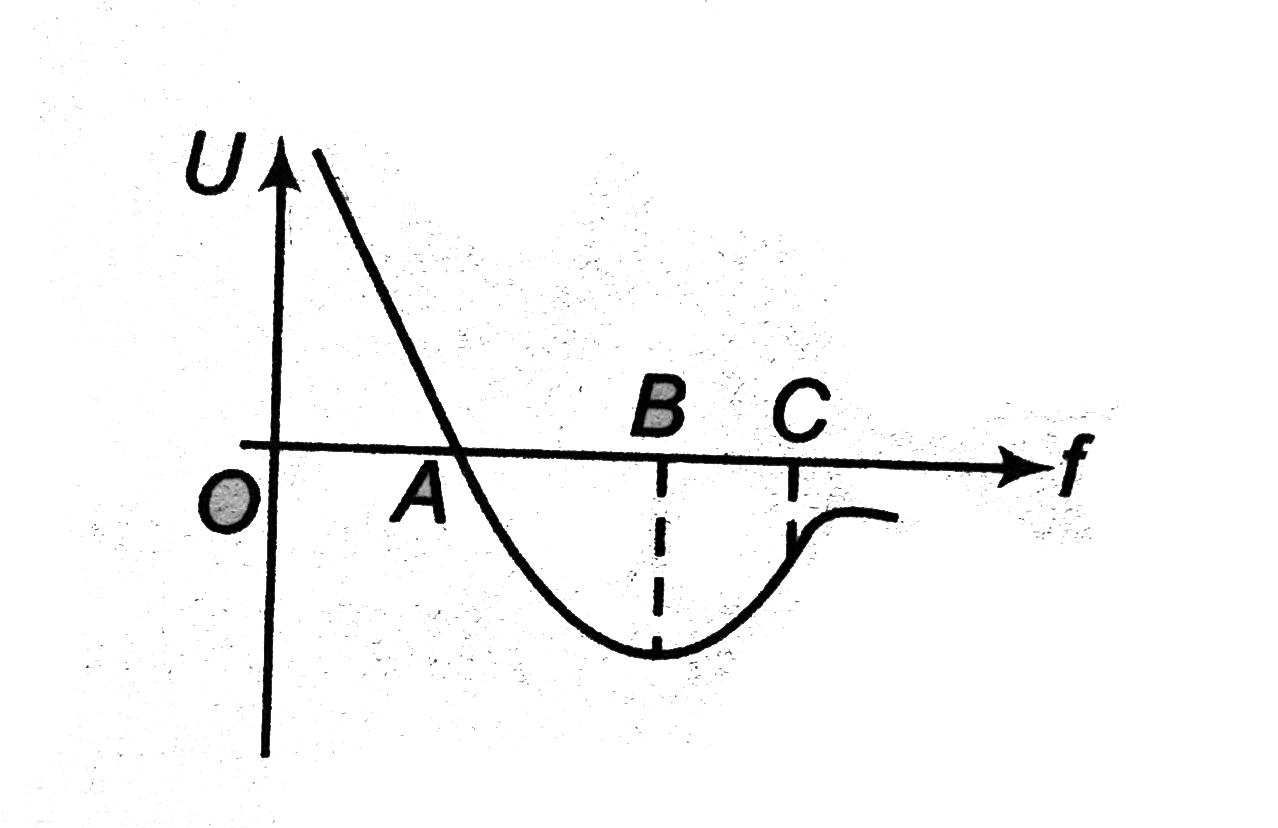
View SolutionThe potential energy U of diatomic molecules as a function of separation r is shown in figure. Identify the correct stateement.
View Solution
