A particle is resting over a smooth horizontal floor AT t = 0, a horizontal force starts acting on it. Magnitude of the force increases with time F = kt, where k is a constant. The two curves are drawn for this particle as shown
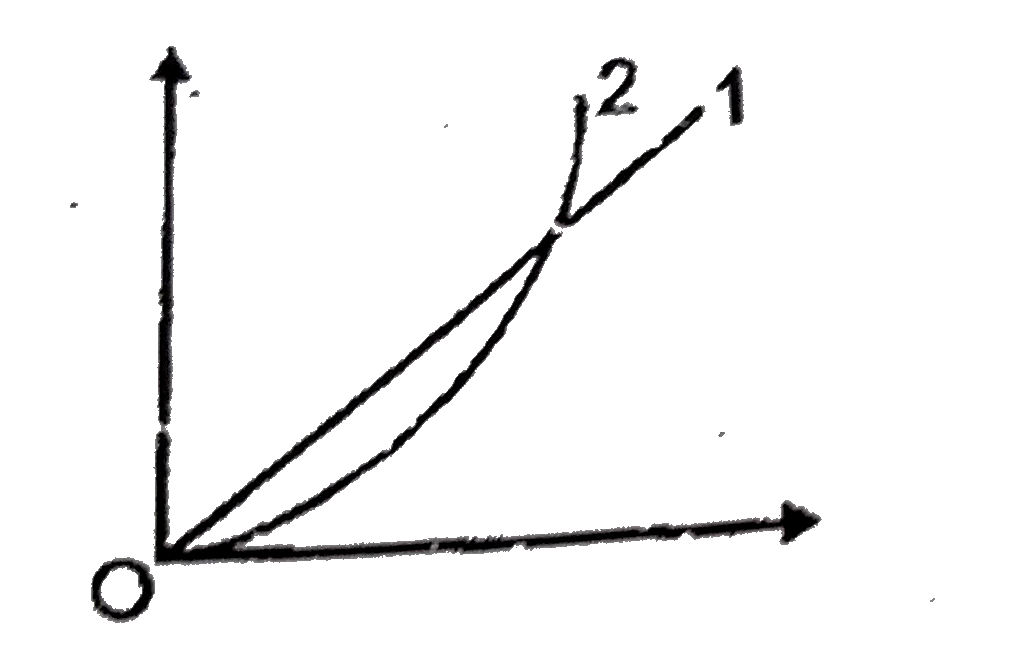
Curve-1 shows acceleration versus time
Curve-2 shows velocity versus time
Curve-2 shows velocity versus acceleration
Curve-1 shows velocity versus acceleration
The correct Answer is:A, B, C
F=kt⇒a=ktm, v=kt22m=k2m(mak)2=ma22k
Topper's Solved these Questions
Similar Questions
A particle is kept at rest at the origin. A constant force → F starts acting on it at t=0. Find the speed of the particle at time t.
View SolutionA block is resting over a rough horizontal floor. At t=0 a time -verying force starts acting on it , the force is described by equation F=kt where k is constant and r is in seconds Marks the cerrect statement (s) for this situation .
 View Solution
Knowledge Check
- Question 1 - Select One
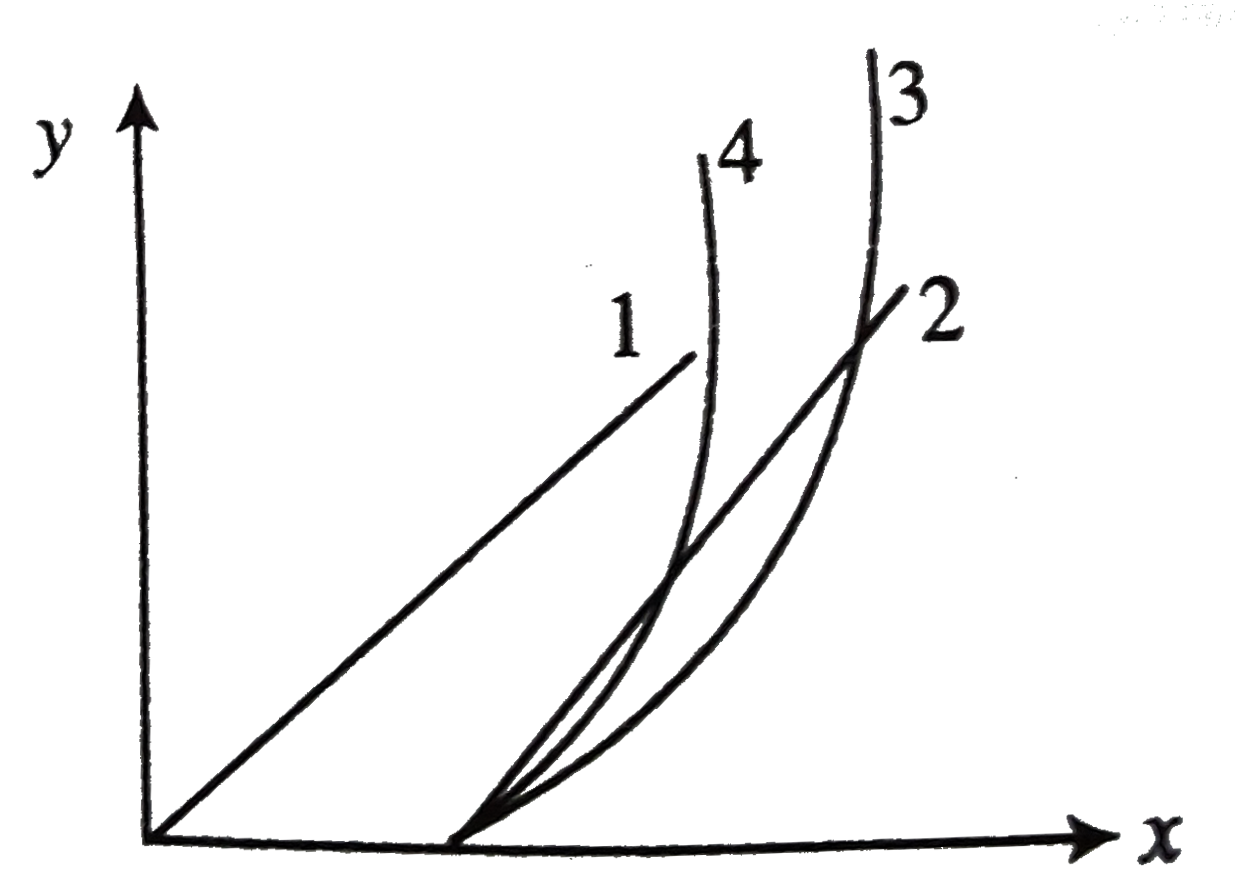
A particle is resting over a smooth horizontal floor. At t=0, a horizontal force starts acting on it. Magnitude of the force increases with the time according to law F=at, where 'a' is a constant. For figure which of the following statement is/are correct ?
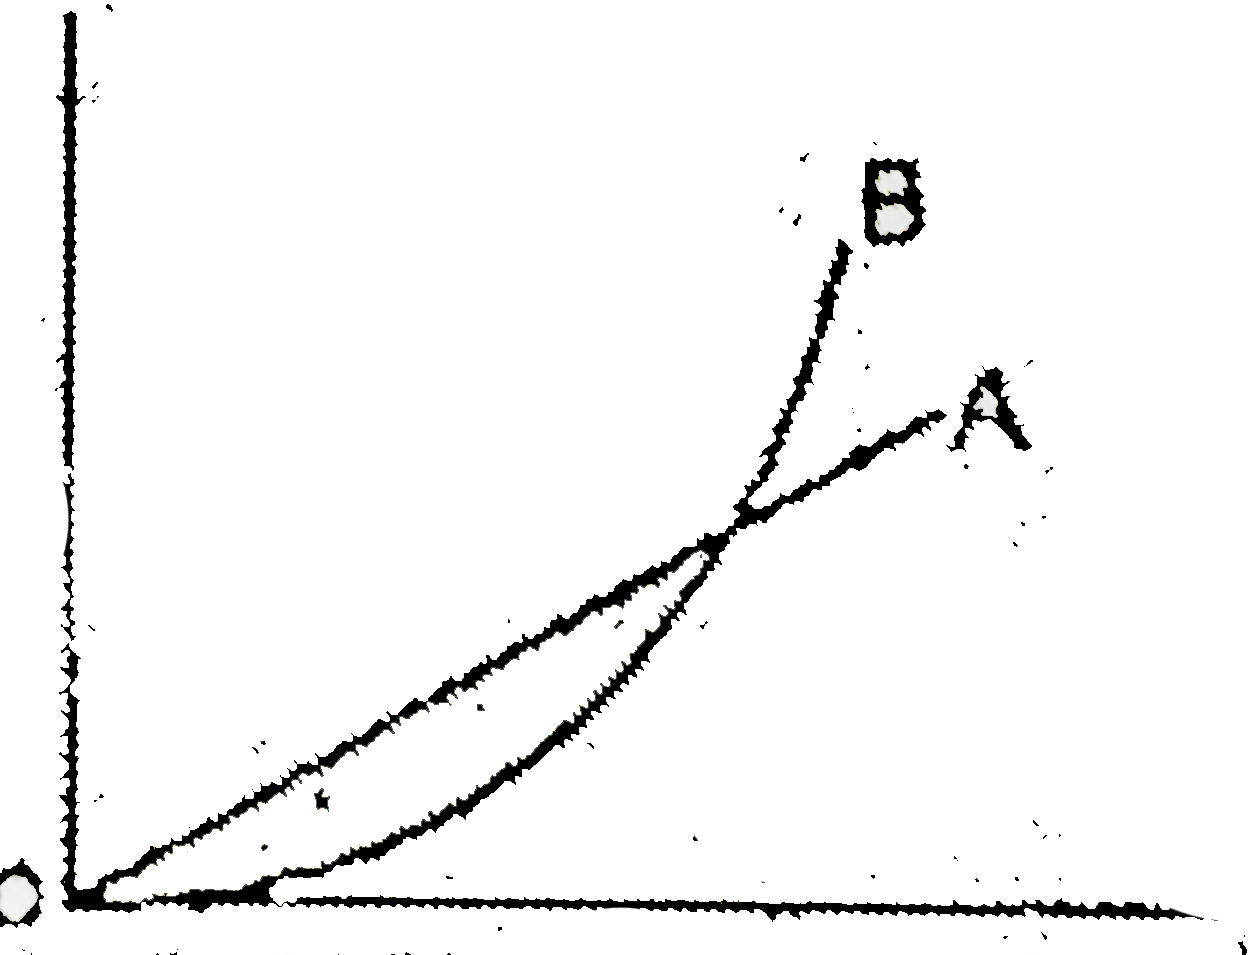 ACurve B indicates velocity against timeBCurve B indicates velocity against accelerationCCurve A indicates acceleration against timeDNone of these
 - Question 2 - Select One or More
A particle is resting over a smooth horizontal floor. At t=0, a horizontal force starts acting on it. Magnitude of the force increases with the time according to law F=at, where 'a' is a constant. For figure which of the following statement is/are correct ?
 ACurve 1 can be the plot of acceleration against timeBCurve 2 can be the plot of velocity against timeCCurve 2 can be the plot of velocity against accelerationDCurve 1 can be the plot of displacement against time
 - Question 3 - Select One
A block is resting over a smooth horizontal plane. A constant horizontal force starts acting on it at t=0. Which of the following graph is correct:
A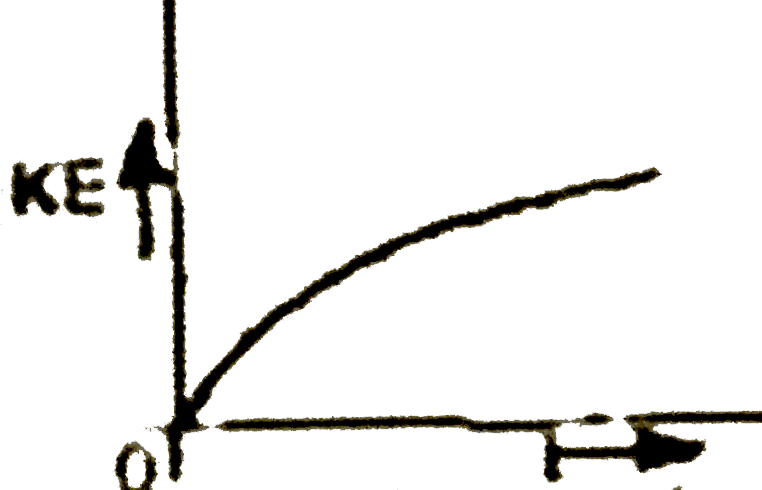 B
B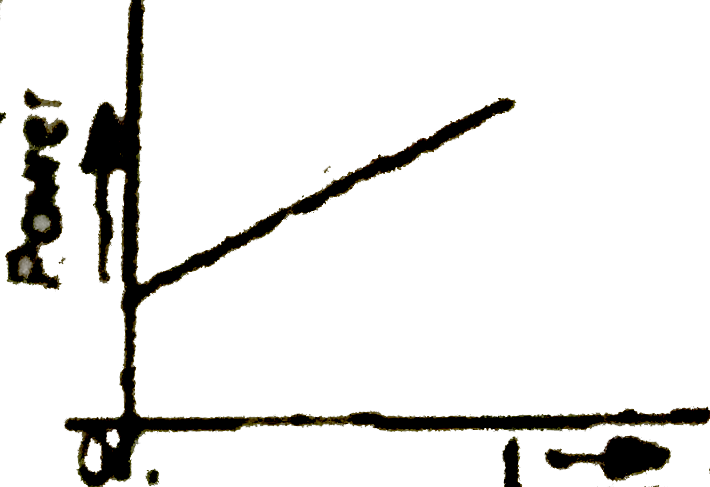 C
C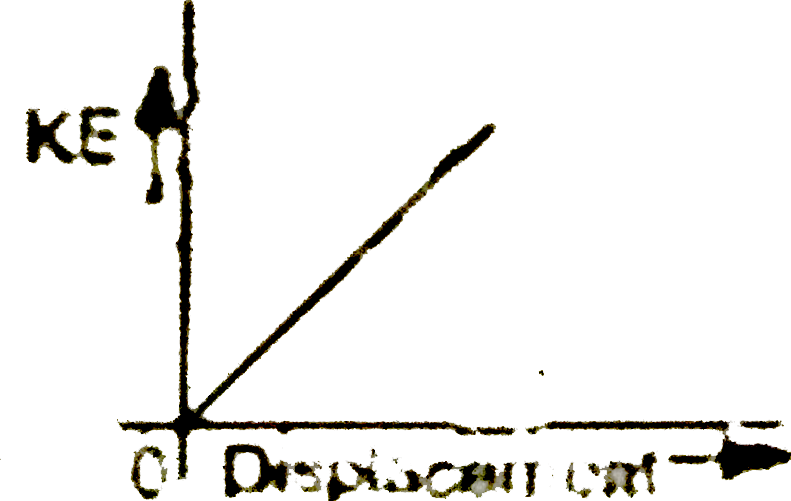 D
D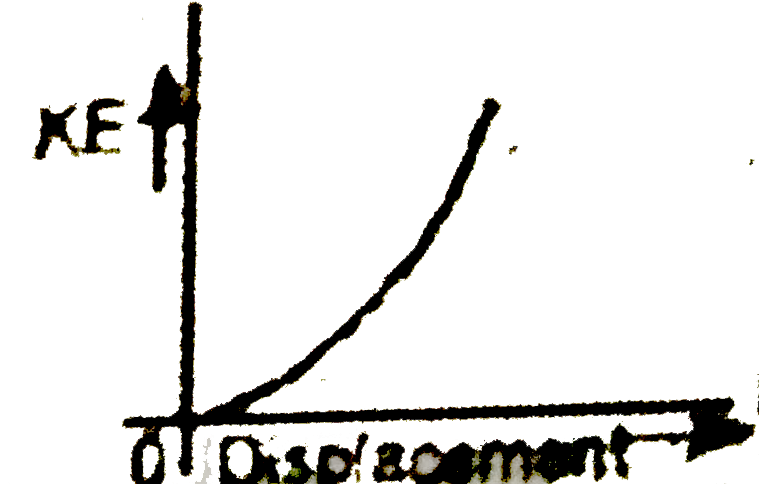
A uniform plank is resting over a smooth horizontal floor and is pulled by applying a horizontal force at its one end. Which of the following statements are not correct?
View SolutionA particle starts from rest and moves with acceleration a which varies with time t as a=kt where k is a costant. The displacement s of the particle at time t is
View SolutionA particle is on a smooth horizontal plane. A force F is applied whose F-t graph is given. Then,
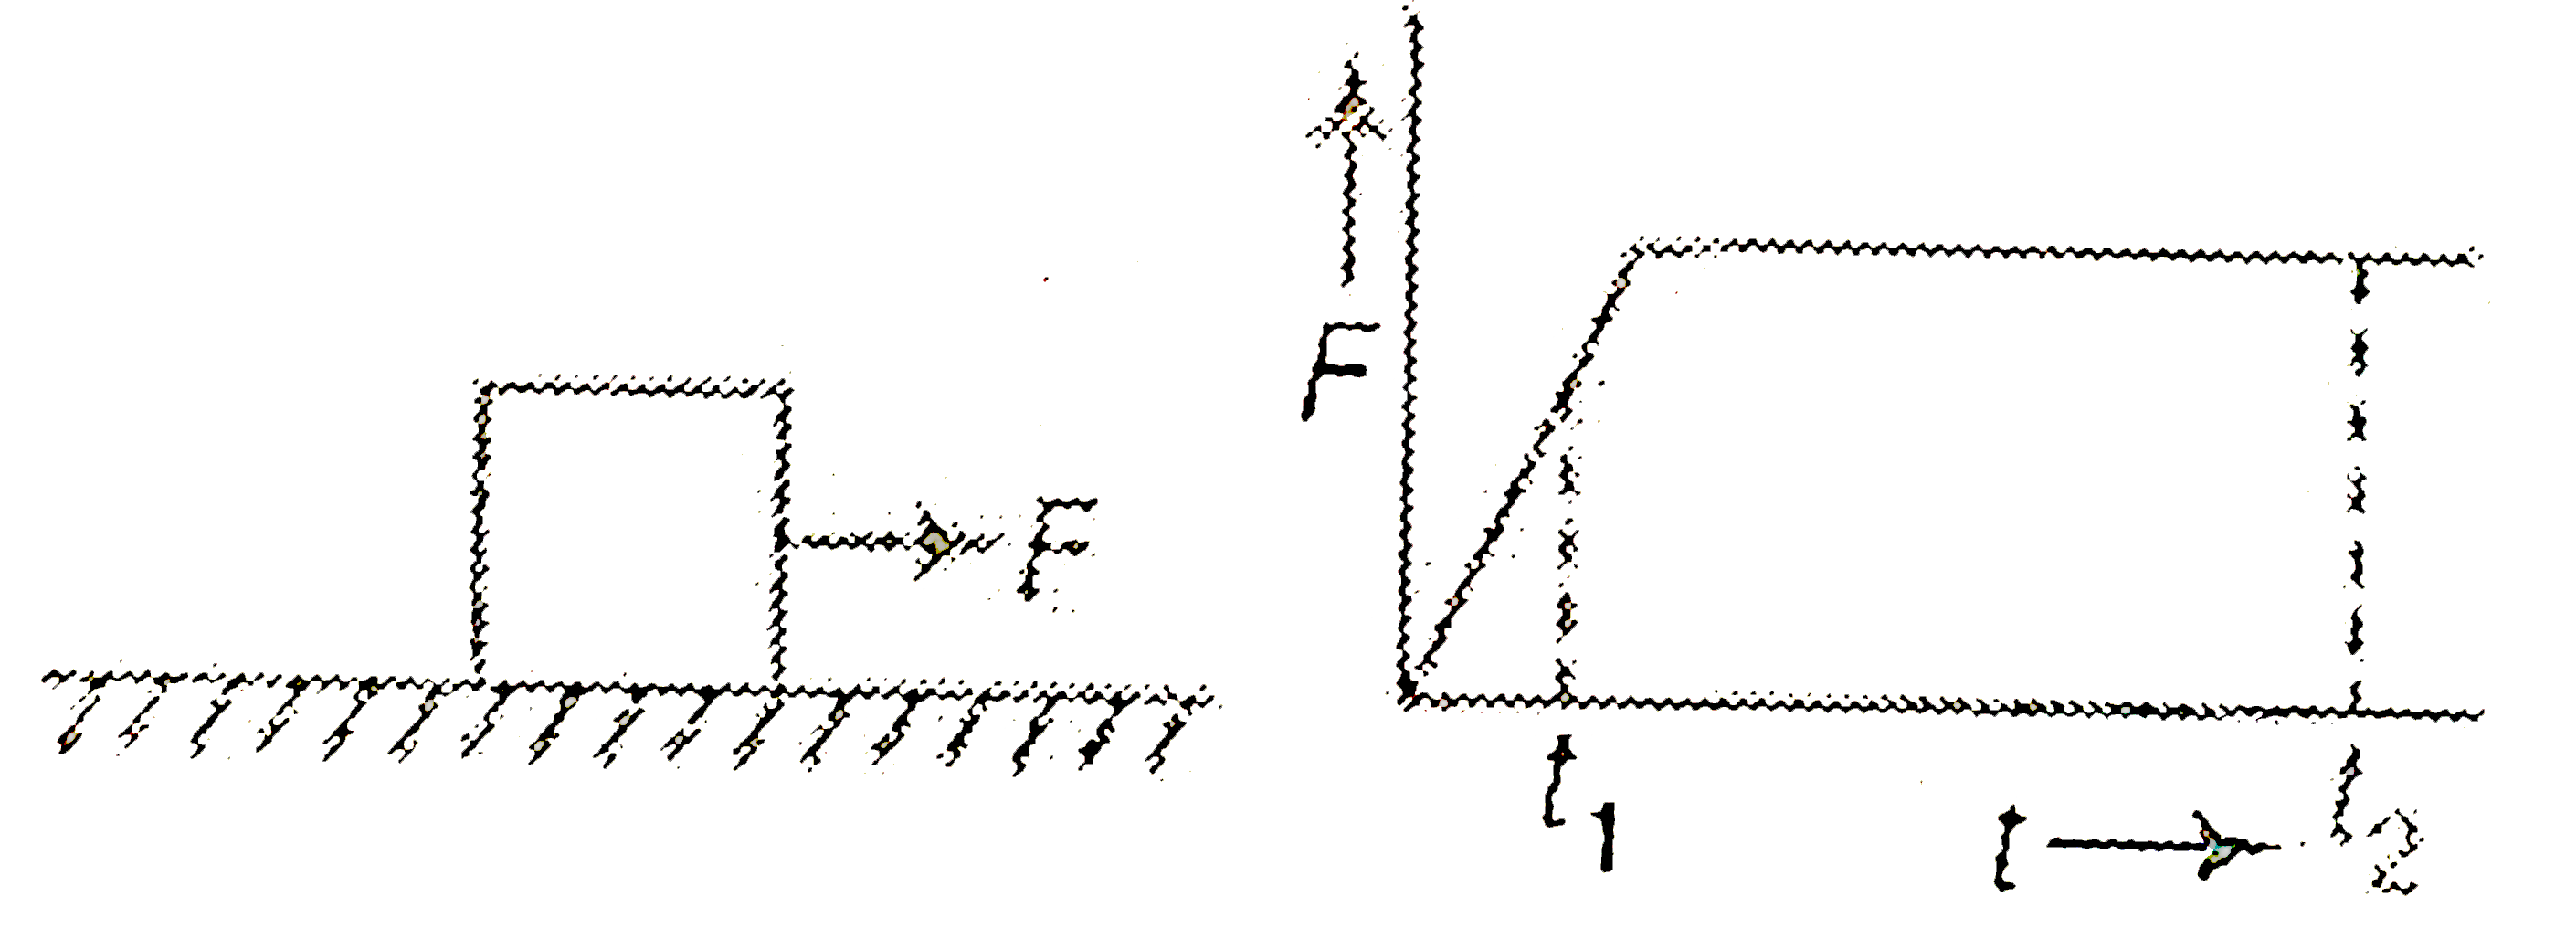 View Solution
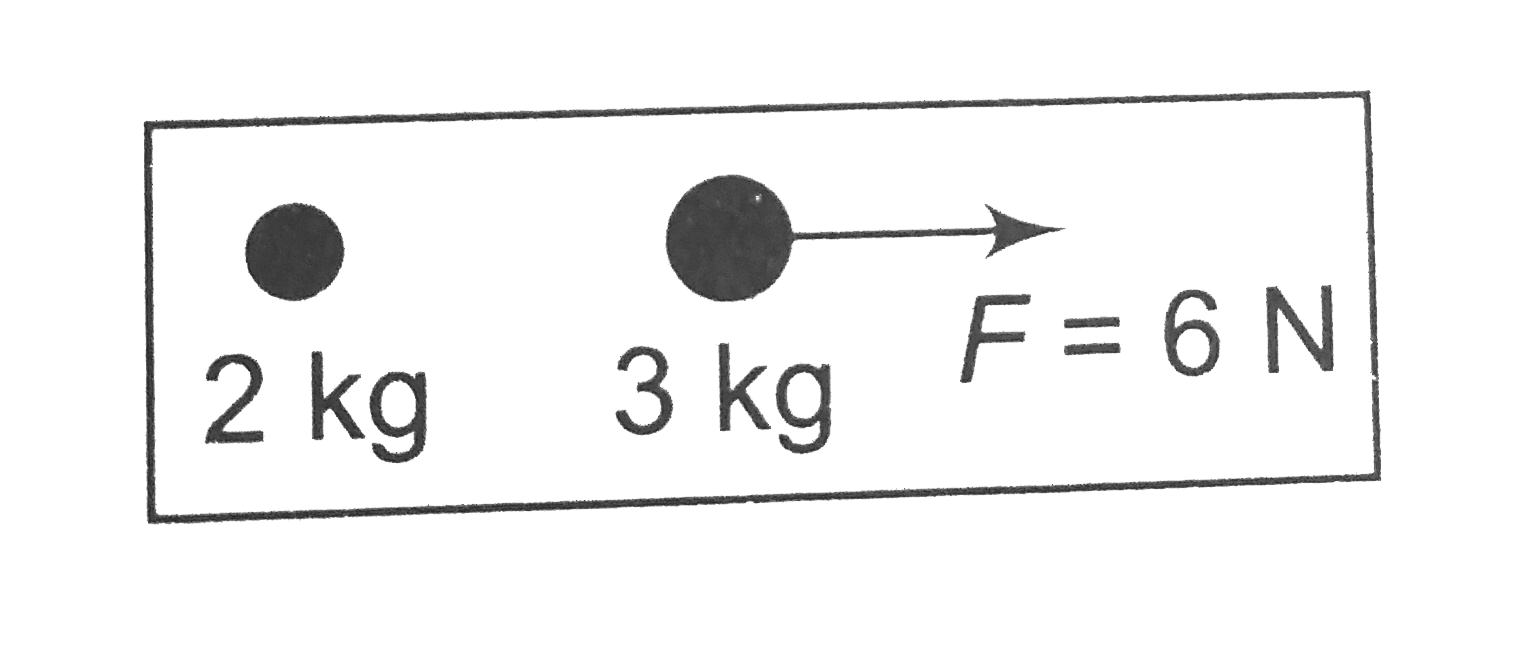
Two particles are shown in figure. At t=0 a constant force F=6N starts acting on 3kg. Find the velocity of circle of mass of these particle at t=5s.
 .View Solution
A particle initially at rest on a smooth horizontal surface, is acted on by a constant horizontal force at time t=0 then if W= work, done t=time and v=speed of the particle, the nearly correct graph (s) is //are
View Solution

