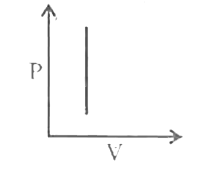
In which process P-V diagramis a stright line parallel to the volume axis ?
Iochoric
Isobaric
Isothermal
Adiabatic
The correct Answer is:B
To determine in which thermodynamic process the P-V diagram is a straight line parallel to the volume axis, we can follow these steps:
1. Understand the Axes:
- The P-V diagram has pressure (P) on the y-axis and volume (V) on the x-axis. A straight line parallel to the volume axis indicates that pressure remains constant while volume changes.
2. Identify the Characteristics of the Process:
- If the line is parallel to the volume axis, it means that as the volume increases or decreases, the pressure does not change. This is a key characteristic of a specific thermodynamic process.
3. Recall Thermodynamic Processes:
- There are four main thermodynamic processes to consider:
- Isobaric Process: Pressure remains constant.
- Isochoric Process: Volume remains constant.
- Isothermal Process: Temperature remains constant.
- Adiabatic Process: No heat exchange occurs.
4. Analyze Each Process:
- Isochoric Process: Volume is constant, so the P-V diagram would be a vertical line, not parallel to the volume axis.
- Isobaric Process: Pressure is constant, so the P-V diagram would be a horizontal line, parallel to the volume axis.
- Isothermal Process: Temperature is constant, leading to a hyperbolic curve on the P-V diagram.
- Adiabatic Process: Similar to isothermal but steeper and also not a straight line.
5. Conclusion:
- The process where the P-V diagram is a straight line parallel to the volume axis is the Isobaric Process.
Final Answer:
The process in which the P-V diagram is a straight line parallel to the volume axis is the Isobaric Process.
- The P-V diagram has pressure (P) on the y-axis and volume (V) on the x-axis. A straight line parallel to the volume axis indicates that pressure remains constant while volume changes.
- If the line is parallel to the volume axis, it means that as the volume increases or decreases, the pressure does not change. This is a key characteristic of a specific thermodynamic process.
- There are four main thermodynamic processes to consider:
- Isobaric Process: Pressure remains constant.
- Isochoric Process: Volume remains constant.
- Isothermal Process: Temperature remains constant.
- Adiabatic Process: No heat exchange occurs.
- Isochoric Process: Volume is constant, so the P-V diagram would be a vertical line, not parallel to the volume axis.
- Isobaric Process: Pressure is constant, so the P-V diagram would be a horizontal line, parallel to the volume axis.
- Isothermal Process: Temperature is constant, leading to a hyperbolic curve on the P-V diagram.
- Adiabatic Process: Similar to isothermal but steeper and also not a straight line.
- The process where the P-V diagram is a straight line parallel to the volume axis is the Isobaric Process.
The process in which the P-V diagram is a straight line parallel to the volume axis is the Isobaric Process.
Topper's Solved these Questions
- THERMODYNAMICSBOOK - AAKASH INSTITUTECHAPTER - THERMODYNAMICSEXERCISE - ASSIGNMENT (SECTION -B) (Objective Type Questions)
23 Videos
- THERMODYNAMICSBOOK - AAKASH INSTITUTECHAPTER - THERMODYNAMICSEXERCISE - ASSIGNMENT (SECTION -C) (Previous Year Questions)
54 Videos
- THERMODYNAMICSBOOK - AAKASH INSTITUTECHAPTER - THERMODYNAMICSEXERCISE - EXERCISE
19 Videos
- THERMAL PROPERTIES OF MATTERBOOK - AAKASH INSTITUTECHAPTER - THERMAL PROPERTIES OF MATTEREXERCISE - Assignment (Section-J) Akash Challengers Questions
7 Videos
- UNITS AND MEASUREMENTSBOOK - AAKASH INSTITUTECHAPTER - UNITS AND MEASUREMENTSEXERCISE - ASSIGNMENT (SECTION - D)
15 Videos
Similar Questions
Knowledge Check
Assertion In isochoric process p-V graph is straight line parallel to p-axis.
Reason In isochoric process density p remains constant.AIf both Assertion and Reason are correct and Reason is the correct explanation of Assertion.BIf both Assertion and Reason are correct but Reason is not the correct explation os Assertion.CIf Assertionis true bur Reason is false.DIf Assertion is false but Reason is true.Select the correct graphs
A) the P−1/V graph at constant temperature is a rectangular hyperbola.
B) the PV−V graph is a straight line parallel to the Y− axis.
C) V−T graph at constant pressure is a straight line passing through the origin.AABBCCDA,B,CSlope of line parallel to Y axis -
AX=d,BX=0,CY=dDY-0
Equation of line parallel to x and y axis
View SolutionWhat is the equation of a line parallel to y axis?
View SolutionA cyclic process ABCA shown in the V-T diagram is performed with a constant mass of an ideal gas. Show the same process on a p-V diagram, In the figure, CA is parrallel to the B-sxis and BC is parallel to the T-axis.<br><imga≤ocr_imageload∈g=lazysrc=https://d10lpgp6xz60nq.cloudfront.net/physics_imagesHCV_VOL2_C24_S01_010_Q01.pngwh=80%mx-autosty≤=background:white;>
View SolutionP - V diagram of a diatomic gas is a straight line parallel to P-axis. The molar heat capacity of the gas in the process will be
View SolutionIn isobaric process, (V - T) graph is a straight line passing through origin. Slope of this line is directly proportional to mass of the gas. (V) is taken on (y - axis).
V=(nRp)T
∴ Slope∝n
or slope∝m.
View Solution

