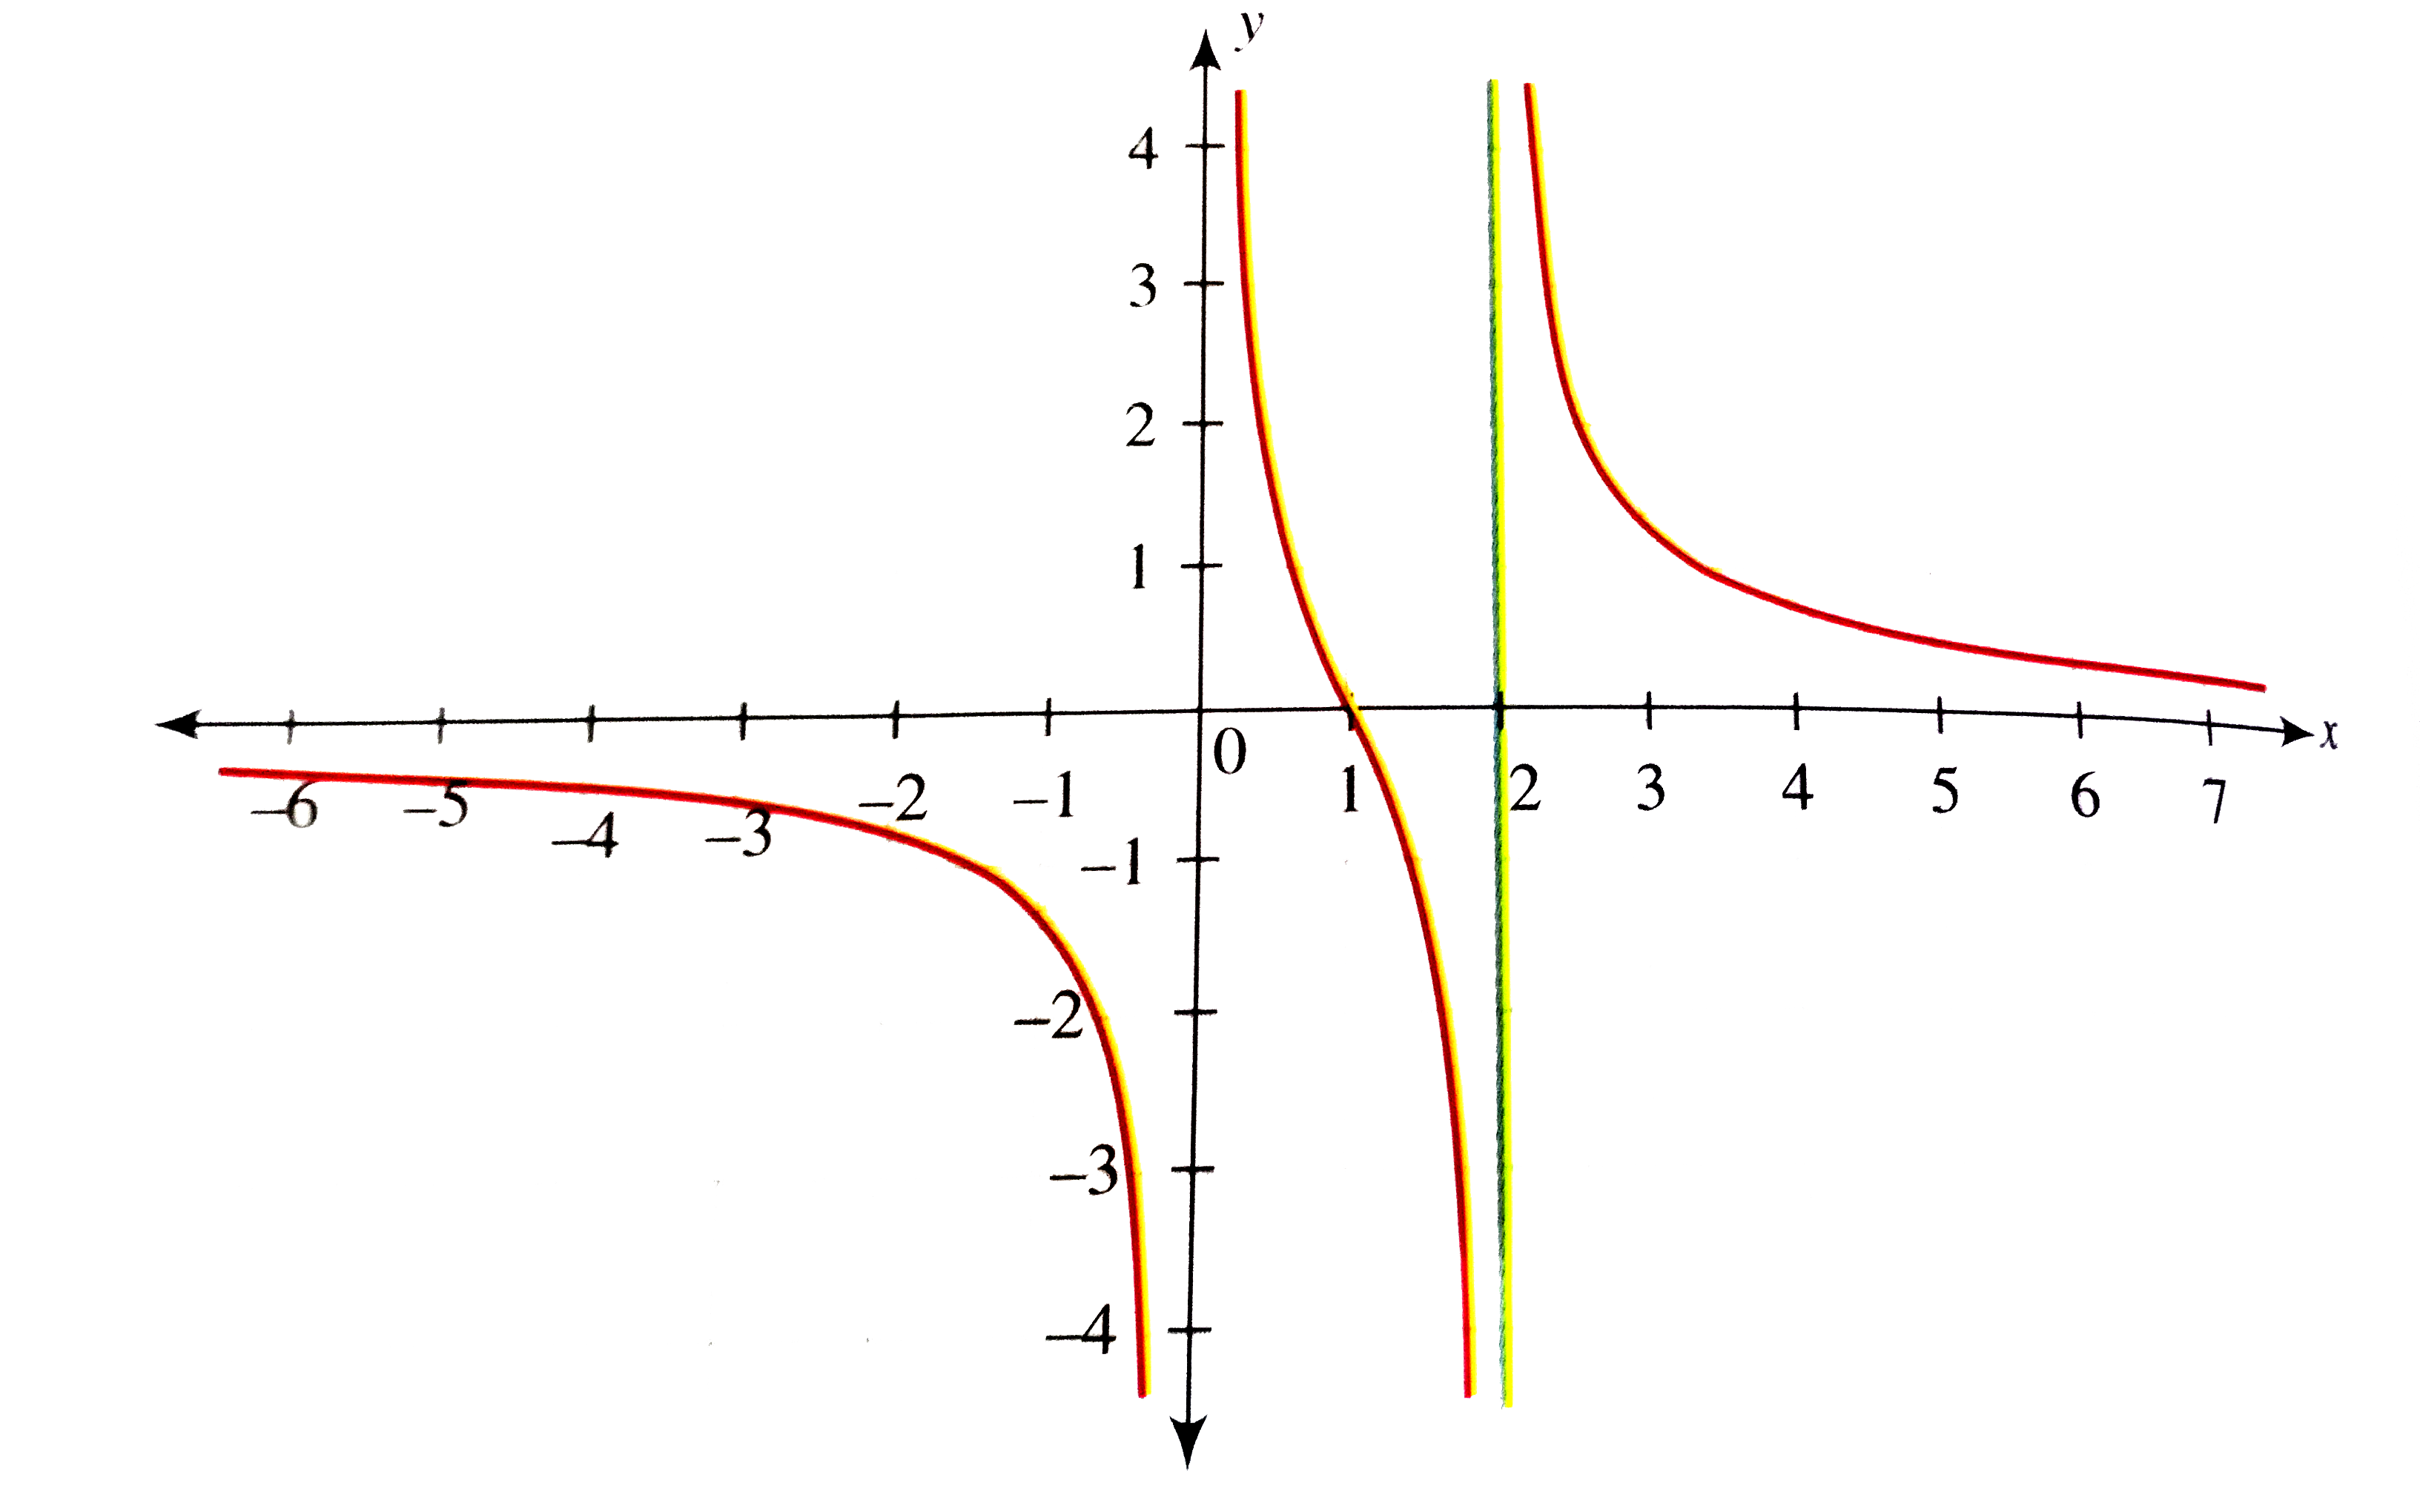
Draw the graph of .
Video Solution
Text Solution
We have
Clearly, vertical asymptotes are x = 0 , x = 2.
Also , so the function decreases.
For
and
Thus, f(x) decreases from '0' to in
For
and
Thus, f(x) decreases from to '0' in ().
Hence the graph of the function can be drawn as shown in the following figure.

|
Updated on:21/07/2023
Topper's Solved these Questions
- BOOK - CENGAGECHAPTER - GRAPHS OF POLYNOMIAL AND RATIONAL FUNCTIONSEXERCISE - Exercise13videos
GRAPHS OF POLYNOMIAL AND RATIONAL FUNCTIONS
- BOOK - CENGAGECHAPTER - GRAPHICAL TRANSFORMATIONSEXERCISE - Exercise22videos
GRAPHICAL TRANSFORMATIONS
- BOOK - CENGAGECHAPTER - GRAPHS OF ELEMENTARY FUNCTIONS EXERCISE - Exercise34videos
GRAPHS OF ELEMENTARY FUNCTIONS
Similar Questions
Draw the graph of y=x+1x
View SolutionDraw the graph of y=1x2.
View SolutionDraw the graph of 1x+1y=1.
View SolutionDraw the graph of y=1(1/x).
View SolutionDraw the graph of y=x−1x−2.
View SolutionDraw the graph of y=√xx−1
View SolutionDraw the graph of y=x2+1
View SolutionDraw the graph of y=sin−1,1x
View SolutionDraw the graph of y=(x−1)(6x−1)2x−1.
View SolutionDraw the graph of y=∣∣∣1|x|−2∣∣∣.
View Solution

