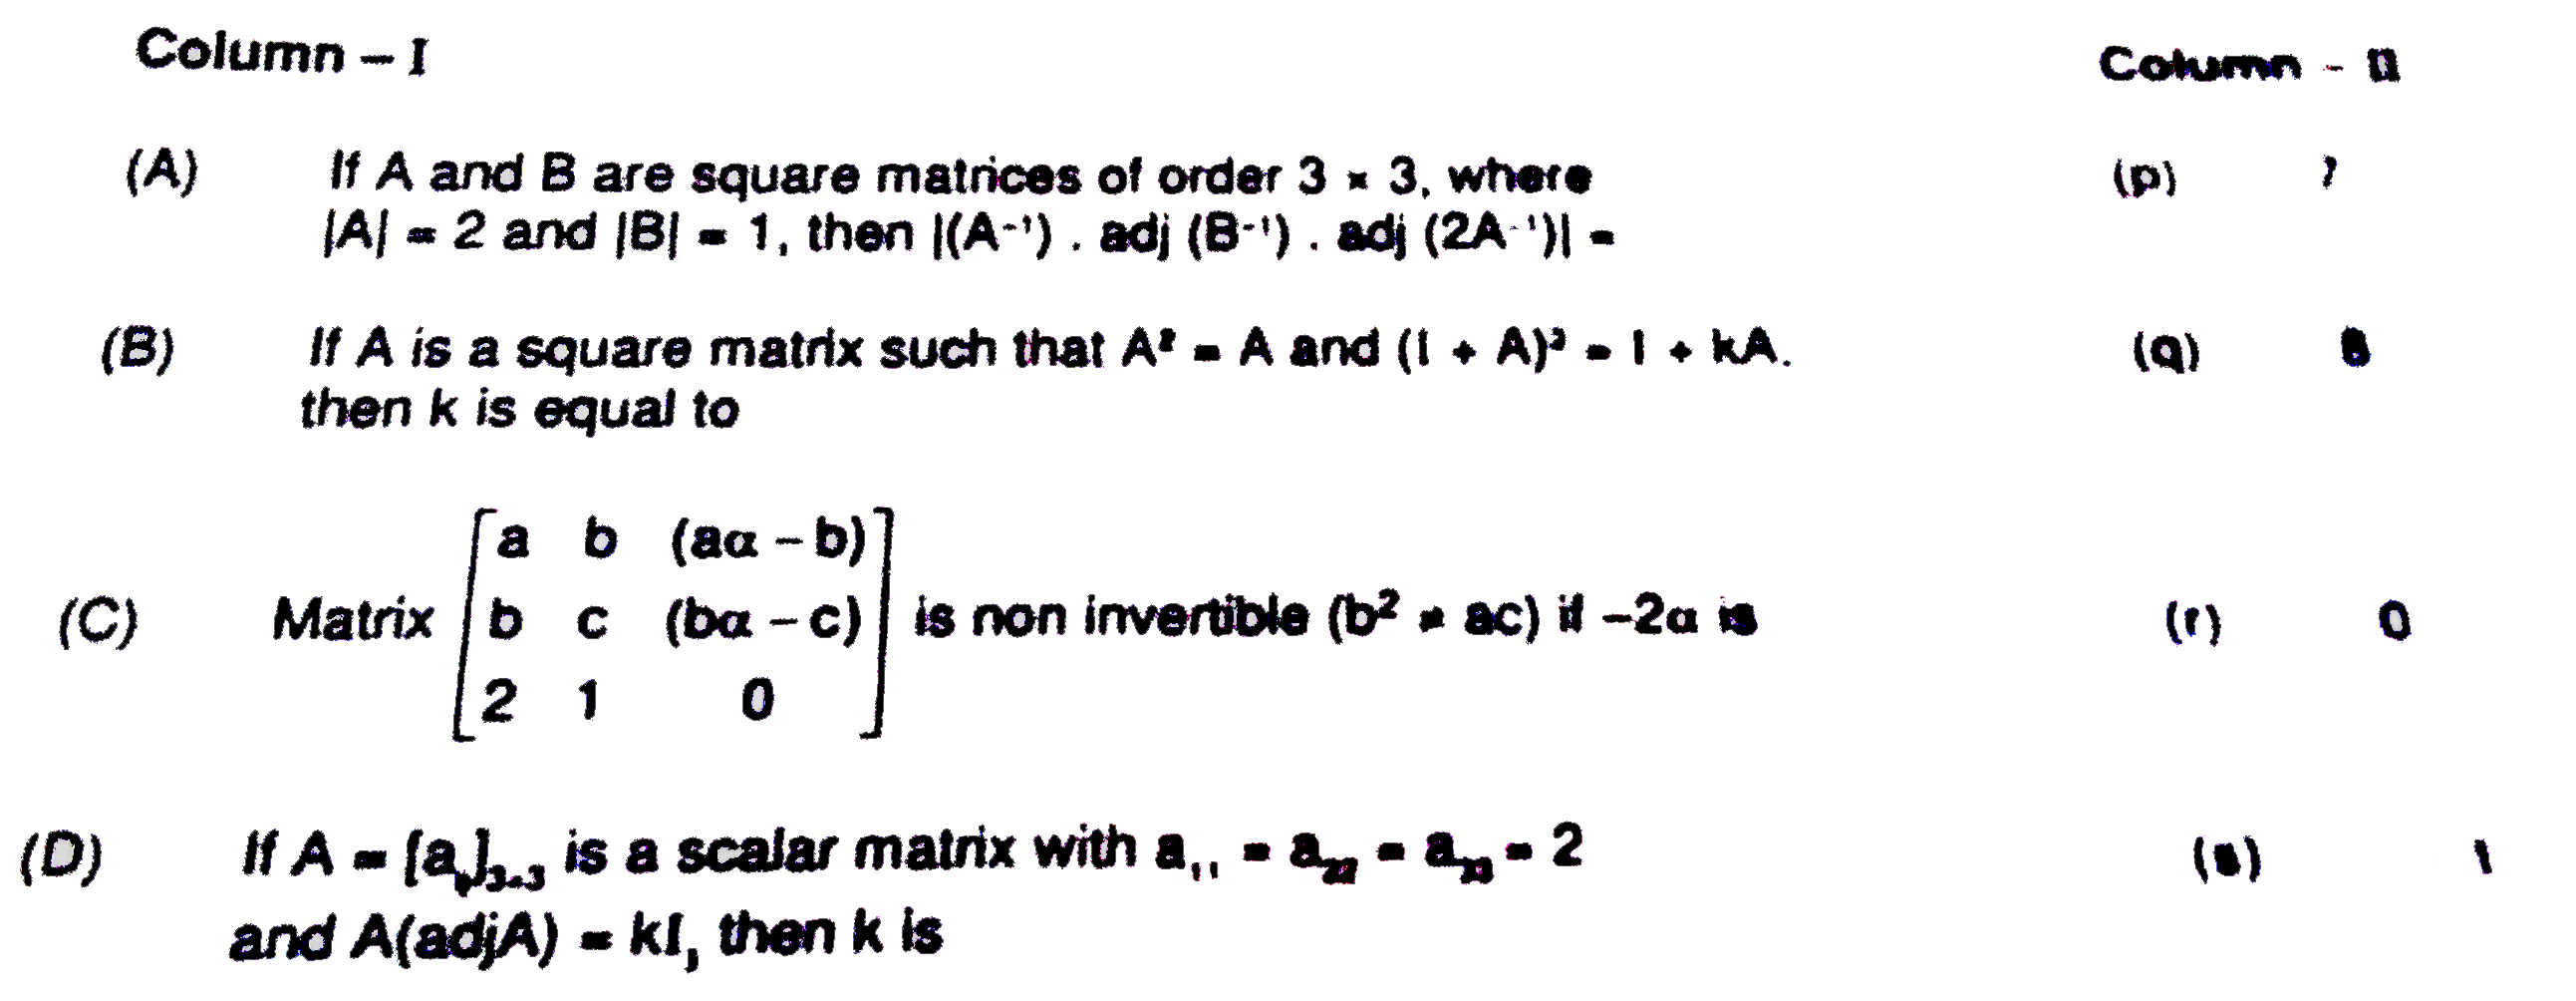
The correct Answer is:A, B, C, D
Topper's Solved these Questions
- MATRICES & DETERMINANTBook:RESONANCEChapter:MATRICES & DETERMINANTExercise:EXERCISE-2
Explore 20 Videos
- MATRICES & DETERMINANTBook:RESONANCEChapter:MATRICES & DETERMINANTExercise:PART-IV
Explore 6 Videos
- MATRICES & DETERMINANTBook:RESONANCEChapter:MATRICES & DETERMINANTExercise:PART-II
Explore 27 Videos
- INDEFINITE INTEGRATION Book:RESONANCEChapter:INDEFINITE INTEGRATION Exercise:SELF PRACTIC PROBLEMS
Explore 25 Videos
- NUMBER THEORYBook:RESONANCEChapter:NUMBER THEORYExercise:Exercise -2 (PART - II)
Explore 4 Videos
Similar Questions
Flind the product of two matrices
A=[cos2θcosθsinθcosθsinθsin2θ]B=[cos2ϕcosϕsinϕcosϕsinϕsin2ϕ]
Show that, AB is the zero matrix if θandϕ differ by an
odd multipl of π2.
View SolutionLet zt be the set of all 3×3 summetric matrices whose entries are 1,1,1,0,0,0,−1,−1,.B is one of the matrix in set zt and
X=⎡⎢⎣xyz⎤⎥⎦U=⎡⎢⎣000⎤⎥⎦V=⎡⎢⎣100⎤⎥⎦ ltBRgt Number of matrices B in set is λ,thenλ lies in the interval
View Solution[x2+x−132]+[0−1−x+1x]=[0−251] then x is equalto-
View SolutionEvaluate : ∫(tan2x)dx
Evalauate: ∫11+sinxdx
View SolutionDetermine with proof all triples (a, b, c) of positive integers satisfying 1a+2b+3c=1 where a is a prime number and a≤b≤c
View SolutionIdentify the cell organelle 'A' :-
ltimg src="https://d10lpgp6xz60nq.cloudfront.net/physics_images/ALN_BIO_C10_E08_018_Q01.png" width="80%"gt
View SolutionHow many lines of symmetry does the above figure have ?
View SolutionWhich of the following are correct chain isomers of butane ? (i)
View SolutionDetermine the point of symmetry of a regular hexagon.
View SolutionDtermine the images of the following figure about the given line :
View SolutionMatch the following Column A to Column B

View SolutionMatch the following Column A to Column B

View SolutionMatch the following Column A to Column B

View SolutionFind the area of the figure given below.

View SolutionThe area of the shaded part in the figure given below is ______.

View SolutionThe inequation represented by the graph given below is :
View Solution

