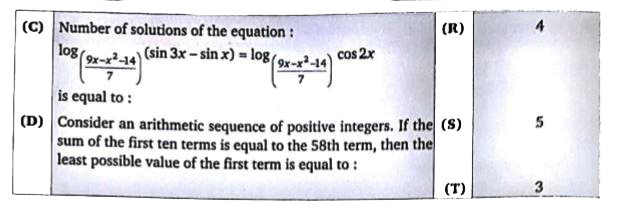
The correct Answer is:A→S;B→Q;C→P;D→R
Topper's Solved these Questions
- TRIGONOMETRIC EQUATIONS BOOK - VK JAISWALCHAPTER - TRIGONOMETRIC EQUATIONS EXERCISE - Exercise-5 : Subjective Type Problems
9 Videos
- TRIGONOMETRIC EQUATIONS BOOK - VK JAISWALCHAPTER - TRIGONOMETRIC EQUATIONS EXERCISE - Exercise-3 : Comprehension Type Problems
3 Videos
- STRAIGHT LINES BOOK - VK JAISWALCHAPTER - STRAIGHT LINES EXERCISE - Exercise-5 : Subjective Type Problems
10 Videos
- VECTOR & 3DIMENSIONAL GEOMETRYBOOK - VK JAISWALCHAPTER - VECTOR & 3DIMENSIONAL GEOMETRYEXERCISE - Exercise-5 : Subjective Type Problems
16 Videos
Similar Questions
Find the number of solutions of the equations
(sinx−1)3+(cosx−1)3+(sinx)3=(2sinx+cosx−2)3 in [0,2π].
View SolutionConsider f, g and h be three real valued function defined on R. Let f(x)=sin3x+cosx,g(x)=cos3x+sinx and h(x)=f2(x)+g2(x). Then,
The length of a longest interval in which the function g=h(x) is increasing, is
View SolutionIf the area of the quadrilateral ABCD whose vertices are A(1, 1), B(7, -3), C(12, 2) and D(7, 21) is Δ. Find the sum of the digits of Δ.
View SolutionA straight line L intersects perpendicularly both the lines :
x+22=y+63=z−34−10andx+64=y−7−3=z−7−2,
then the square of perpendicular distance of origin from L is
View SolutionHow many lines of symmetry does the above figure have ?
View SolutionWhich of the following are correct chain isomers of butane ? (i)
View SolutionDetermine the point of symmetry of a regular hexagon.
View SolutionDtermine the images of the following figure about the given line :
View SolutionMatch the following Column A to Column B

View SolutionMatch the following Column A to Column B

View SolutionMatch the following Column A to Column B

View SolutionFind the area of the figure given below.

View SolutionThe area of the shaded part in the figure given below is ______.

View SolutionThe inequation represented by the graph given below is :
View SolutionThe inequation that best describes the graph given below is _________
View SolutionThe inequation that best describes the following graph is _________
View Solution


