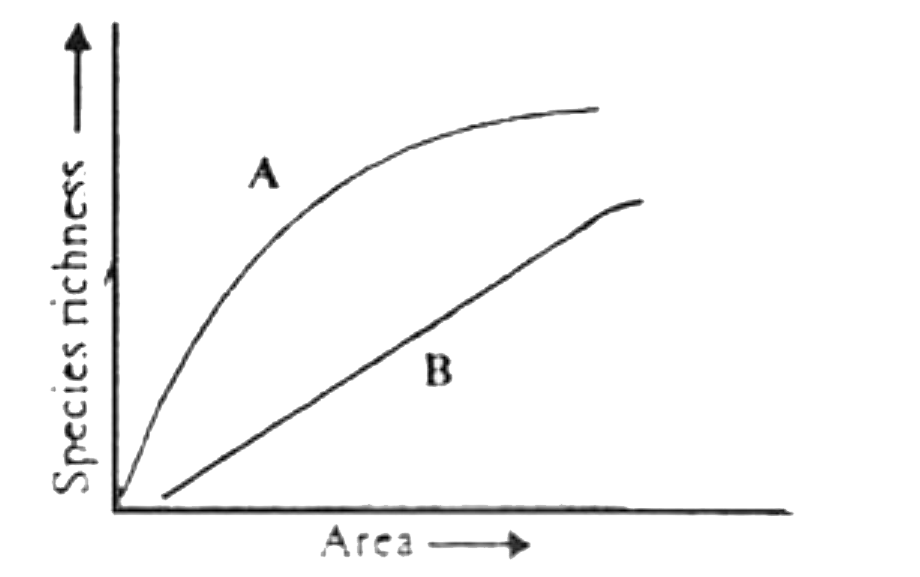
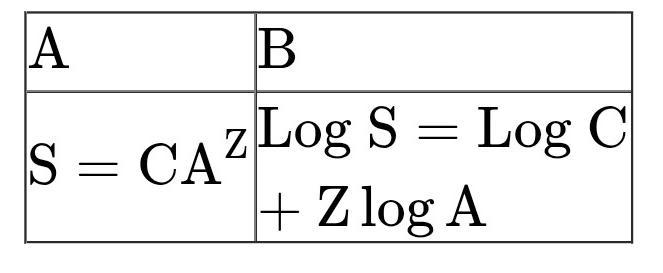
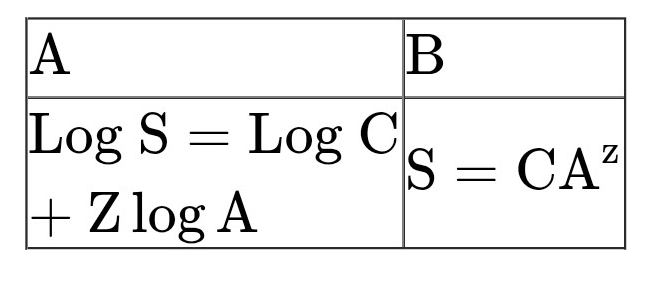
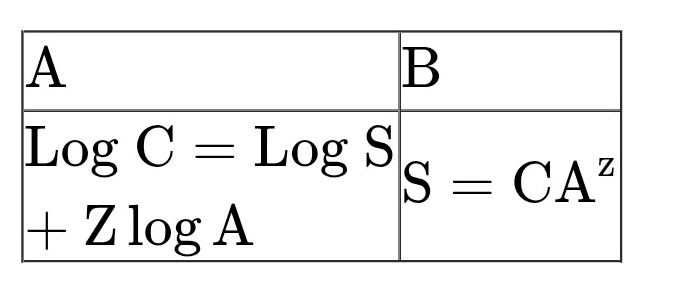
Which option correctly describes the equation for curves A and B, in the given graph of species - area relationship ?
A
B
C
D
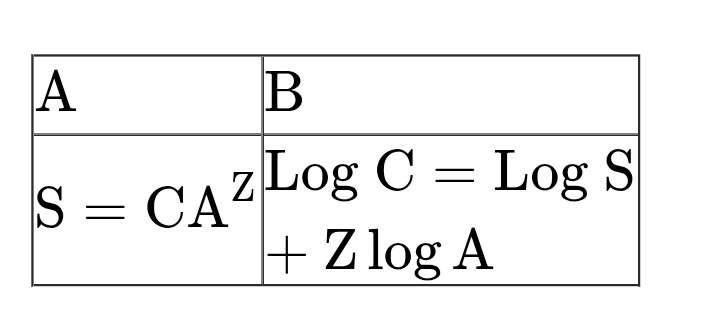
Video Solution
Text Solution
The correct Answer is:A
|
Answer
Step by step video, text & image solution for Which option correctly describes the equation for curves A and B, in the given graph of species - area relationship ? by Biology experts to help you in doubts & scoring excellent marks in Class 12 exams.
Updated on:21/07/2023Topper's Solved these Questions
Similar Questions
Knowledge Check
Which option correctly describes a tuning fork ?
AMetllic with two handles and one prongBMetallic with one handle and two prongsCWooden with two handles and one prongDWooden with one handle and two prongsWhich option correctly describes cochlea in human beings ?
AHammer shaped boneBTiny hair projectionsCThin muscular flapDLong coiled tubeAccording to the concept of species-area relationship.
AThe number of species in an area increase with the size of the area.BThe value of Z lies in the range of 0.3 to 0.4, regardless of the taxonomic group or the region.CThe relationship is for a rectangular hyperbola curve is described by the equation logS=logC+ZlogA.DThe larger the area the greater the extinction rate.
Which option correctly describes an oscillatory motion ?
View SolutionSpecies-Area relationship was given by
View SolutionSpecies area relationship was given by :-
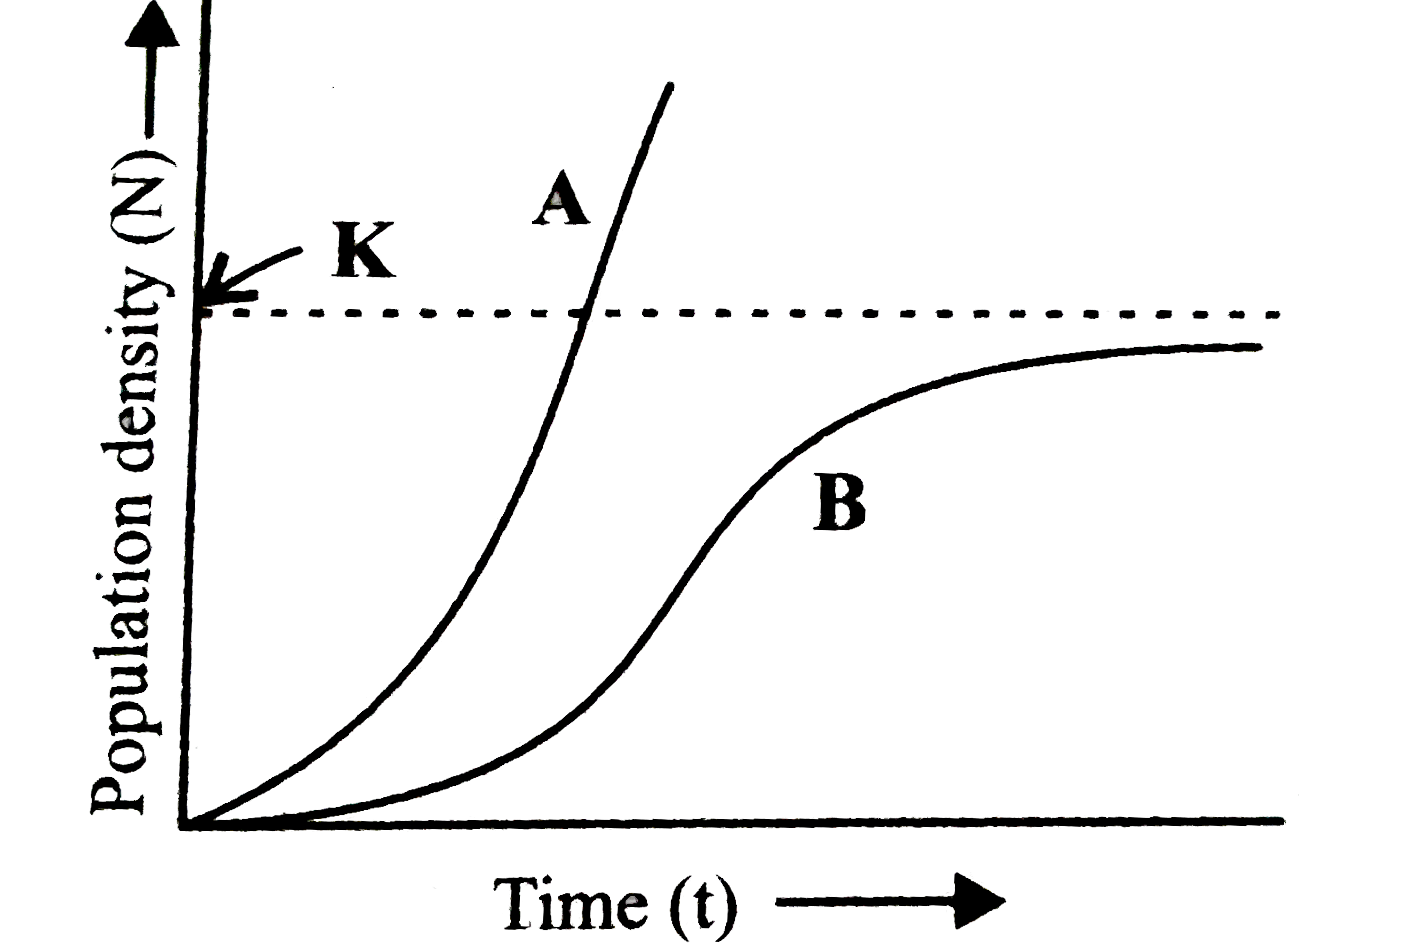
View SolutionStudy the population growth curves (A and B) in the given graph and select the incorrect option.
View SolutionSelect the option which correctly describes the function of given hormones.
View Solution

