Which of the following graph corresponds to a population of 2000 individuals, with 800 births and 1200 deaths over a given period of time?
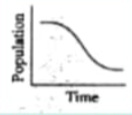
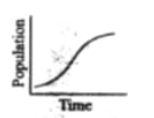
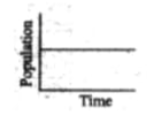
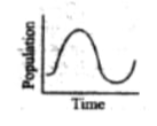
The correct Answer is:A
Step by step video, text & image solution for Which of the following graph corresponds to a population of 2000 individuals, with 800 births and 1200 deaths over a given period of time? by Biology experts to help you in doubts & scoring excellent marks in Class 12 exams.
Updated on:21/07/2023Topper's Solved these Questions
Similar Questions
Knowledge Check
Which of the following graphs correspond to one node ?
A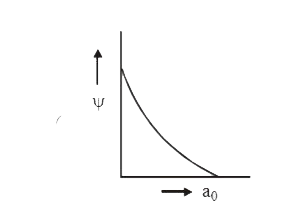 B
B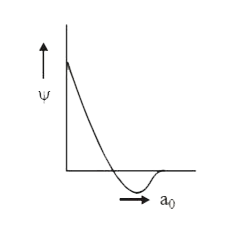 C
C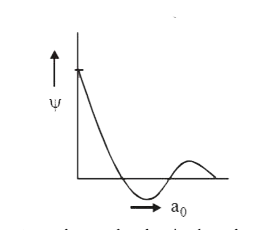 D
D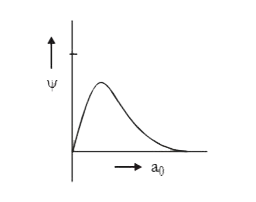
In a given population of 2000 indivials, 80 births and 125 deaths were reported over a given period of time. Which of the following graphs will correspond to it ?
A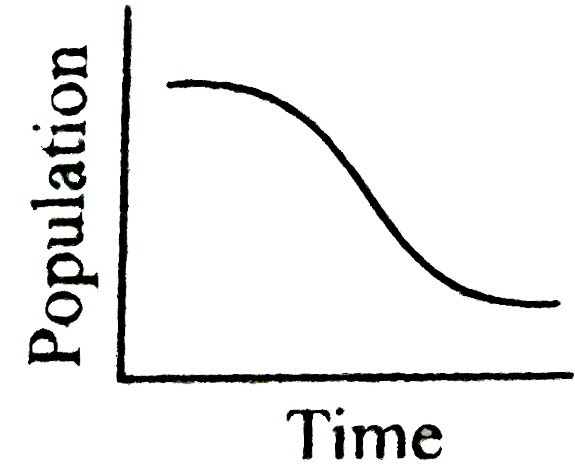 B
B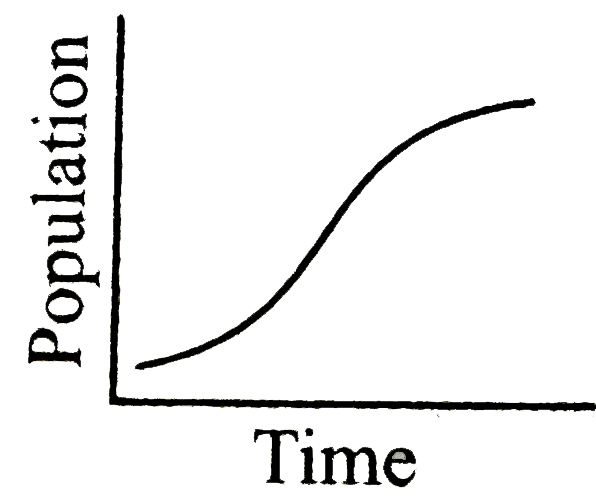 C
C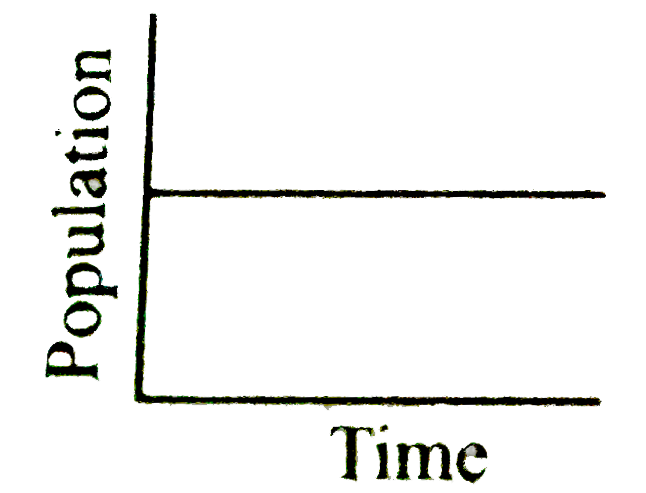 D
D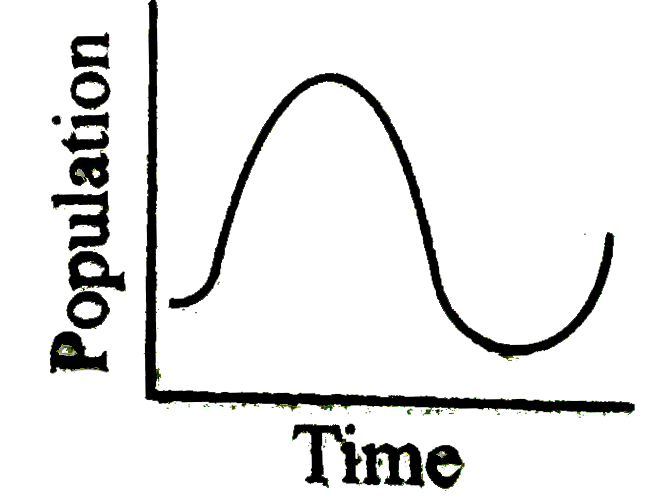
Which of the following is correct
i. In a population birth rate and death rate refer to per capita births and death respectively
II. In nuature, we rerely find isolated single individuals of species
III. The size of population for any species is stable
IV. Ecological effects of any factors on a population growth are generally reflected in its size / population densityAI and IIBII and IIICI,II and IIIDI,II and IV
Which one of the following hypotheses postulates that individual's consumption in any time period depends upon resources available to the individual, rate of return on his capital and age of the individual?
View SolutionWhich of the following statements are correct?
I. Mortality is the rate of loss of individuals per unit time due to death.
II. Population dispersion affects the size of population.
III. Age distribution influences both natality and mortality of the population.
IV. Realised natality is the actual death rate found under existing conditions.
View SolutionWhich one of the following continents has the lowest birth and death rates ?
View SolutionWhich of the following is correct ?
I. Migration is the movement of individuals from a population to another population
II. Emigration is the migration of individuals out of an area
III. Immigration is the migration of individuals into an area
IV Gene flow cannot alter the genetic charecteristics of populations
View SolutionIn which of the following the birth rate is high and death rate is normal ?
View Solution
