Which of the following graph is correct?
All of these
The correct Answer is:D
To solve the question regarding which graph is correct, we will analyze the behavior of molar conductivity (λm) with respect to concentration (c) for both strong and weak electrolytes, and also discuss the relationship between mass deposited (W) and charge (Q) according to Faraday's laws.
1. Understanding Molar Conductivity (λm):
- Molar conductivity (λm) is defined as the conductivity (κ) of an electrolyte solution multiplied by 1000 and divided by the molarity (c) of the solution.
- The formula is given by:
λm=κ×1000c
2. Behavior of Strong Electrolytes:
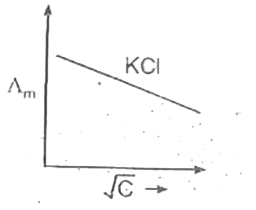
- For strong electrolytes (like KCl), the molar conductivity increases linearly with the square root of dilution (i.e., as concentration decreases).
- According to Onsager's equation, the relationship can be expressed as:
λm=λ0m−a√c
- Here, λm^0 is the limiting molar conductivity, a is a constant, and c is the concentration. The graph of λm vs. √c will be a straight line with a negative slope.
3. Behavior of Weak Electrolytes:
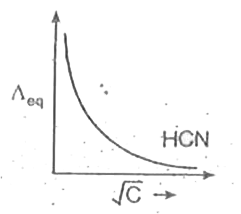
- For weak electrolytes (like HCN), the molar conductivity increases more sharply as the solution is diluted.
- The degree of dissociation (α) for weak electrolytes increases with dilution, which leads to a more significant increase in molar conductivity compared to strong electrolytes.
- The graph of λm vs. √c for weak electrolytes will show a nonlinear increase, reflecting the increased degree of dissociation.
4. Graph of Mass Deposited (W) vs. Charge (Q):
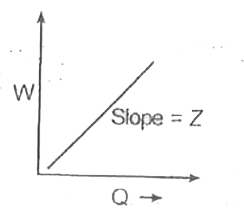
- According to Faraday's law, the mass (W) of a substance deposited at an electrode is directly proportional to the charge (Q) passed through the electrolyte.
- The relationship can be expressed as:
W=Z⋅Q
- Here, Z is the electrochemical equivalent. The graph of W vs. Q will be a straight line passing through the origin, indicating a linear relationship.
5. Conclusion:
- The correct graphs are:
- A straight line for strong electrolytes (λm vs. √c).
- A nonlinear curve for weak electrolytes (λm vs. √c).
- A straight line for mass deposited (W) vs. charge (Q).
- Molar conductivity (λm) is defined as the conductivity (κ) of an electrolyte solution multiplied by 1000 and divided by the molarity (c) of the solution.
- The formula is given by:
λm=κ×1000c
- For strong electrolytes (like KCl), the molar conductivity increases linearly with the square root of dilution (i.e., as concentration decreases).
- According to Onsager's equation, the relationship can be expressed as:
λm=λ0m−a√c
- Here, λm^0 is the limiting molar conductivity, a is a constant, and c is the concentration. The graph of λm vs. √c will be a straight line with a negative slope.
- For weak electrolytes (like HCN), the molar conductivity increases more sharply as the solution is diluted.
- The degree of dissociation (α) for weak electrolytes increases with dilution, which leads to a more significant increase in molar conductivity compared to strong electrolytes.
- The graph of λm vs. √c for weak electrolytes will show a nonlinear increase, reflecting the increased degree of dissociation.
- According to Faraday's law, the mass (W) of a substance deposited at an electrode is directly proportional to the charge (Q) passed through the electrolyte.
- The relationship can be expressed as:
W=Z⋅Q
- Here, Z is the electrochemical equivalent. The graph of W vs. Q will be a straight line passing through the origin, indicating a linear relationship.
- The correct graphs are:
- A straight line for strong electrolytes (λm vs. √c).
- A nonlinear curve for weak electrolytes (λm vs. √c).
- A straight line for mass deposited (W) vs. charge (Q).
Similar Questions
Knowledge Check
Which of the following graphs is correct for a zero order of reaction?
A B
B C
C D
D
Which of the following graph is correct for a first order reaction ?
A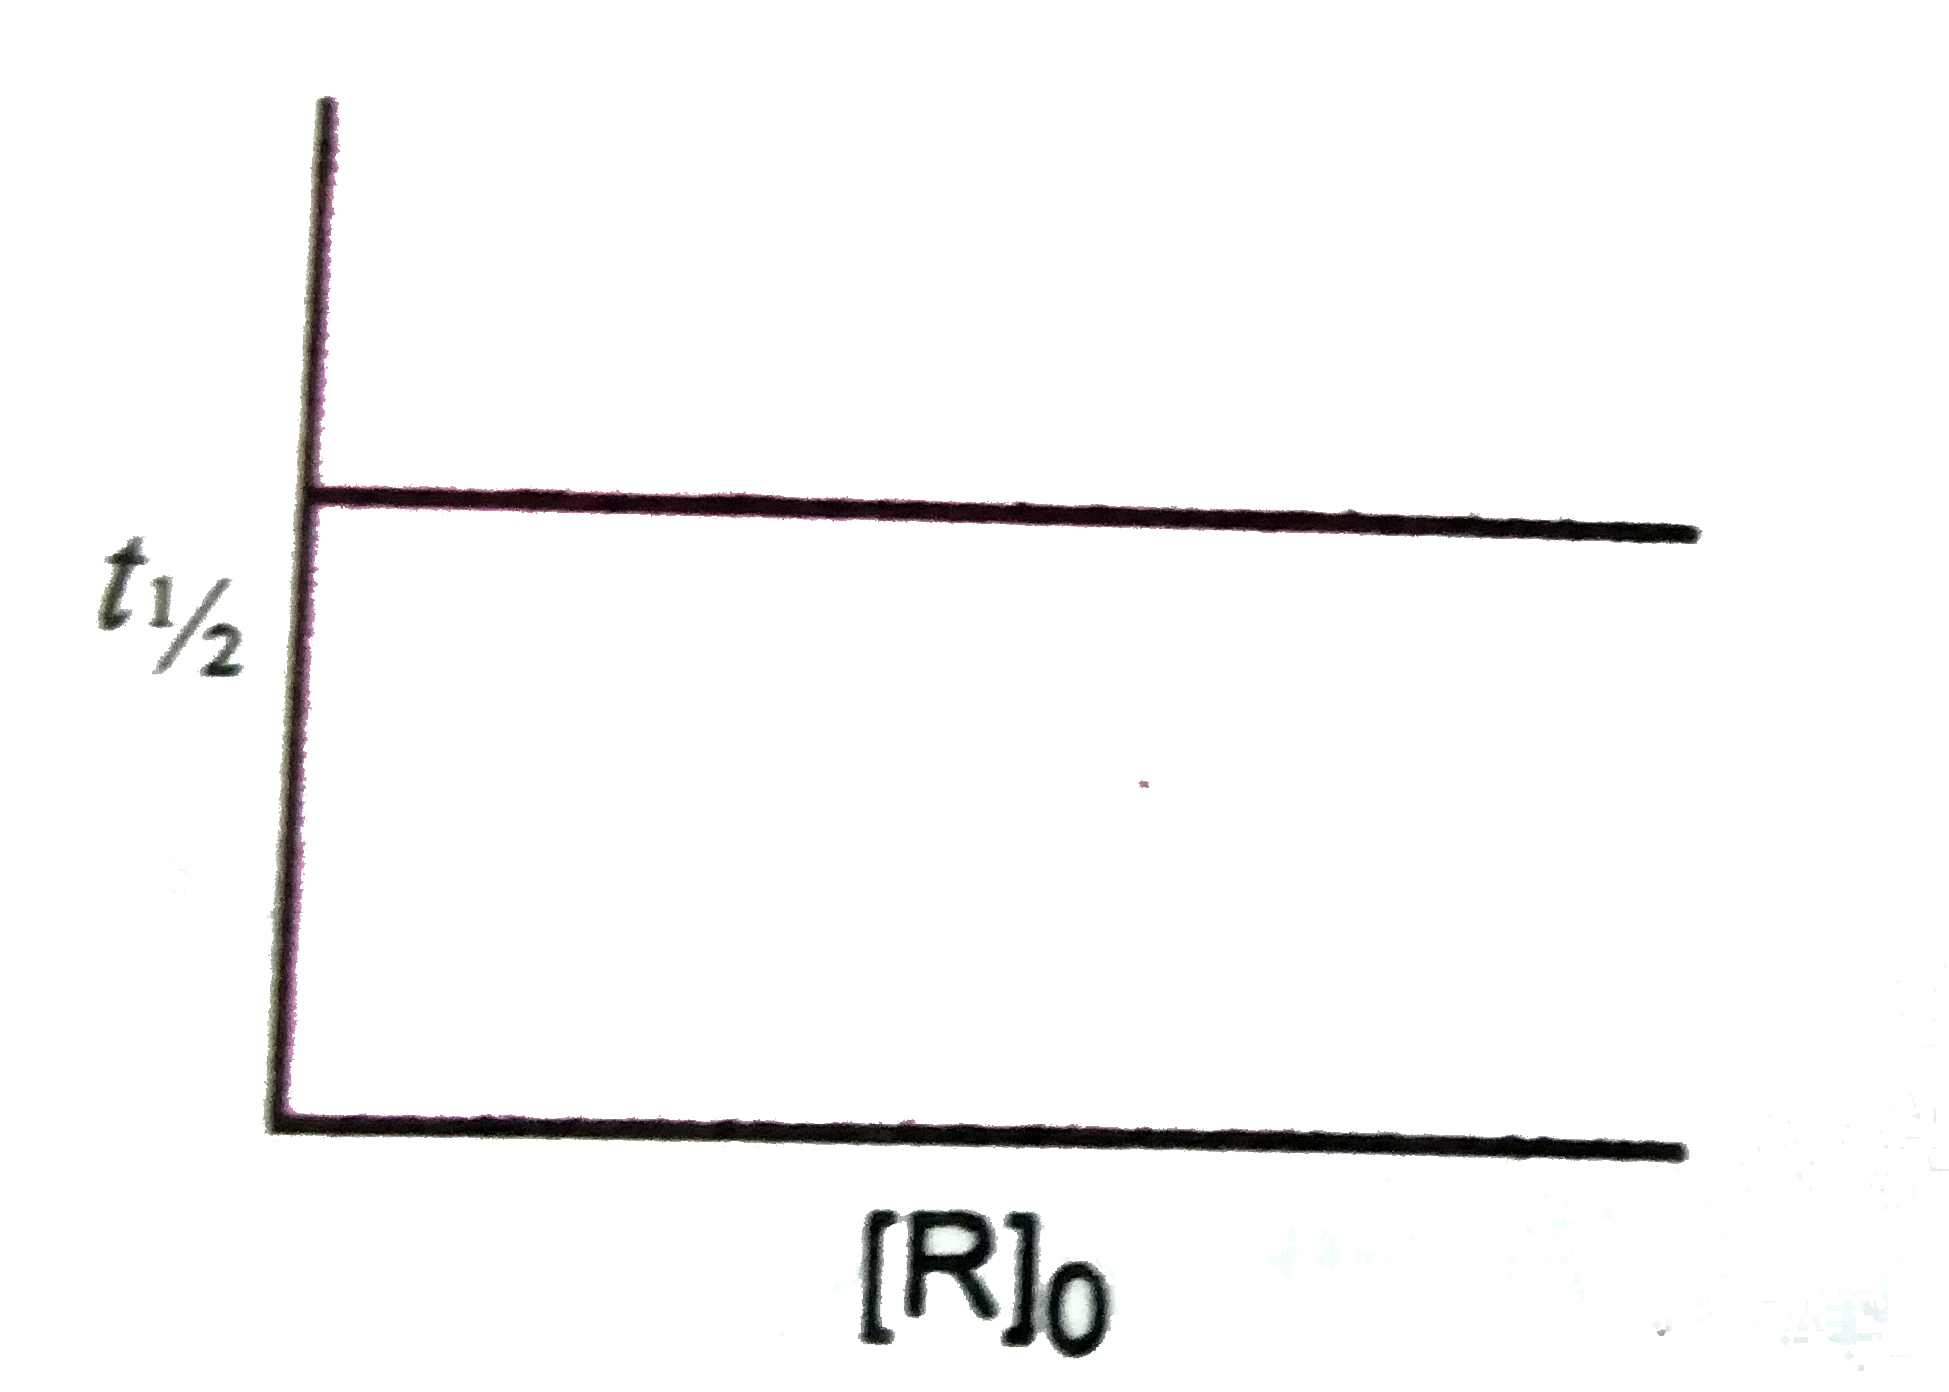 B
B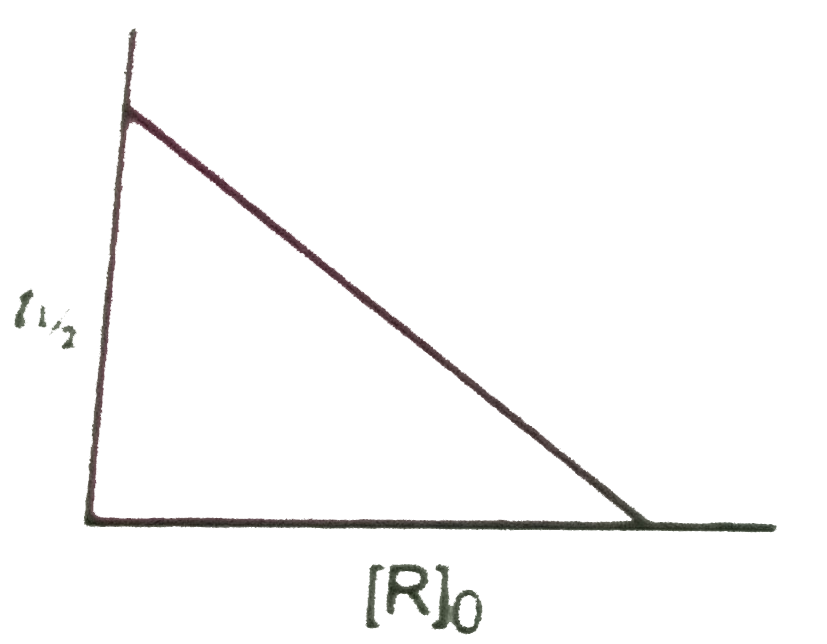 C
C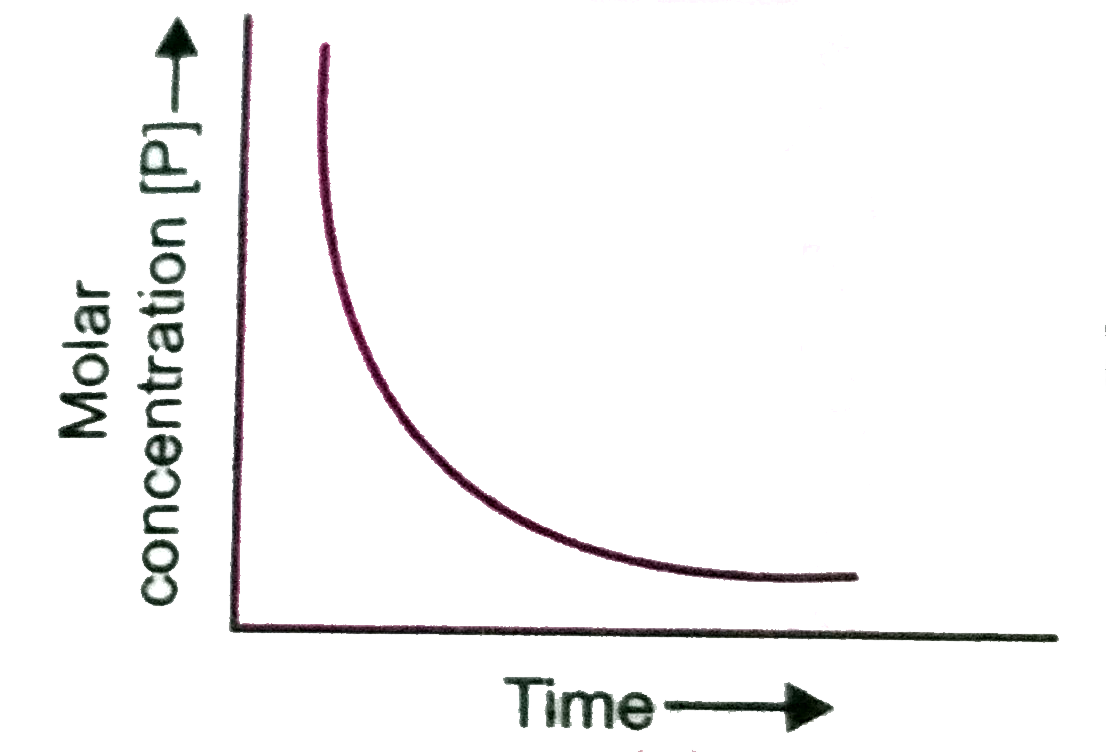 D
D
Which of the following graphs is correct for a first order reaction?
A B
B C
C D
D
Which of the following graphs is correct for a first order reaction ? (R→P)
View SolutionAccording to Boyle's law, PV = constant, at constant temperature. Which of the following graphs is correct?
View SolutionWhich of the following graph is correct between kinetic energy E, potential energy (U) and height (h) from the ground of the partical
View SolutionWhich of the following graphs is correct for the following reaction?
CH3−CH2CH=CH2H2/Ni−−−→300∘CCH3−CH2−CH2−CH3
View SolutionA circular ring carries a uniformly distributed positive charge and lies in the xy plane with center at the origin of the cooredinate system. If at a point (0,0,z) the electric field is E, then which of the following graphs is correct?
View Solution