The plot of ΔG versus temperature for the formation of oxides of elements is called
Ellingham diagram
Free energy curve
Entropy curve
Isobar
The correct Answer is:A
To solve the question regarding the plot of ΔG versus temperature for the formation of oxides of elements, we can follow these steps:
1. Understanding the Question: The question asks for the name of a specific plot that represents the relationship between Gibbs free energy (ΔG) and temperature for the formation of oxides of elements.
2. Identifying the Relevant Concept: In thermodynamics and materials science, the stability of compounds, particularly oxides, can be analyzed through the Gibbs free energy changes associated with their formation at different temperatures.
3. Recognizing the Diagram: The plot of ΔG versus temperature for the formation of oxides is known as the Ellingham diagram. This diagram is crucial in predicting the feasibility of thermal reduction of metal ores.
4. Understanding the Ellingham Diagram: The Ellingham diagram consists of curves that represent the Gibbs free energy change for the formation of various metal oxides as a function of temperature. Each curve corresponds to a specific metal oxide.
5. Application of the Diagram: The Ellingham diagram helps in determining the ease of reduction of metal oxides. It indicates at what temperature a metal oxide can be reduced to its metal form using a reducing agent.
6. Conclusion: Therefore, the answer to the question is that the plot of ΔG versus temperature for the formation of oxides of elements is called the Ellingham diagram.
Final Answer:
The plot of ΔG versus temperature for the formation of oxides of elements is called the Ellingham diagram.
---
The plot of ΔG versus temperature for the formation of oxides of elements is called the Ellingham diagram.
Topper's Solved these Questions
- GENERAL PRINCIPLES AND PROCESSES OF ISOLATION OF ELEMENTSBOOK - AAKASH INSTITUTECHAPTER - GENERAL PRINCIPLES AND PROCESSES OF ISOLATION OF ELEMENTSEXERCISE - Assignment (Section-A) Objective type Question
30 Videos
- GENERAL PRINCIPLES AND PROCESSES OF ISOLATION OF ELEMENTSBOOK - AAKASH INSTITUTECHAPTER - GENERAL PRINCIPLES AND PROCESSES OF ISOLATION OF ELEMENTSEXERCISE - Assignment (Section-B) Objective type Question
25 Videos
- GENERAL PRINCIPLES AND PROCESSES OF ISOLATION OF ELEMENTSBOOK - AAKASH INSTITUTECHAPTER - GENERAL PRINCIPLES AND PROCESSES OF ISOLATION OF ELEMENTSEXERCISE - Try yourself
33 Videos
- EQUILIBRIUMBOOK - AAKASH INSTITUTECHAPTER - EQUILIBRIUMEXERCISE - ASSIGNMENT (SECTION -D)
20 Videos
- GENERAL PRINCIPLES AND PROCESSES OF ISOLATION OF ELEMENTSBOOK - AAKASH INSTITUTECHAPTER - GENERAL PRINCIPLES AND PROCESSES OF ISOLATION OF ELEMENTSEXERCISE - Try Yourself
33 Videos
Similar Questions
Knowledge Check
The choice of reducing agent for metal oxide is decided by thermodynamic principles of metallurgy. ΔG must be negative. Ellingham diagram is a plot of ΔfG0 vs T for the formation of oxides of various elements. All the plots slope upwards when temperature increases. Each plot is a straight line except when some change in phase takes place. A metal will reduce the oxide of other metals which lie above it in this diagram.
ΔG0 vs T plot in the Ellingham's diagram slopes downward for the reaction.AMg+12O2→MgOB2Ag+12O2→Ag2OCC+12O2→CODCO+12O2→CO2The choice of reducing agent for metal oxide is decided by thermodynamic principles of metallurgy. ΔG must be negative. Ellingham diagram is a plot of ΔfG0 vs T for the formation of oxides of various elements. All the plots slope upwards when temperature increases. Each plot is a straight line except when some change in phase takes place. A metal will reduce the oxide of other metals which lie above it in this diagram.
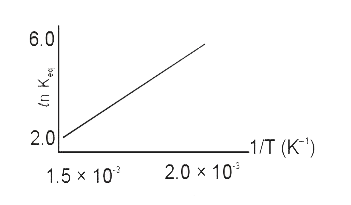
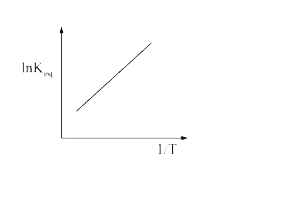
At a temperature below 1623 K. Al cannot reduceAFeOBCrOCMgODNiOA schematic plot of ln Keq versus inverse of temperature for a reaction is shown below

The reaction must beAendothermicBexothermicChighly spontaneous at ordinary temperatureDone with negligible enthalpy change
(ΔH−ΔU) for the formation of carbon monoxide (CO) from its elements at 298K is
(R=8.314K−1mol−1)
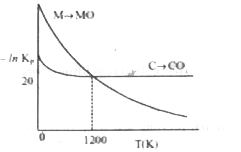
View SolutionThe plot shows the variation of −InKp versus temperature for the two reactions.
M(s)+12O2(g)→MO(s)andC(s)+12O2(g)→CO(s)

Identify the correct statement :
View SolutionThe plot of In k versus 1T is liner with slope of
View SolutionThe series of reaction resulting in the oxidation of glucose leading to the formation of pyruative is called
View SolutionThe plote between concentration versus time for a zero order reaction is represented by :
View Solution

