A Triple Bar Chart is:-
One dimensional
Two dimensional
Three dimensional
All the above.
The correct Answer is:C
C
Topper's Solved these Questions
- DIAGRAMSBOOK - SK AGGARWALACHAPTER - DIAGRAMSEXERCISE - Short answer
3 Videos
- DIAGRAMSBOOK - SK AGGARWALACHAPTER - DIAGRAMSEXERCISE - Shot answer II
5 Videos
- DEMANDBOOK - SK AGGARWALACHAPTER - DEMANDEXERCISE - VALUE BASED
2 Videos
- ECONOMY AND ECONOMIC PROBLEMBOOK - SK AGGARWALACHAPTER - ECONOMY AND ECONOMIC PROBLEMEXERCISE - SOME IMPORTANT
3 Videos
Similar Questions
Triple Point
View SolutionTriple Point
View SolutionThe given bar chart shows the sales of books in four metro branches of a company for the years 2014 and 2015.
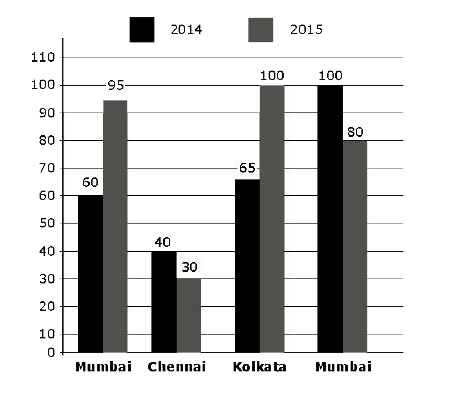
In the given bar chart, which branch has the highest increase in sale in 2015 as compared to 2014?
View SolutionThe given bar chart shows the sales of books in four metro branches of a company for the years 2014 and 2015.
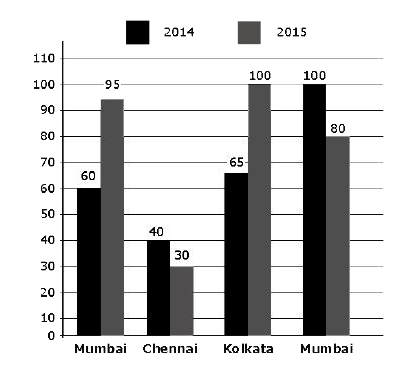
In the given bar chart, calculate the percentage increment of sales between the year 2014 and 2015.
View SolutionThe given bar chart shows the sales of books in four metro branches ofa company for the years 2014 and 2015
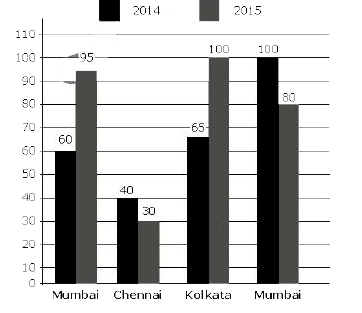
In the given bar chart the ratio the total sales between Mumbai and Delhi is
View SolutionThe given bar chart production of steel by companies A , B, c and D for years 2014 ,2015, 2016
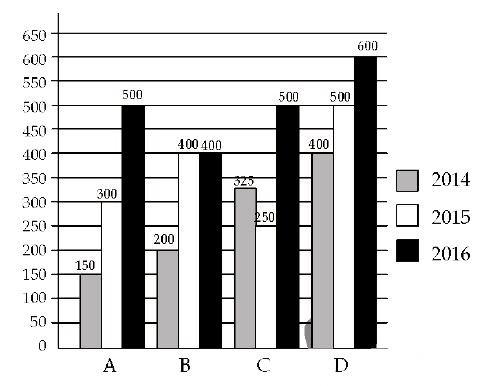
In the given bar chart which company has the maximum total production of steel
View SolutionThe given bar chart shows population of 4 different states in 3 years
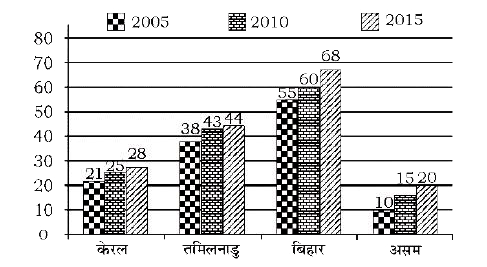
In the given bar chart, what is the ratio of increase in population in Bihar between 2005 and 2010 to that between 2010 and 2015
View SolutionThe given bar chart shows population of 4 different states in 3 years
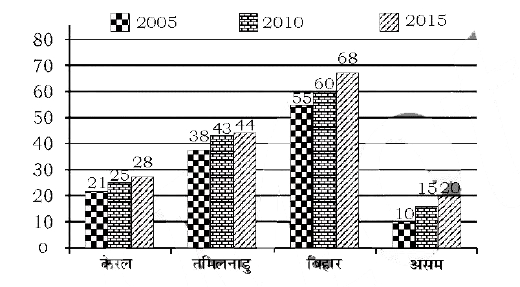
In the given bar chart, what is the population growth in total in states kerala and tamil nadu for the period between 2005 and 2015?
View SolutionThe given bar chart shows number of marks scored by a student in each subject in three years
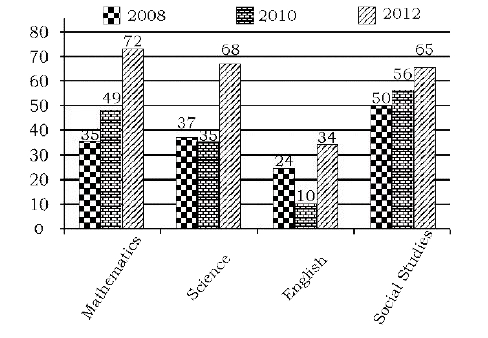
In the given bar chart what is the approximate percentage increase in marks in mathematics in 2012 compared to 2008?
View SolutionThe given bar chart shows number of marks scored by a student in each subject in three years
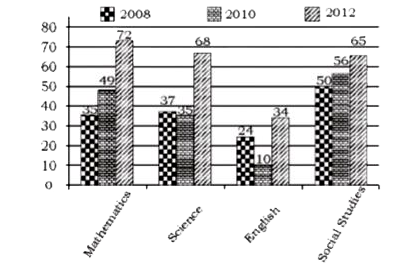
In the given bar chart, in which subject was the lowest marks scored in 2010
View Solution
