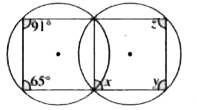
दी गई आकृति में कुछ कोणों को x,y और z से चिह्नित किया गया है। इन कोणों के मान ज्ञात कीजिए।

Step by step video & image solution for दी गई आकृति में कुछ कोणों को x,y और z से चिह्नित किया गया है। इन कोणों के मान ज्ञात कीजिए। by Maths experts to help you in doubts & scoring excellent marks in Class 10 exams.
Updated on:21/07/2023Topper's Solved these Questions
- वृत्तBOOK - SANJEEV PUBLICATIONCHAPTER - वृत्तEXERCISE - अन्य महत्त्वपूर्ण प्रश्न (निबन्धात्मक प्रश्न)
7 Videos
- वृत्तBOOK - SANJEEV PUBLICATIONCHAPTER - वृत्तEXERCISE - अन्य महत्त्वपूर्ण प्रश्न (अतिलघूत्तरात्मक प्रश्न)
17 Videos
- वास्तविक संख्याएँBOOK - SANJEEV PUBLICATIONCHAPTER - वास्तविक संख्याएँEXERCISE - अन्य महत्वपूर्ण प्रश्न (निबंधात्मकप्रश्न)
5 Videos
- वृत्त एवं स्पर्श रेखा BOOK - SANJEEV PUBLICATIONCHAPTER - वृत्त एवं स्पर्श रेखा EXERCISE - निबन्धात्मक प्रशन
8 Videos
Similar Questions
आकृति में, चाप AB = चाप CD है, सिद्ध कीजिए कि ∠A=∠B है।

View Solutionएक वृत्त की त्रिज्या 10 सेमी. है। इस वृत्त में दो बराबर और समान्तर जीवाओं केबीच की दूरी 12 सेमी है।जीवा की लम्बाई लिखिये।
View Solutionयूक्लिड विभाजन प्रमेयिका का प्रयोग कर दर्शाइए कि किसी धनात्मक पूर्णाक का वर्ग 3m या 3m+1 के रूप का होता है, जहाँ m कोई पूर्णाक है।
View Solutionएक वृत्त △ABC की भुजा BC को P पर बाह्य स्पर्श करता है तथा AB व AC को बढ़ाए जाने पर Q और R पर स्पर्श करता है तो सिद्ध कीजिए की AQ=12(triangleABC की परिमित )
View SolutionHow many lines of symmetry does the above figure have ?
View SolutionWhich of the following are correct chain isomers of butane ? (i)
View SolutionDetermine the point of symmetry of a regular hexagon.
View SolutionDtermine the images of the following figure about the given line :
View SolutionMatch the following Column A to Column B

View SolutionMatch the following Column A to Column B

View SolutionMatch the following Column A to Column B

View SolutionFind the area of the figure given below.

View SolutionThe inequation represented by the graph given below is :
View SolutionThe inequation that best describes the graph given below is _________
View SolutionThe inequation that best describes the following graph is _________
View SolutionWhich inequations represent the shaded region in the given figure
View Solution
