(a) The graph given below represents the organisms response to temperature as an environmental condition.
(i) Which one of the two lines represents conformers and why ?
(ii) What does the other line in the graph represent and why ?
(b) Mention the different adaptations the parasites have evolved with, to be able to successfully complete their life cycles in their hosts.
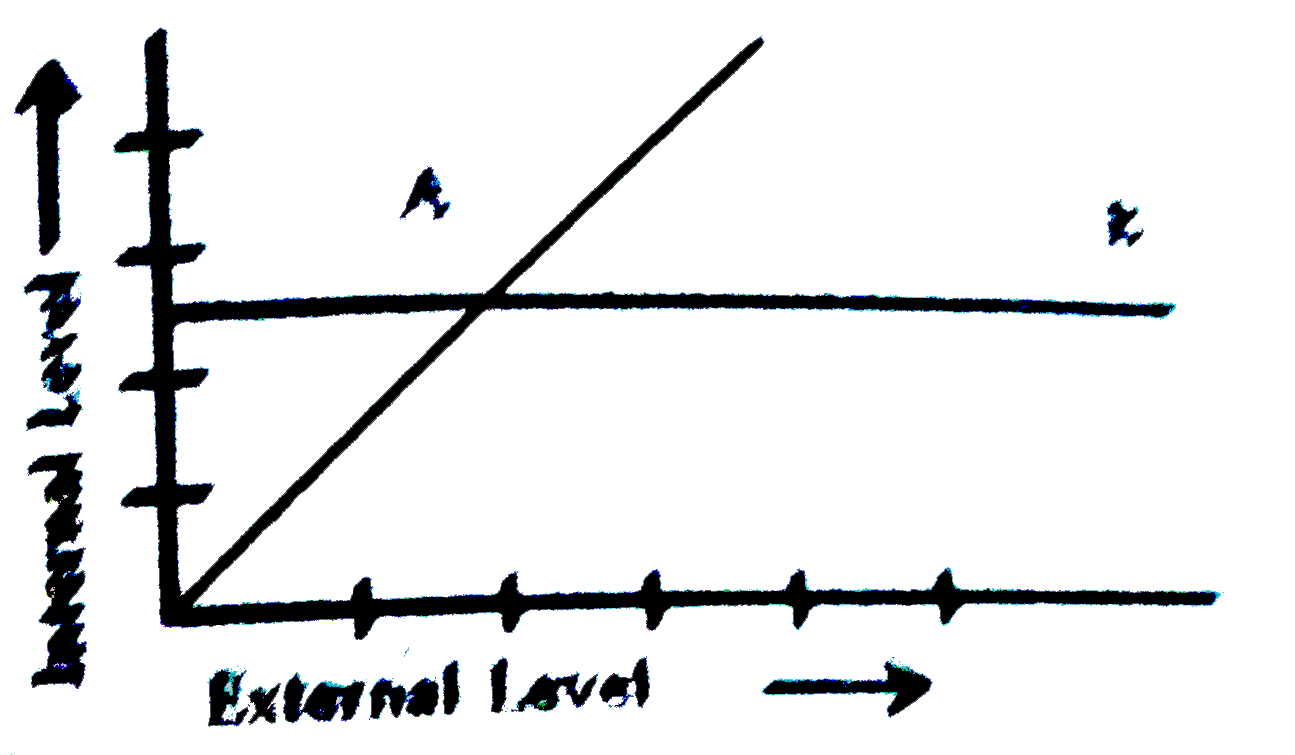
(i) Conformers : Aquatic animals and plants in which the osmotic concentration of body fluids changes according to the ambient conditions of water are called conformers.
(ii) Regulators : Some organisms are able to maintain homeostasis by physiological means which ensures constant body temperature, constant osmotic concentration etc.
Topper's Solved these Questions
- BOOK - XII BOARDS PREVIOUS YEARCHAPTER - XII BOARDSEXERCISE - Delhi Board : Set II Section-A1videos
XII BOARDS
- BOOK - XII BOARDS PREVIOUS YEARCHAPTER - XII BOARDSEXERCISE - DELHI BOARD : SET-III (SECTION -A)2videos
XII BOARDS
- BOOK - XII BOARDS PREVIOUS YEARCHAPTER - XII BOARDSEXERCISE - OUTSIDE DELHI: SET III (SECTION A)2videos
XII BOARDS
- BOOK - XII BOARDS PREVIOUS YEARCHAPTER - SAMPLE PAPER 2019EXERCISE - Section E Part B3videos
SAMPLE PAPER 2019
Similar Questions
The graph given below represents the organisms reponse to temperature as an environmental conditions :
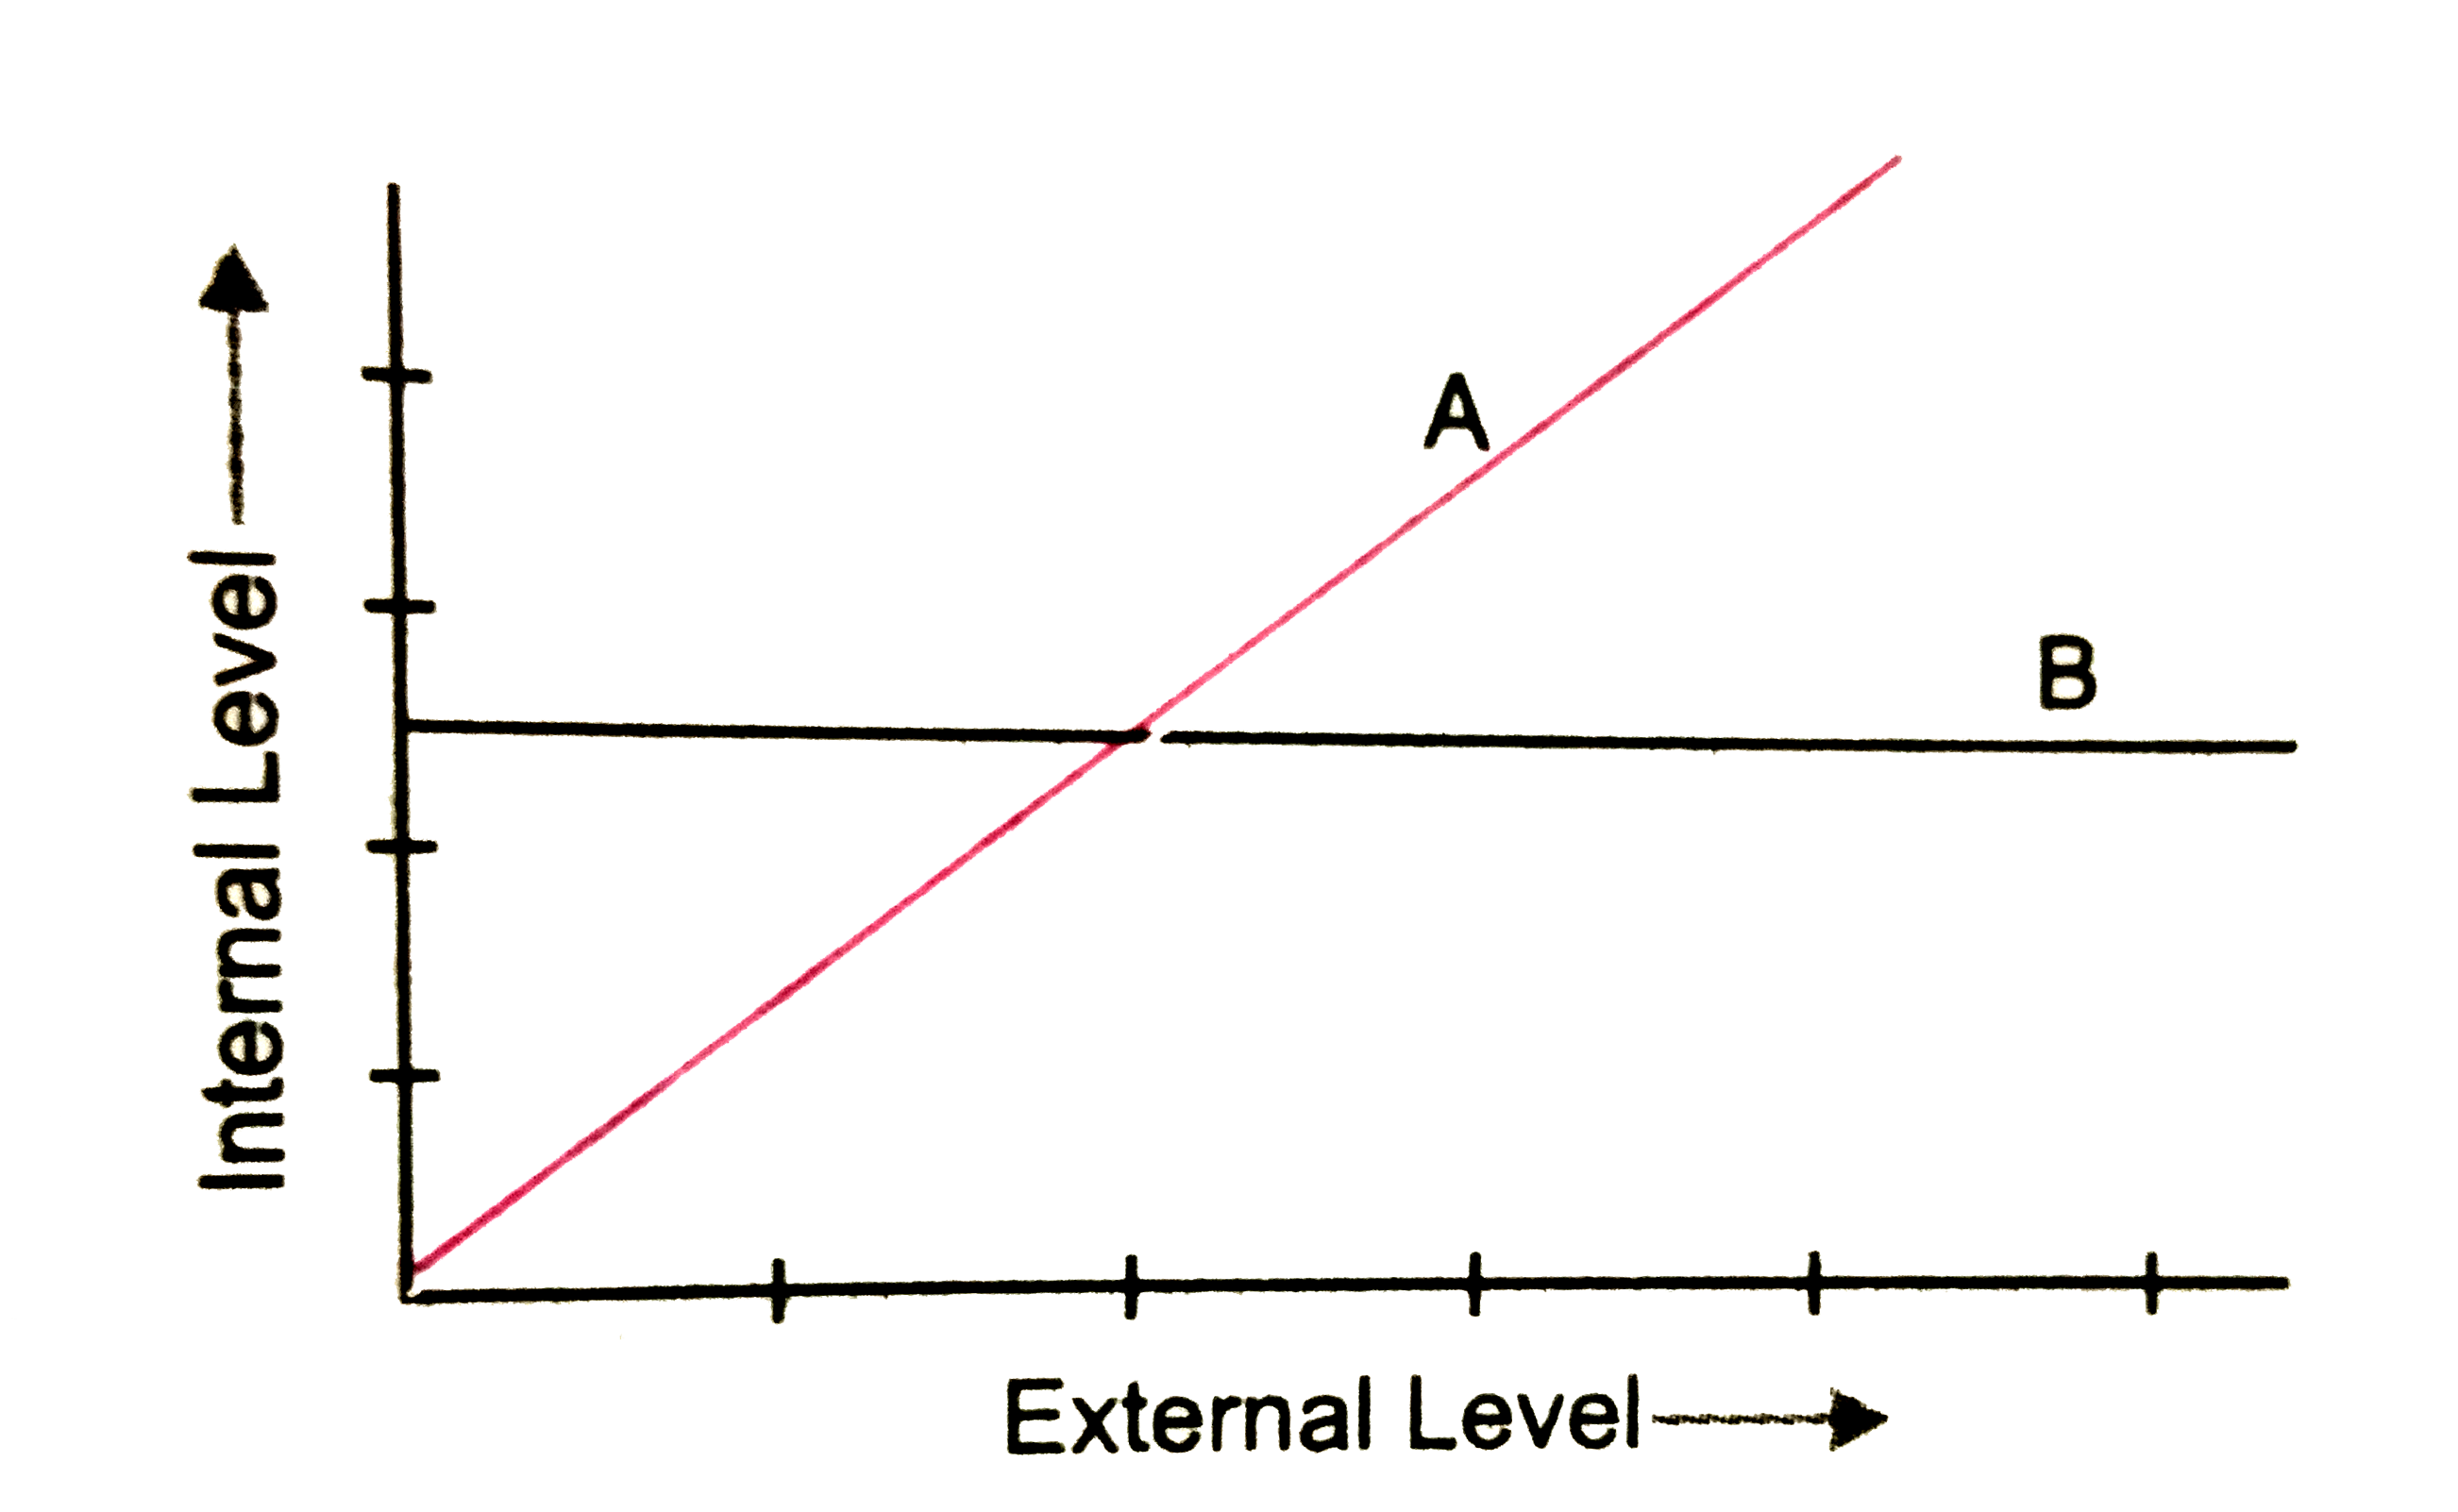
(i) Which one of the two lines represents conformers and why ?
(ii) What does the other line in the graph represent and why ?
(b) Mention the different adaptations the parasites have evolved with , to be able to successfuly complete their life cycle in their hosts.View SolutionGiven below is the graph representing two linear equations by lines AB and CD respectively. What is the area of the triangle formed by these two lines and the line is x=0 ?
 View Solution
Knowledge Check
- Question 1 - Select One
The graph given below represents changes in different ecological parameters due to effluent mixing in a stream. The three lines A, B anc C represent
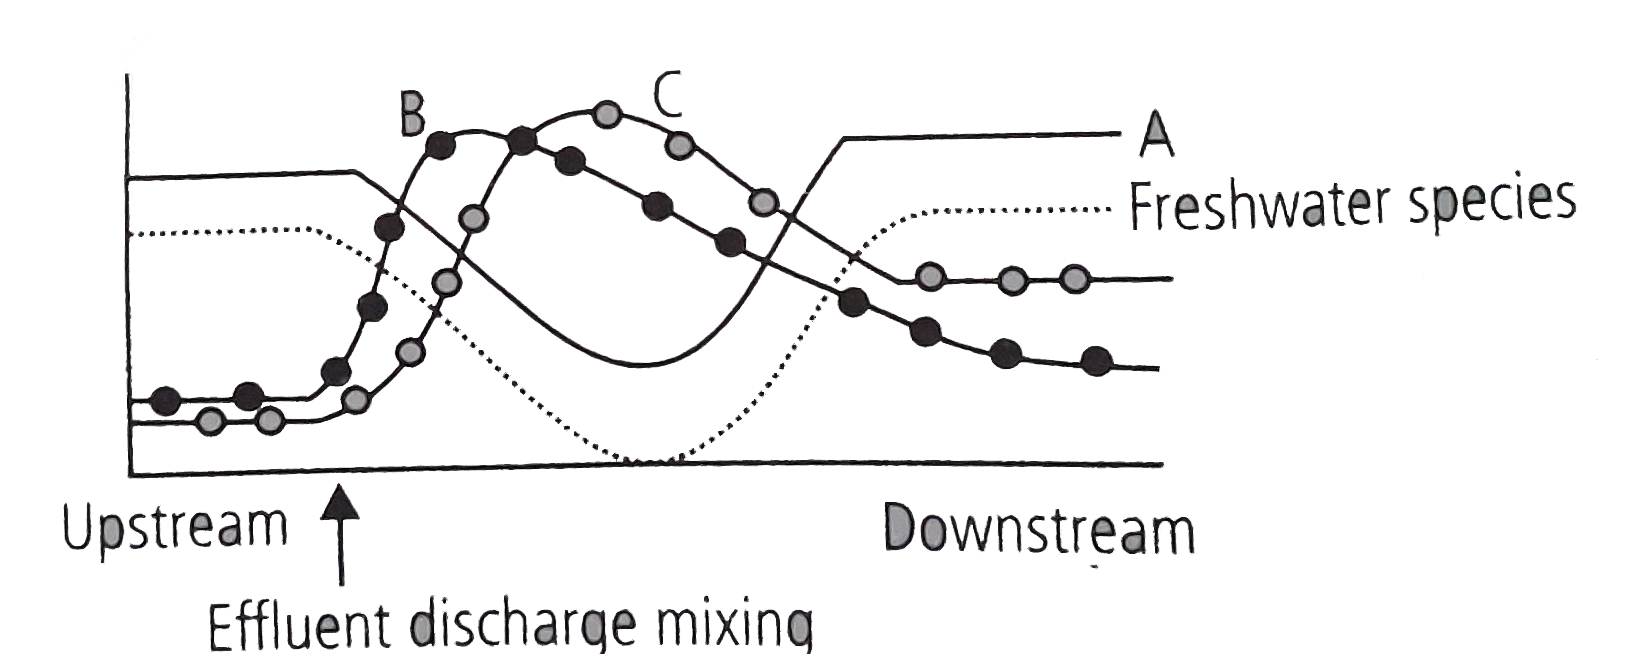 AA: oxygen concentration
B: biological O2 demand
C: pollution resistant speciesBA: pollutan
B: aerobic process
C: anaerobic processCA: oxygen concentration
B: CO2 concentration
C: termperatureDA: phosphate concentration
B: nitrate concentration
C: rate of photosynthesis.
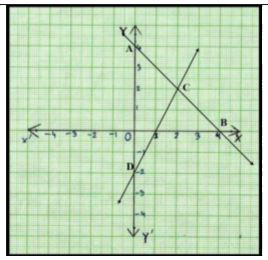
Given below is the graph representing two linear equations by lines AB and CD respectively. What is the area of the triangle formed by these two lines and the line x=0?
 View Solution
Study the picture given below and answer the questions that follows:
(i) What does this picture represent?
(ii) Mention some consequences of partition.
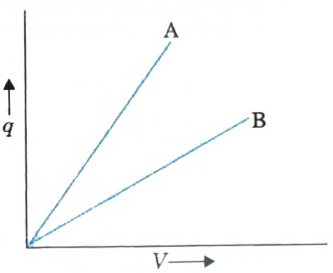
(iii) Which year is being denoted in the picture?View SolutionTwo capacitors C1andC2 have the same separation between the plates but the plate area of C2 is twice that of C1. The given graph shows the variation of q with V. Which of the two lines in the graph represents C1 and why?
 View Solution
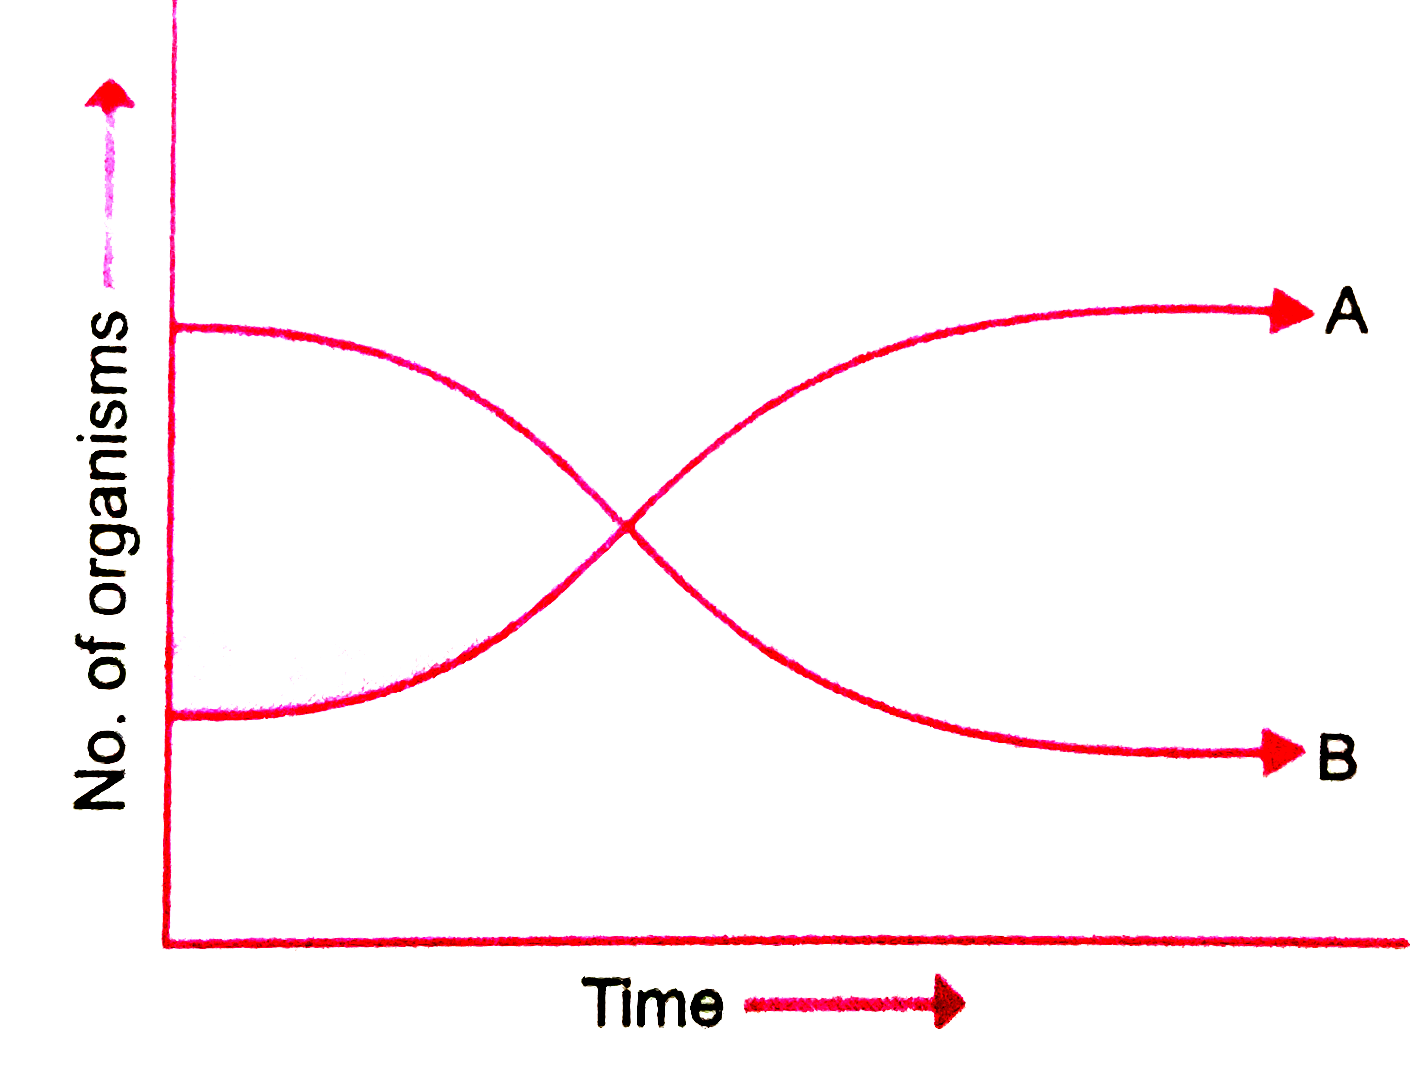
(a) The graph below represents the growth patterns of types of aquatic organisms over a brief period of time in a water body surrounded by an agricultural land extensively supplied with fertilizers. Identify what would represent (i) A and (ii) B
(b) State the reason for such a change in the water body and also write the term given to it.
 View Solution
The graph given below represents three categories of organismic responses - L, M and N to cope with stressful conditions. Identify the categories L and M.
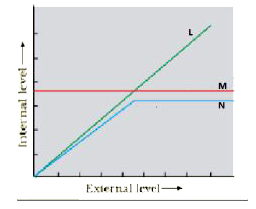
Given below are examples of some of the activities performed by animals. Categorise these activities into the appropriate kind of the organismic response (L, M or N) as shown in the graph with reasons.
i. In summers we sweat profusely.
ii. Sometimes desert lizards bask in the sun and sometimes they move into shade.View SolutionThe graph given below shows the marks obtained out of 10 by Sonia in two different tests. Study the graph and answer the questions that follow.
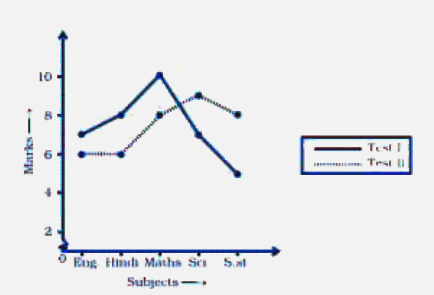
(a) What information is represented by the axes?
(b) In which subject did she score the highest in Test I?
(c) In which subject did she score the least in Test II?
(d) In which subject did she score the same marks in both the Tests?
(e) What are the marks scored by her in English in Test II?
(f) In which test was the performance better?
(g) In which subject and which test did she score full marks?View SolutionFigure shows the two crop fields [Plots A and B ] have been treated by manures and chemical fertilisers respectively , keeping other environmental factor same . Observe the graph and answer the following question.
(i) Why does plot B show sudden increase and then gradual decrease in yield?
(ii) Why is the highest peak in plot A graph slightly delayed ?
(iii) What is the reason for the different pattern of the graphs ?
 View Solution

