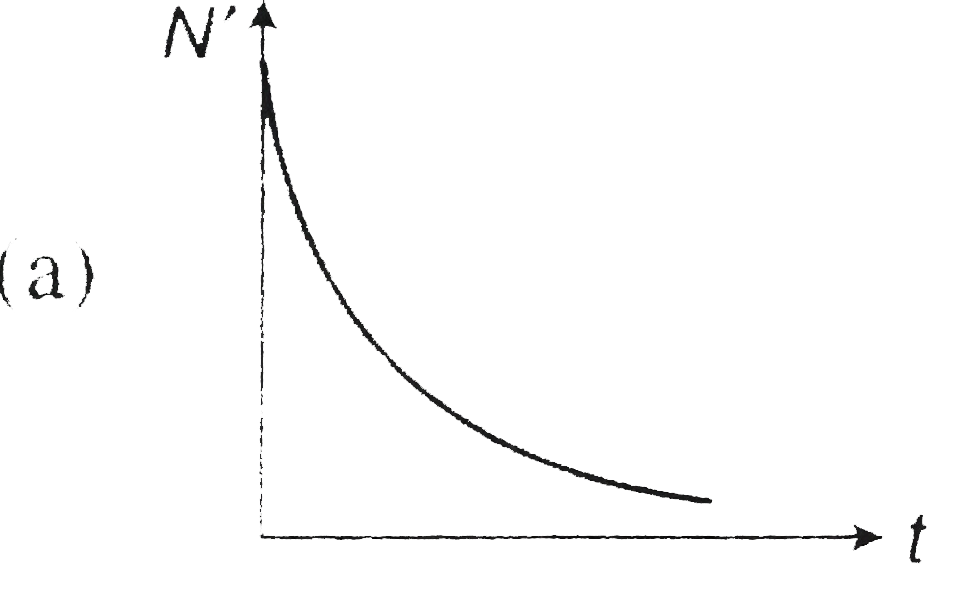
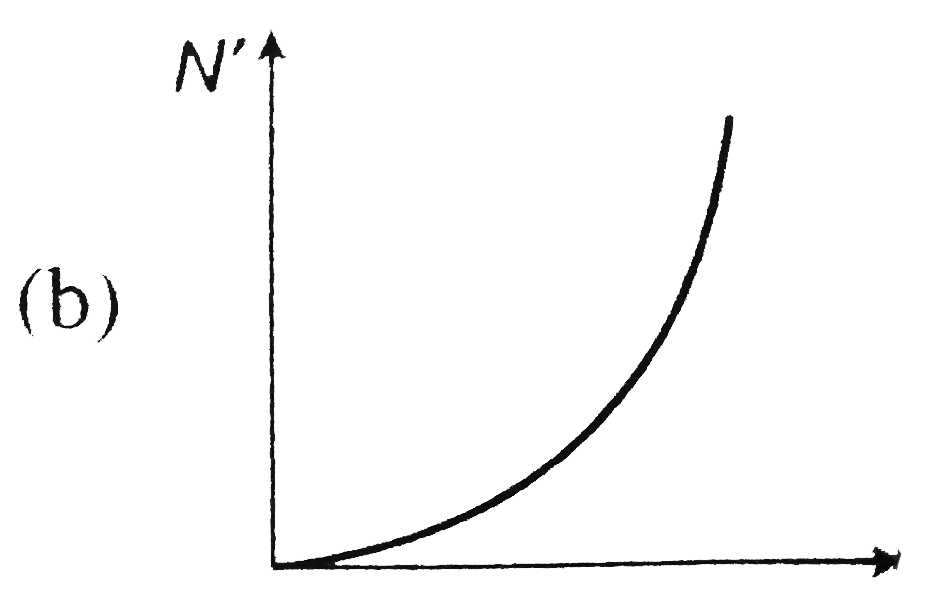
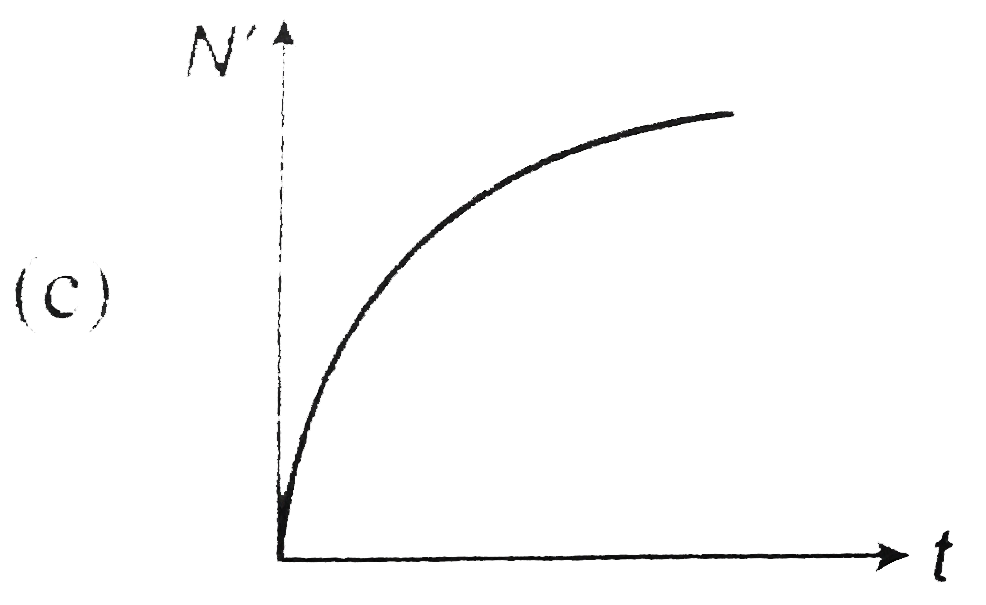
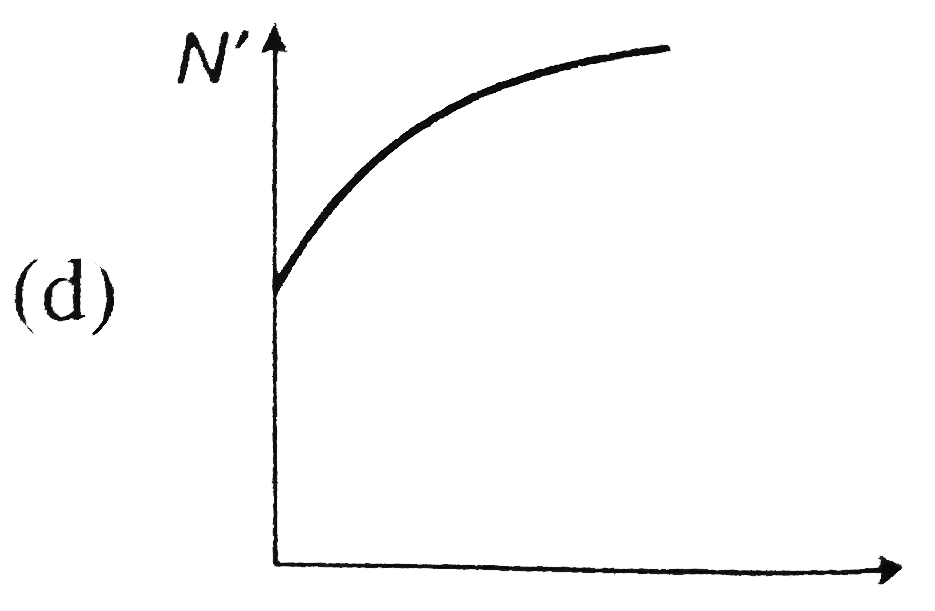
The rate of disintegration of a radioactive sample is R and the number of atoms present at any time t is N. When RN is taken along Y-axis and t is taken along X-axis, the correct graphs is
A

B

C

D

Text Solution
The correct Answer is:D
Law of radioactive decay is given as ,

dNdt=−λN
where,dNdt=
rate of disintegration
So,
R=−λN⇒RN=−λ= constant
where, λ= decay constant
So, the graph RN versus t is as,
So the correct graph shown in option (d).
|
Topper's Solved these Questions
- AP EAMCET SOLVED PAPER 2018 ( 23-04-2019,SHIFT -1)BOOK - TS EAMCET PREVIOUS YEAR PAPERSCHAPTER - AP EAMCET SOLVED PAPER 2018 ( 23-04-2019,SHIFT -1)EXERCISE - Physics
40 Videos
- AP EAMCET SOLVED PAPER 2019 (22-04-2019, SHIFT-2)BOOK - TS EAMCET PREVIOUS YEAR PAPERSCHAPTER - AP EAMCET SOLVED PAPER 2019 (22-04-2019, SHIFT-2)EXERCISE - PHYSICS
40 Videos
Similar Questions
Knowledge Check
The graph between number of decayed atoms N' of a radioactive element and time t is.
A .B
.B .C
.C .D
.D .
.A graph is drawn with a force along y-axis and time along x-axis. The area under the graph represent–
AMomentumBCoupleCMoment of the forceDImpulse of the forceThe rate of decay of a radioactive sampel is given by R1 at time t1 and R2 at a later time. t2. The mean life of this radioactive sample is:
AT=R1R2×t2t1BT=t1−t2In(R2/R1)CT=t2−t1In(R2/R1)DT=In(R2/R1)t1−t2
The rate of decay of a radioactive sample is R1 at time t1 and R2 at time t2. Calculate the mean liffe of sample.
View SolutionA radioactive sample has N0 active at t=0 . If the rate of disintegration at any time is R and the number of atoms is N, them the ratio R/N varies with time as.
View SolutionIf a cooling curve is drawn taking t(s) along X−axis and temperature (θ) along Y−axis, it appers as
View SolutionA graph is plotted taking .∘C along the Y-axis and .∘F along the X-axis. It is a/an
View SolutionA radioactive sample has N0 active at t=0 . If the rate of disintegration at any time is R and the number of atoms is N, them the ratio R/N varies with time as.
View Solution
