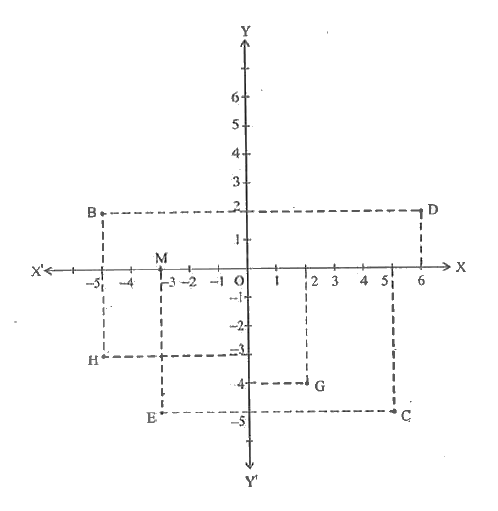
See fig and write the

The co-ordinates of B Solution in Kannada
The correct Answer is:
Step by step video, text & image solution for See fig and write the The co-ordinates of B by Maths experts to help you in doubts & scoring excellent marks in Class 9 exams.
Topper's Solved these Questions
- BOOK - SUBHASH PUBLICATIONCHAPTER - CO-ORDINATE GEOMETRY EXERCISE - EXERCISE 9.31videos
CO-ORDINATE GEOMETRY
- BOOK - SUBHASH PUBLICATIONCHAPTER - CO-ORDINATE GEOMETRY EXERCISE - EXERCISE 9.31videos
CO-ORDINATE GEOMETRY
- BOOK - SUBHASH PUBLICATIONCHAPTER - CIRCLESEXERCISE - EXERCISE 12.67videos
CIRCLES
- BOOK - SUBHASH PUBLICATIONCHAPTER - HERON'S FORMULAEXERCISE - EXERCISE 8.25videos
HERON'S FORMULA
Similar Questions
In which quandrant or on which axis do each of the points (−2,4),(3,−1),(−1,0),(1,2)and(−3,−5) lie ? Verify you answer by locating them on the cartesian plane.
01:37View SolutionIn which quandrant or on which axis do each of the points (−2,4),(3,−1),(−1,0),(1,2)and(−3,−5) lie ? Verify you answer by locating them on the cartesian plane.
06:07View SolutionProve that the line of centres of two intersecting circles subtends equal angles at the two points of intersection.
02:11View SolutionA park, in the shape of a quadrilateral ABCD, has C=90∘, AB = 9 m, BC = 12 m, CD = 5 m and AD = 8m.
How much area does it occupy?01:31View SolutionHow many lines of symmetry does the above figure have ?
02:45View SolutionWhich of the following are correct chain isomers of butane ? (i)
02:17View SolutionDetermine the point of symmetry of a regular hexagon.
05:41View SolutionDtermine the images of the following figure about the given line :
02:21View SolutionMatch the following Column A to Column B
 02:10View Solution
Match the following Column A to Column B
 02:17View Solution
Match the following Column A to Column B
 02:10View Solution
Find the area of the figure given below.
 04:23View Solution
The inequation represented by the graph given below is :
01:13View SolutionThe inequation that best describes the graph given below is _________
01:21View SolutionThe inequation that best describes the following graph is _________
01:42View SolutionWhich inequations represent the shaded region in the given figure
06:00View Solution

