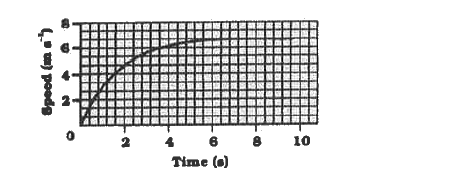
The speed-time graph for a car is shown is Fig.

Find how far does the car travel in the first 4 seconds. Shade the area on the graph that represents the distance travelled by the car during the period.Solution in Kannada
Distance travelled by car in the first 4 seconds nearly 12 m.
Similar Questions
Speed - time graph for a car is show in the fig 1.13: Find how far the car travelled in first 4 s. Shade the area on the graph that represents the distance travelled by car during this period. https://doubtnut-static.s.llnwi.net/static/physics_images/MBD_KHO_SCI_IX_C08_S01_035_Q01.png
View SolutionThe speed-time graph of a car is shown in figure given below Speed-time graph] (a) Find how far does the car travel in the first 4 second. Shade the area on the graph that represents the distance travelled by the car during the period. (b) Which part of the graph represents uniform motion of the car ?
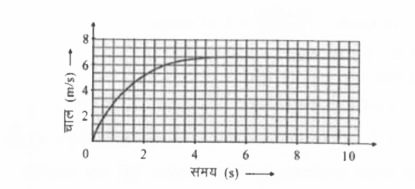
View Solutionकिसी कार का चाल-समय ग्राफ चित्र में दर्शाया गया है चाल (m/s) -

(1) पहले 4s में कार कितनी दूरी तय करती है ? इस अवधि में कार द्वारा तय की गई दूरी को ग्राफ में छायांकित क्षेत्र द्वारा दर्शाएँ।
(ii) ग्राफ का कौन-सा भाग कार की एकसमान गति को दर्शाता है ?
View SolutionThe position-time graph reading the motion of a car is given . Find out from the graph the distance travelled by the car in 8s.
View SolutionThe speed time graph for a car is shown in the figure.

find how far is the car travel in the first 4 seconds. Shade the area on the graph that represents the distance travelled by the car during the period.
View Solutionकिसी कार द्वारा चली गई दूरी व समय के बीच ग्राफ अंकित कीजिए।
View SolutionThe speed-time graph of a car is shown in figure given below Speed-time graph] (a) Find how far does the car travel in the first 4 second. Shade the area on the graph that represents the distance travelled by the car during the period. (b) Which part of the graph represents uniform motion of the car ?
View SolutionGiven a position-time graph related to the movement of a car. Find the distance the car traveled in 8 seconds from the graph.
View Solution
